Alexa Liaskovski

Aaron Kaplan
Visibility into email performance is indispensable to any organization that counts on its ability to reach people through their inboxes, including Datadog. SREs, FinOps, and many other teams rely on email as a critical channel for communications from our platform, including monitor alerts, usage reports, and service account notifications. At Datadog, we depend on the visibility provided by our integrations for Mailgun, SendGrid, and Amazon SES to optimize our email performance and ensure deliverability.
In this post, we’ll take a close look at how we use these integrations internally at Datadog to monitor the delivery of every email going through our app. In particular, we’ll explore the custom metrics we use to augment the out-of-the-box (OOTB) visibility provided by these integrations in order to closely analyze email performance and maintain the health of one of our platform’s vital lines of communication.
Creating cross-transport visibility for comprehensive delivery tracking
Our integrations for SendGrid, Mailgun, and Amazon SES use webhooks from each transport to collect events data and verify successful email delivery. In the email delivery life cycle, these events begin with the addition of messages to transports’ sending queues. From there, they cover a range of eventualities up to and including successful delivery. The key events we track are:
- Bounces, in which delivery attempts are rejected by receiving servers
- Drops, in which transports forgo delivery attempts based on previous issues with receiving servers
- Deferrals, or soft bounces, in which delivery temporarily fails and emails are added back into queues
All of this seems simple enough in principle. In practice, however, the data gets complicated, and we rely heavily on Datadog Log Management to create consistency and eliminate hurdles for analytics and troubleshooting. For example, these transports use inconsistent terminology in their logging of delivery events: SendGrid logs label bounce events Bounced with a type of Blocked, whereas Mailgun labels them Failed, with a reason of Suppress-Bounce. Our integrations for these transports include OOTB logs pipelines that do some massaging of log data upon intake for improved consistency. But we also use Log Management to standardize and enrich these logs, which helps us get a cohesive picture of email delivery patterns across all of our transports. Here’s how we standardize transport event names:
| SendGrid event names | Mailgun event names | Amazon SES event names | Standardized event names |
|---|---|---|---|
| @evt.name:processed | @evt.name:accepted | @evt.name:send | @evt.name:accepted |
| @evt.name:delivered | @evt.name:delivered | @evt.name:delivery | @evt.name:delivered |
| @evt.name:dropped | @evt.name:failed and @reason:suppress-bounce | @evt.name:deliverydelay | @evt.name:dropped |
| @evt.name:bounced | @evt.name:failed and @event-data.severity:permanent | @evt.name:bounce | @evt.name:bounced |
| @evt.name:deferred | @evt.name:failed and @event-data.severity:temporary | @evt.name:deliverydelay | @evt.name:deferred |
We’ve also customized the OOTB logs pipelines for our email transports. For example:
- We add
warninganderrorstatuses todeferredanddroppedevents, respectively. - We measure the delivery
lifetimeof each message by calculating the difference between email queuing and delivery times. - We extract domains from recipient email addresses in order to tag and group metrics by domain.
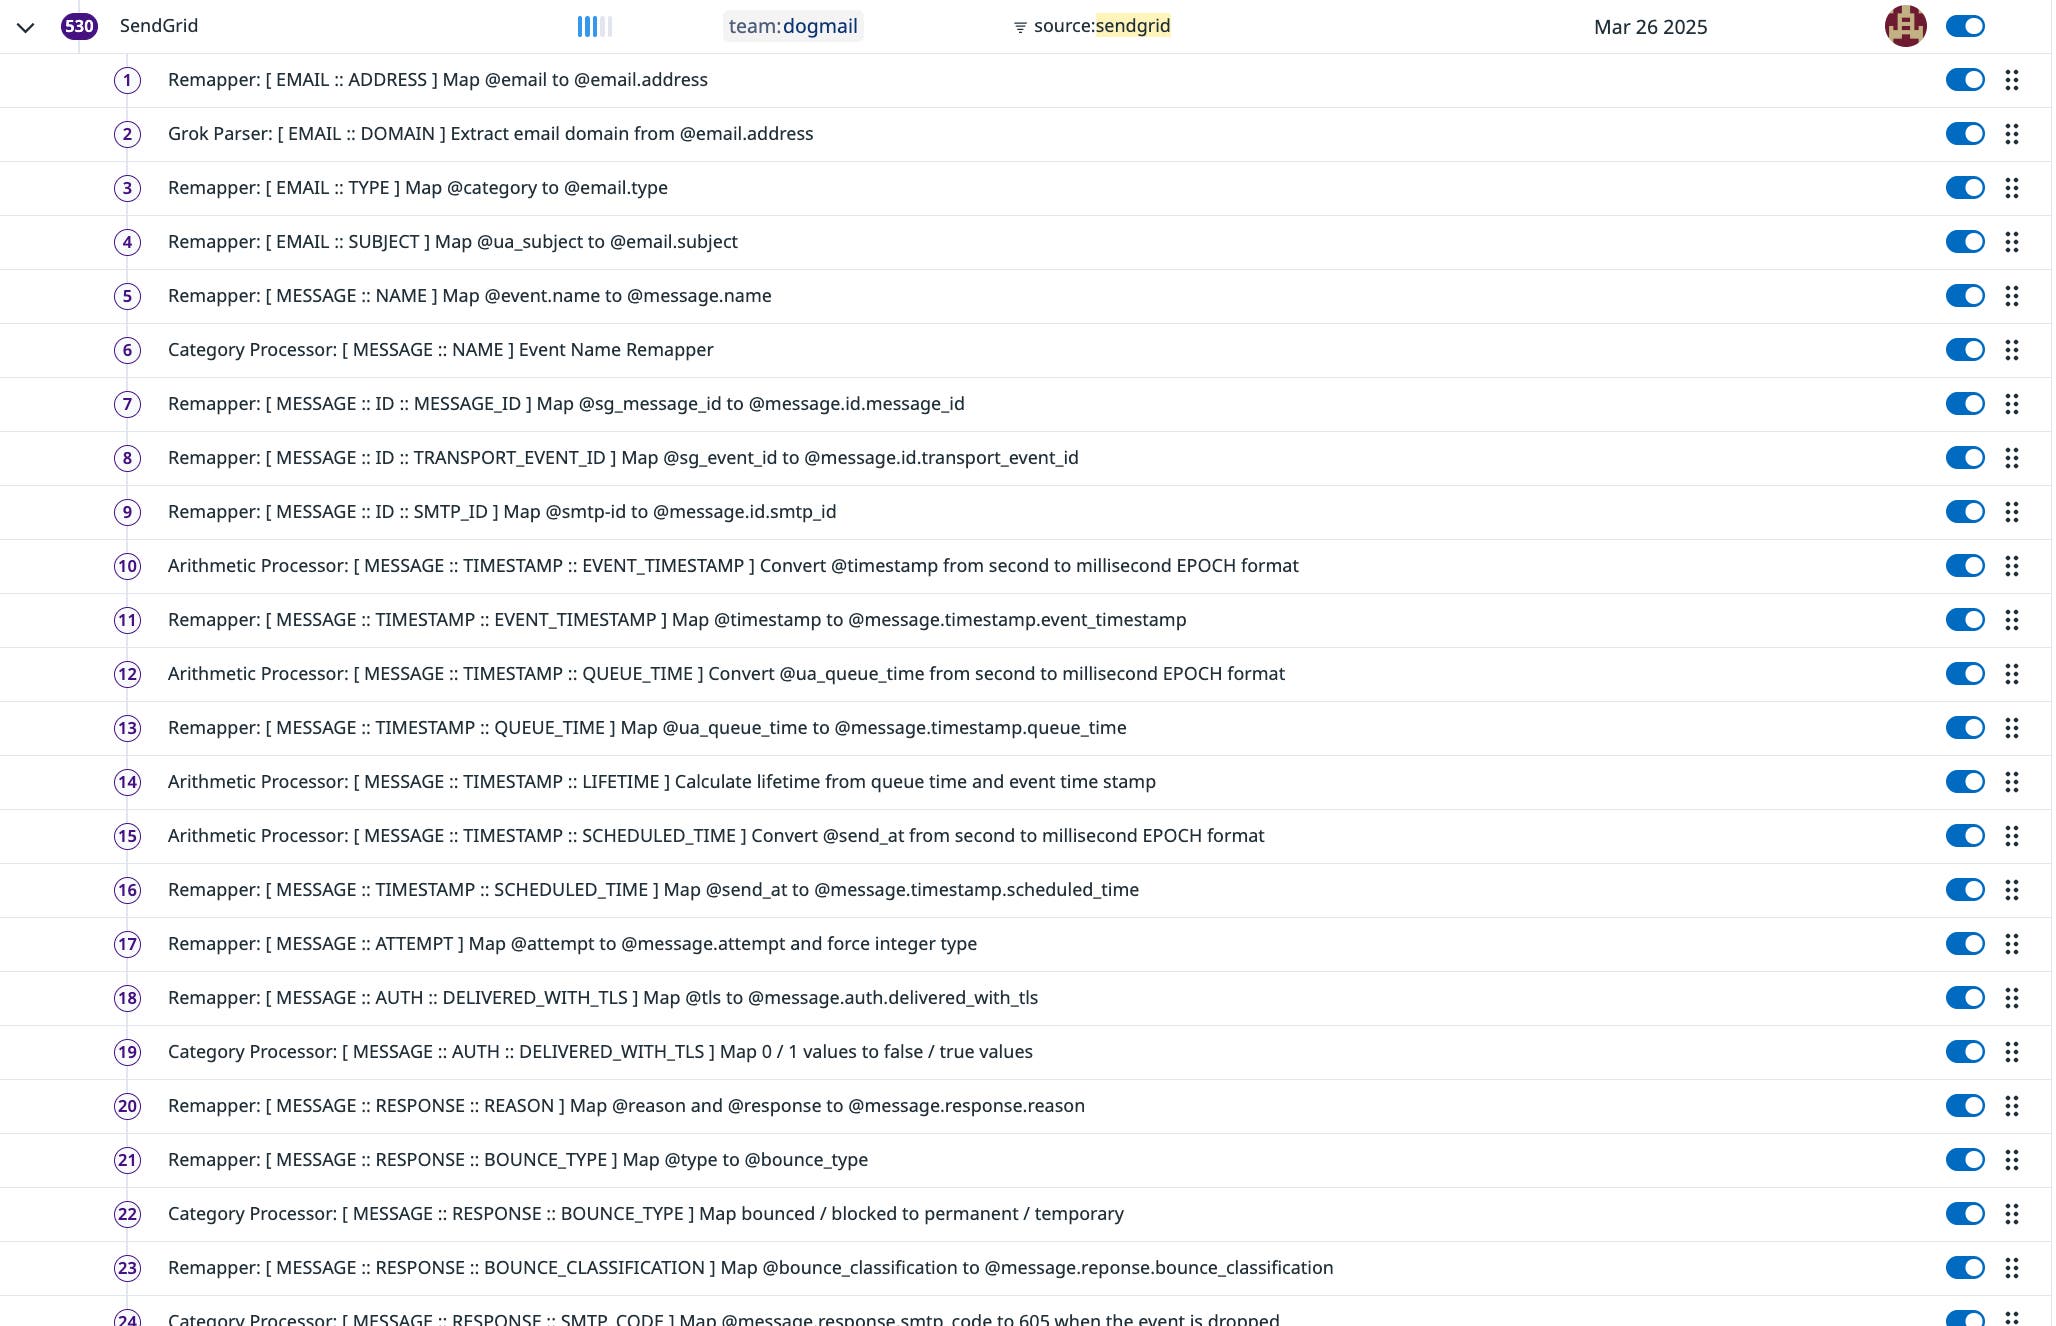
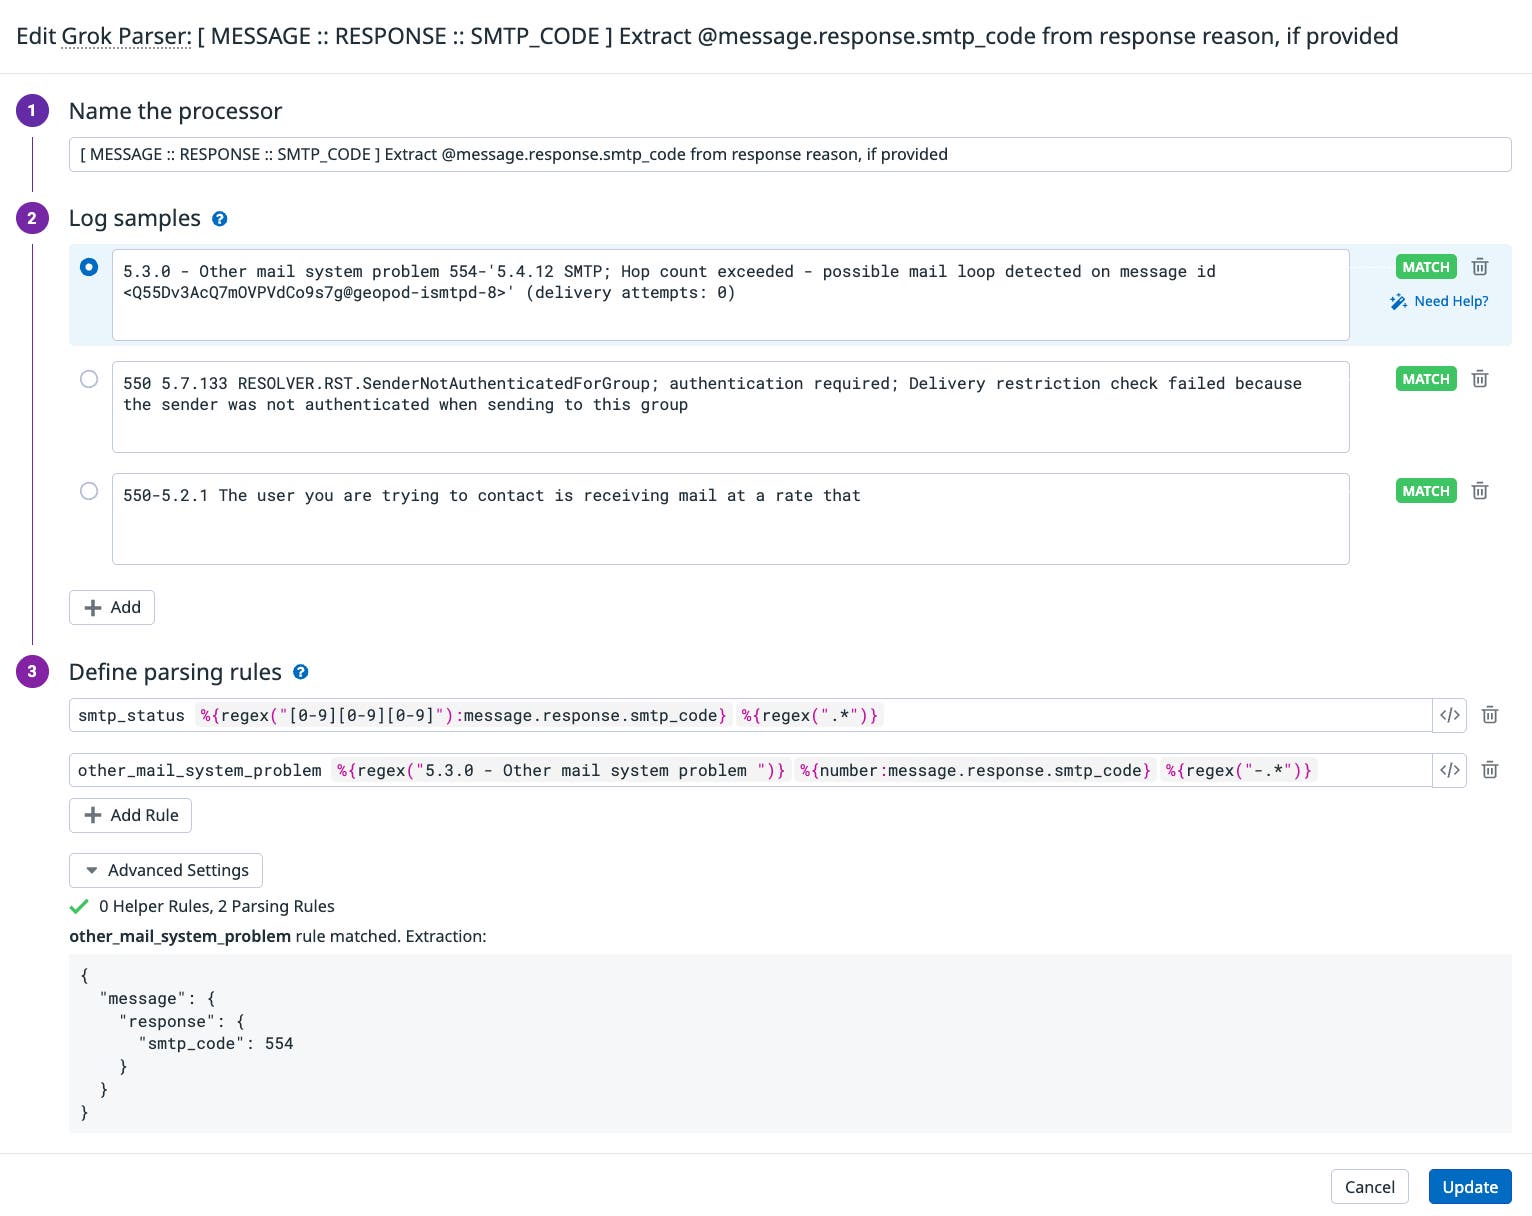
We also use Grok Parsers to analyze the reasons for bounces logged by our transports: Inconsistencies in reason values cause inconsistencies in our tagging, so by using Grok Parsers to extract data such as SMTP codes and remap common error messages to enforce consistency, we’re able to get a clearer picture of delivery issues at scale.
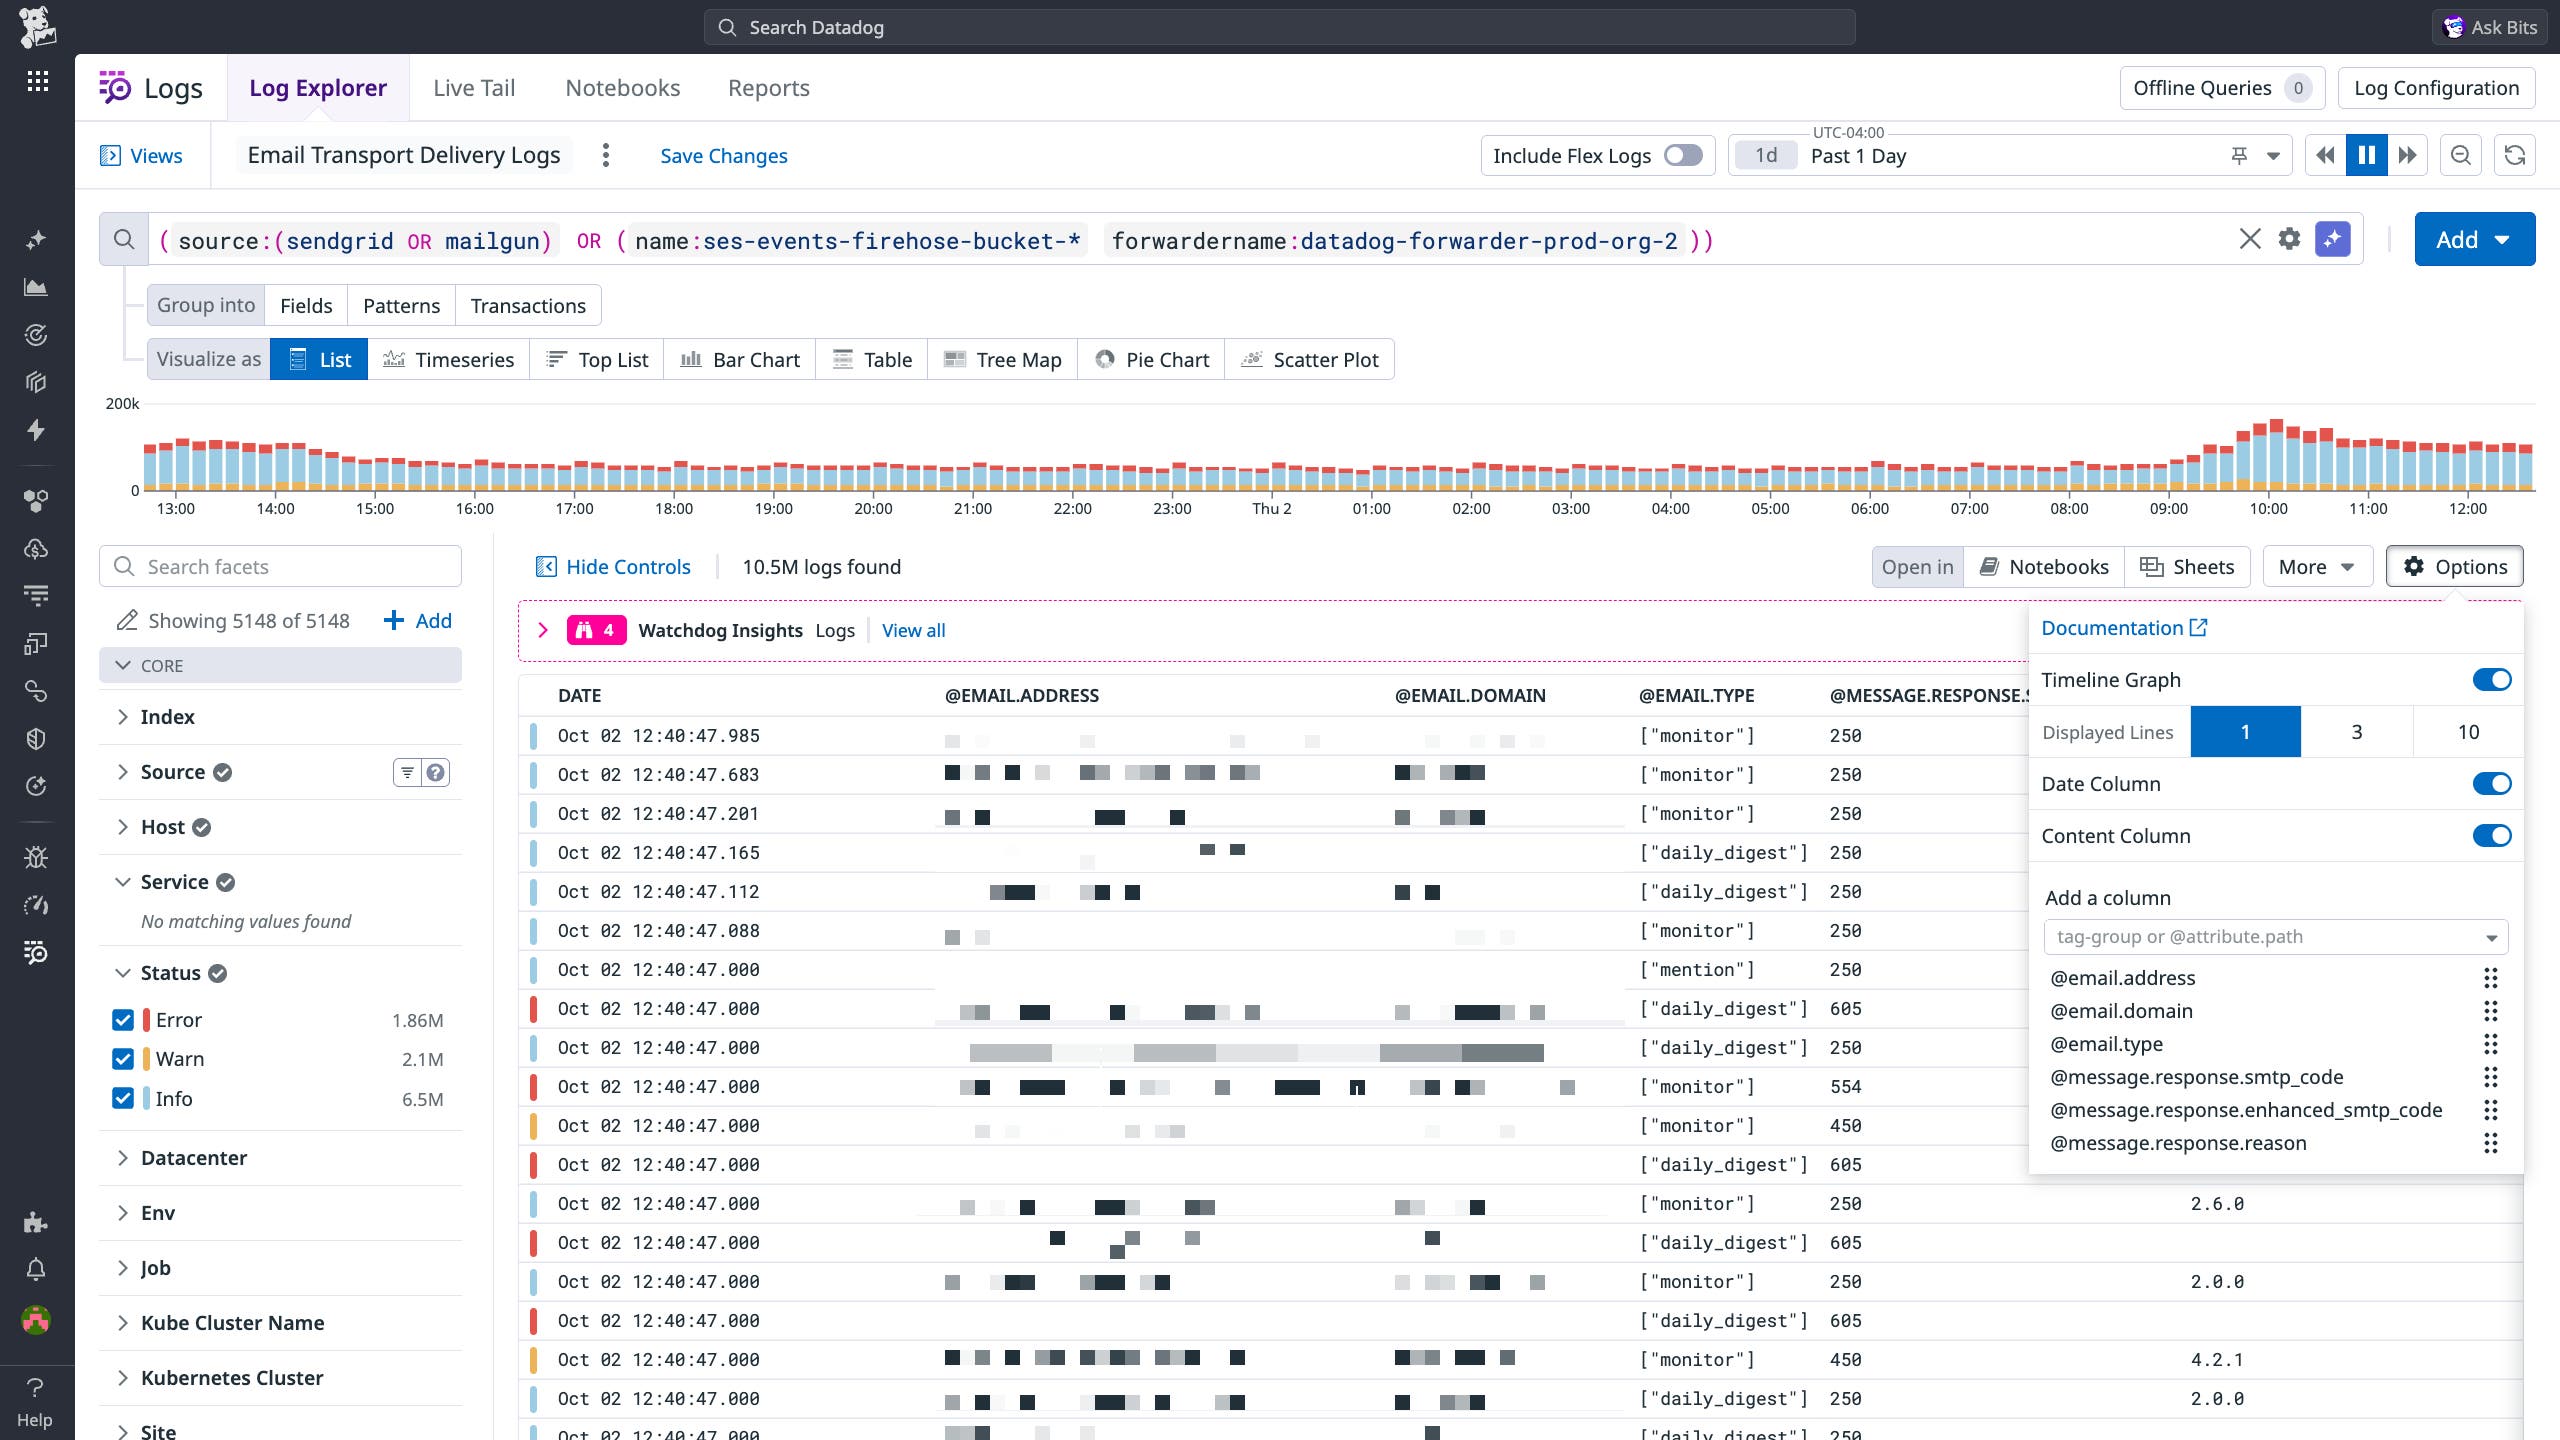
To facilitate troubleshooting of these issues, we use Saved Views to enable our support team to quickly search logs for outgoing emails. This way, support engineers can jump straight into targeted troubleshooting in the event that a customer reports that an email they were expecting from Datadog is not in their inbox.
Refining our visibility into email delivery via custom metrics
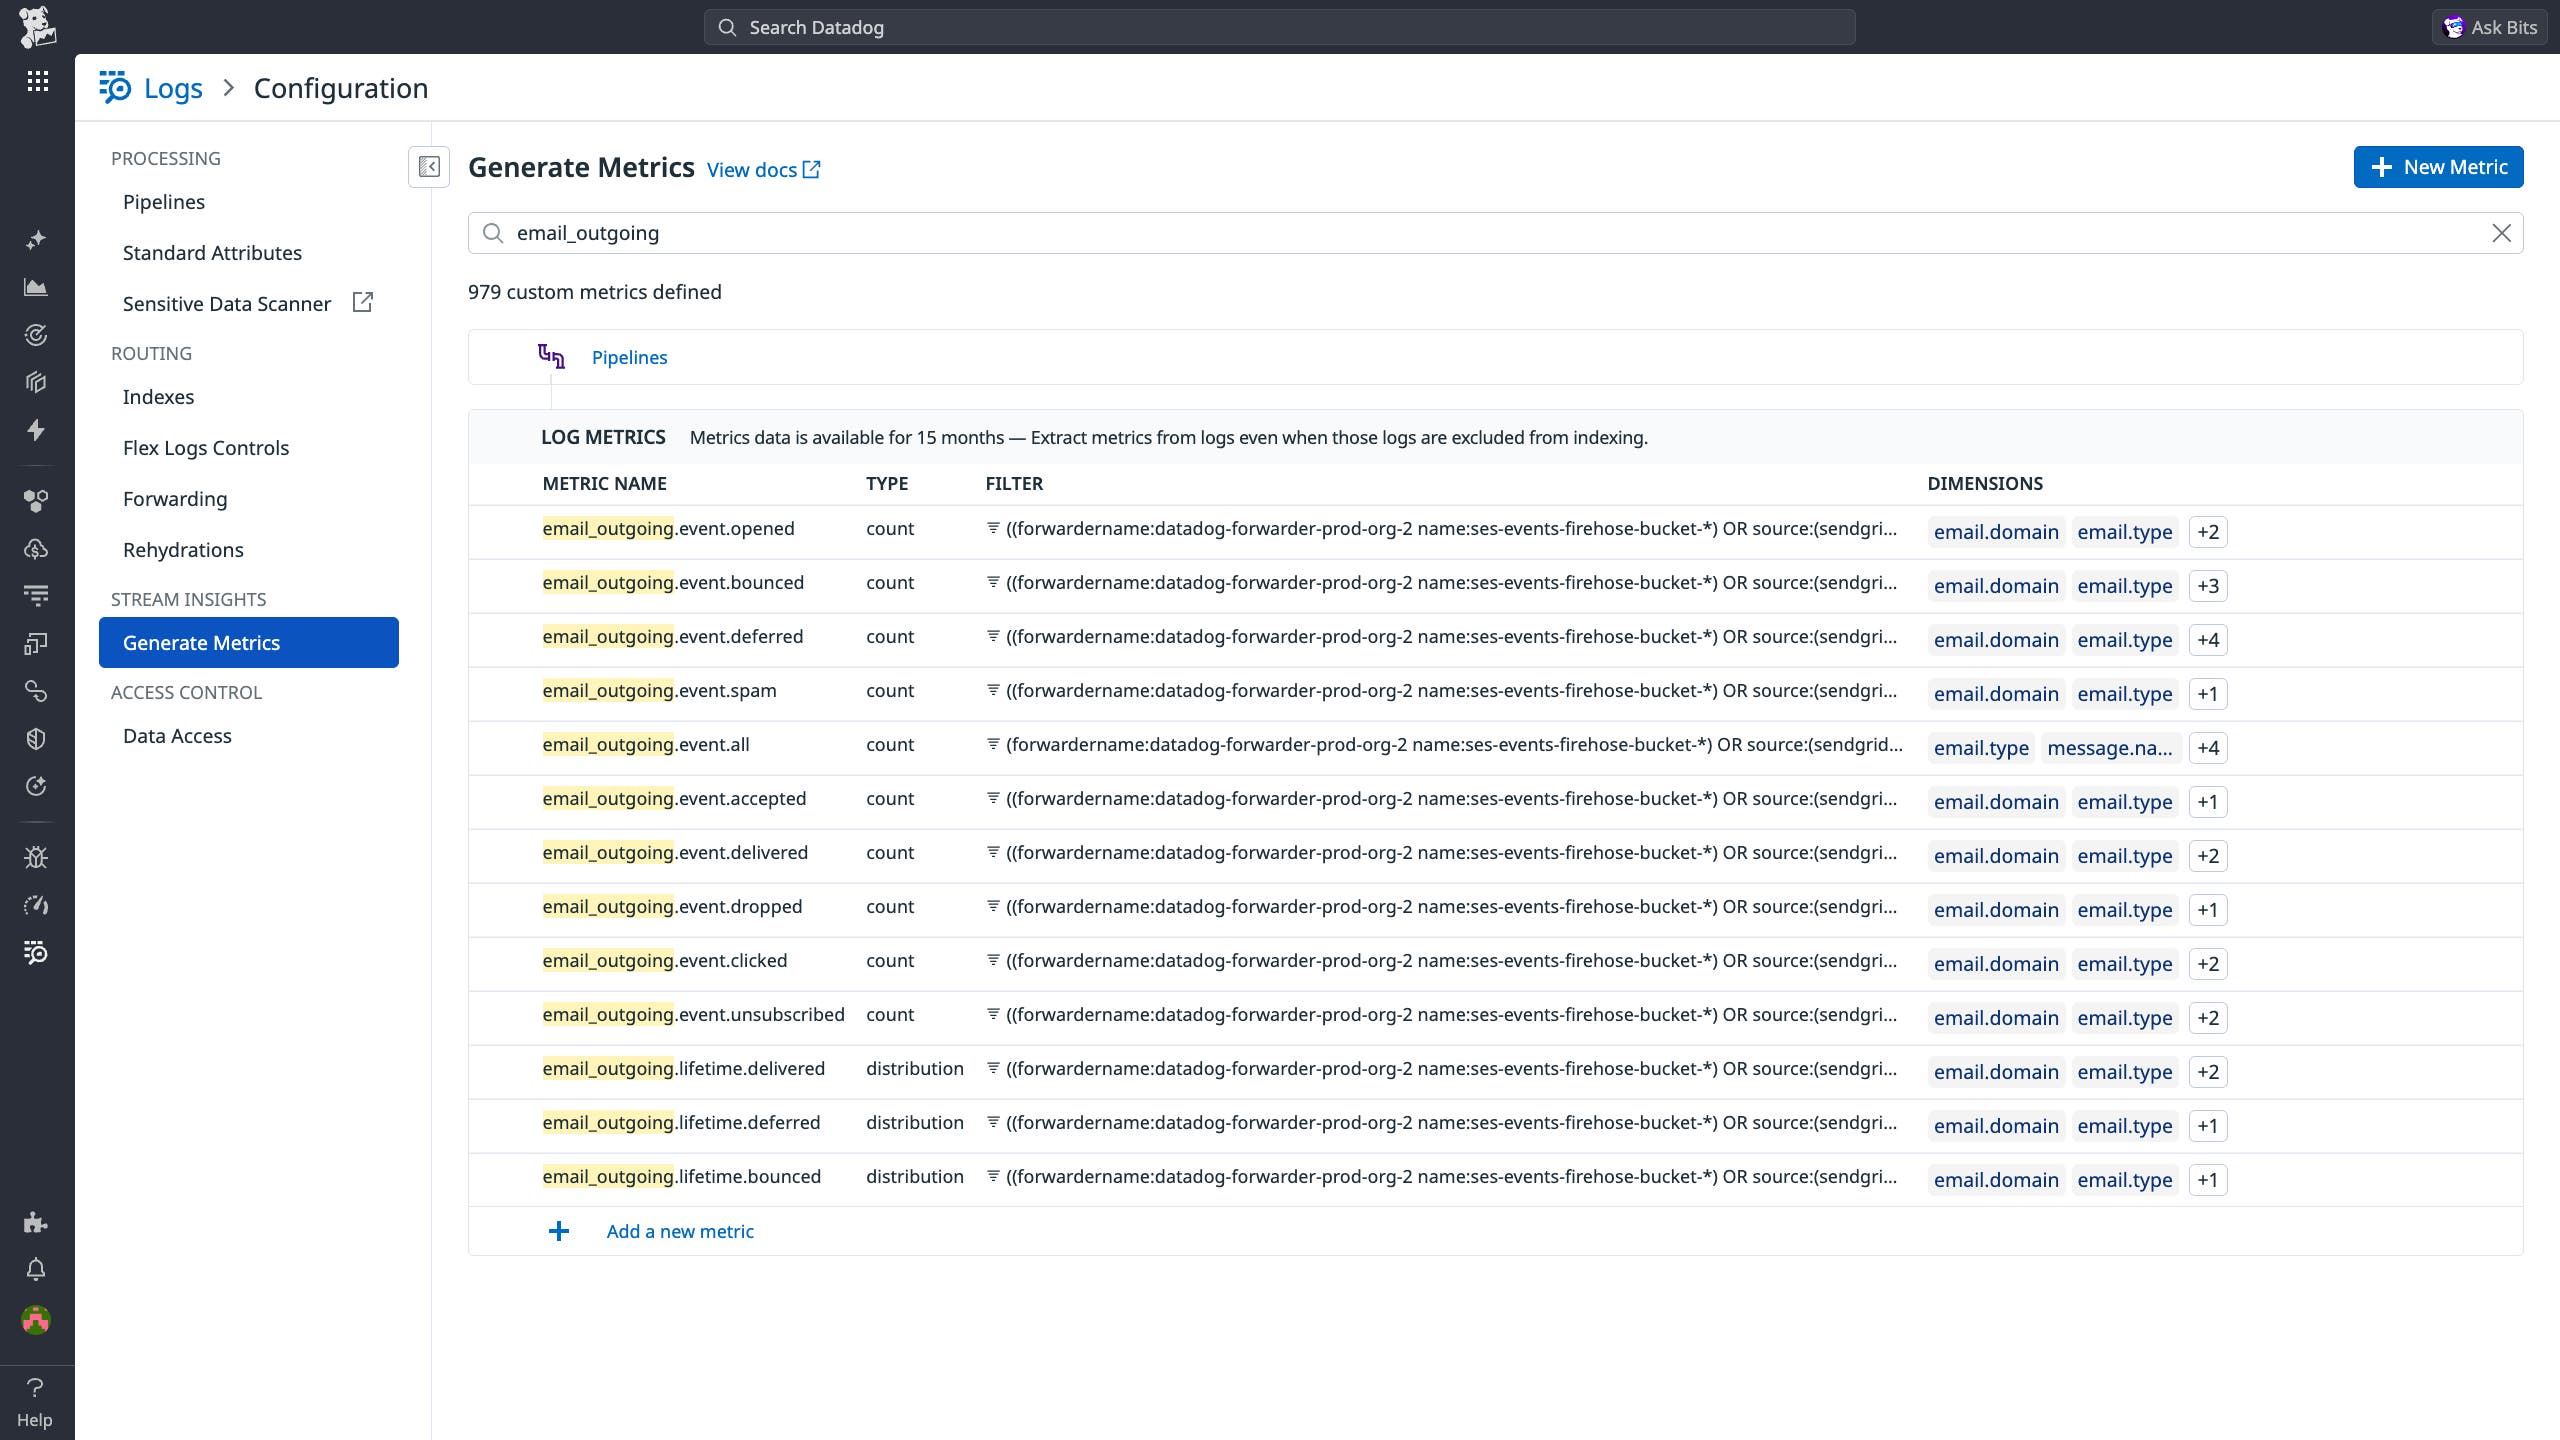
Enforcing consistency in our email transport logs has helped us create a strong foundation for targeted troubleshooting and analysis. It’s also helped us effectively monitor patterns in email delivery with the right level of granularity. Each of our transports generates aggregate metrics that are collected by our integrations, but by using Log Management to generate our own custom metrics that cover the delivery of all emails from our platform, we’ve achieved improved granularity and enriched our cross-transport visibility. We use our standardized transport logs to generate the following metrics:
| Metric Name | Type | Description |
|---|---|---|
| email_outgoing.event.accepted | Count | Email accepted by transport for delivery. |
| email_outgoing.event.all | Count | Total count of all email events. |
| email_outgoing.event.bounced | Count | Email bounced by recipient server. |
| email_outgoing.event.clicked | Count | Link within email clicked. |
| email_outgoing.event.deferred | Count | Email delivery failed, reattempt pending. |
| email_outgoing.event.delivered | Count | Email successfully delivered. |
| email_outgoing.event.dropped | Count | Email dropped based on transport’s built-in suppression list. |
| email_outgoing.event.opened | Count | Email opened by recipient. |
| email_outgoing.lifetime.bounced | Distribution | Length of time between email queuing and bounce. |
| email_outgoing.lifetime.delivered | Distribution | Length of time between email queuing and delivery. |
| email_outgoing.lifetime.deferred | Distribution | Length of time an email has been deferred. |
Here, you can see how these metrics are defined in our UI:
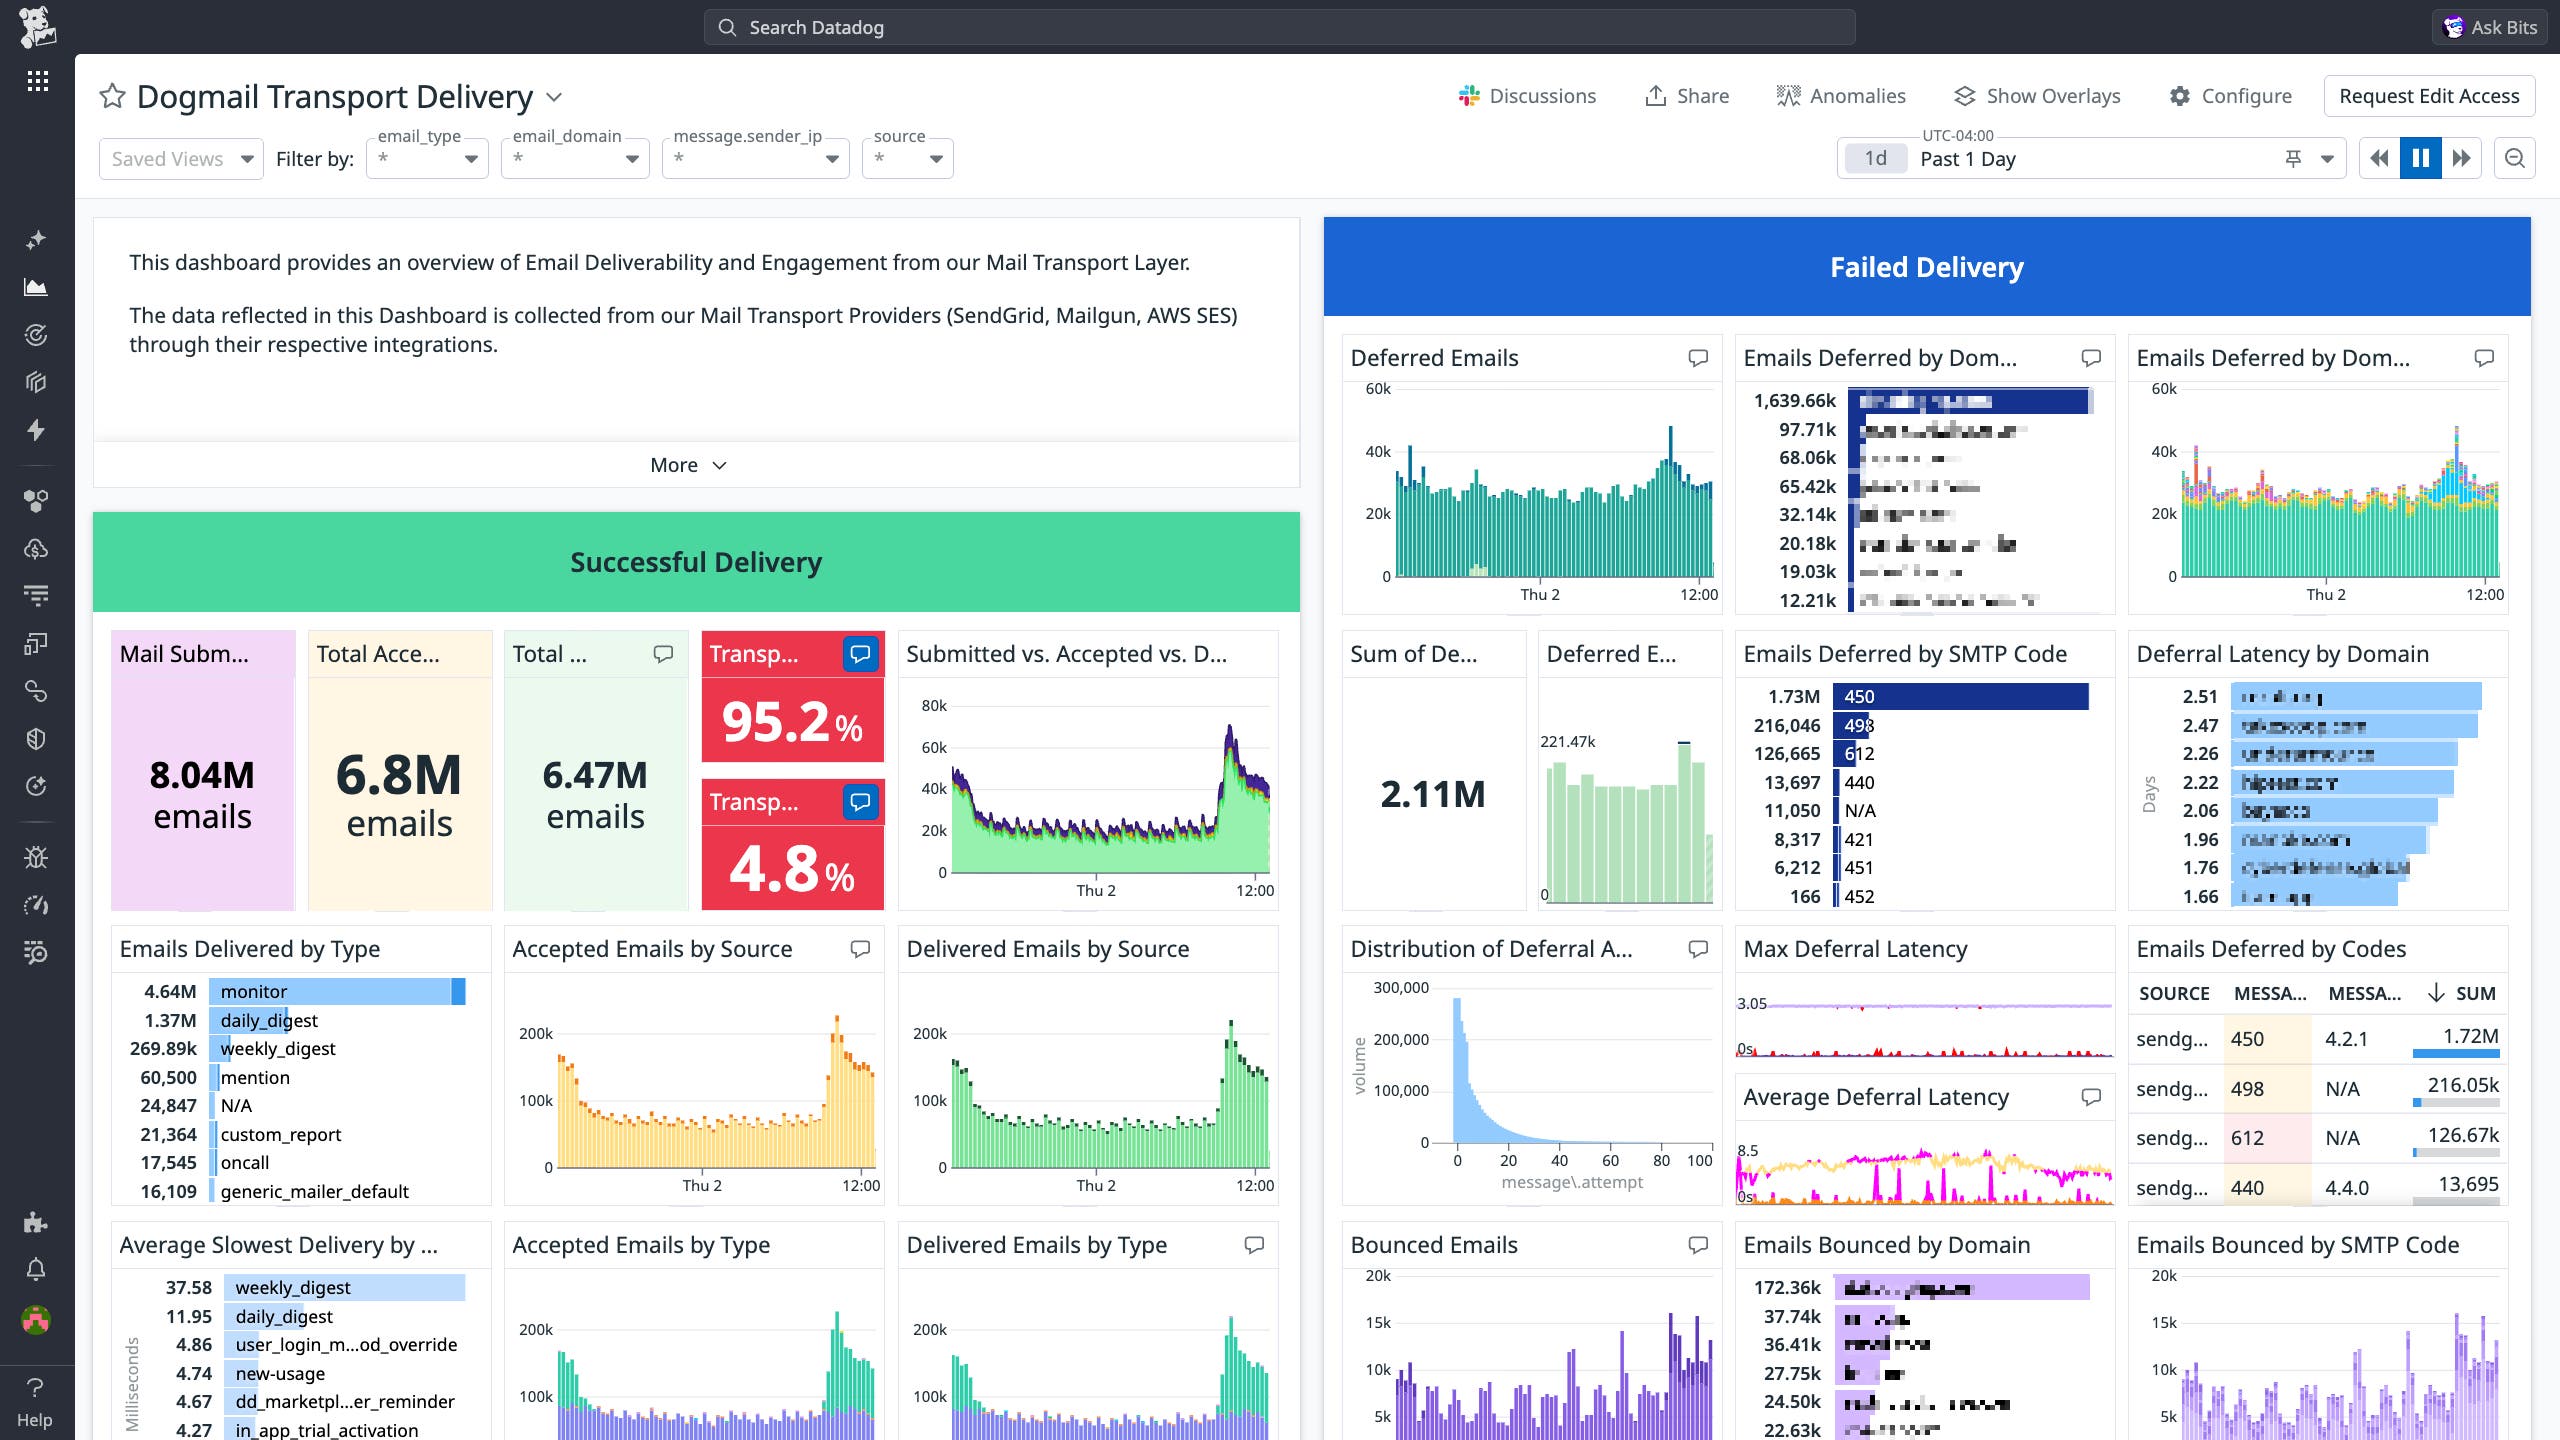
We track these metrics in a centralized dashboard for clear and detailed visibility into delivery patterns, such as our total overall bounce and drop rates, the rates and volumes of emails delivered and dropped by message type (e.g., monitor alerts, daily and weekly digests) and recipient domain, and latencies for deferred messages by message type and recipient domain.
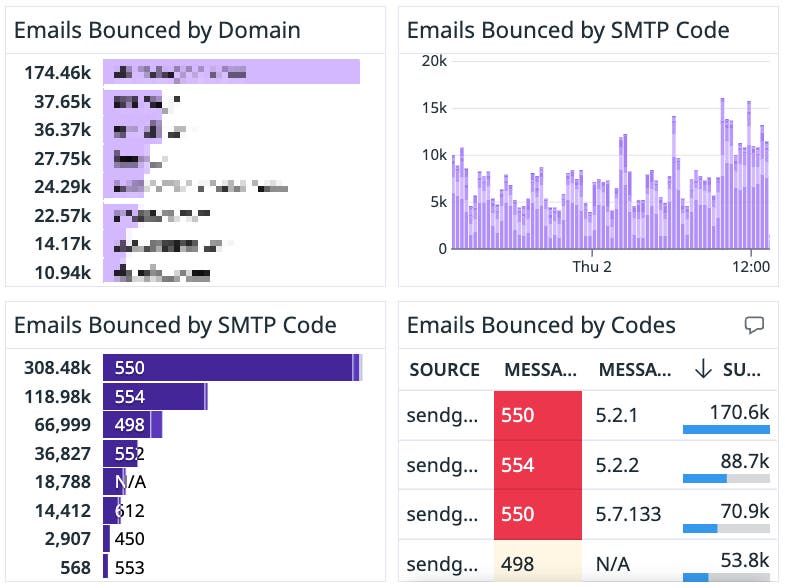
Tracking the number of emails bounced by SMTP code is particularly useful for helping us understand what’s driving issues with delivery.
Ensuring a vital line of communication with our customers
At Datadog, our integrations for Mailgun, SendGrid, and Amazon SES have enabled us to create fine-grained, cross-vendor visibility into one of our platform’s vital lines of communication, helping us ensure the timely delivery of everything from monitor alerts to usage reports. Learn more about our email transport integrations—and, if you’re new to Datadog, consider signing up for a 14-day free trial.

