Shah Ahmed

Addie Beach
When responding to incidents, time is precious. The first few minutes often bring chaos, requiring you to shift between devices, assess impact, and notify stakeholders—all while trying to understand what went wrong. This context switching can slow down response times and increase the risk of miscommunication.
Our new features in Datadog Incident Response help you transition seamlessly between each stage of the incident life cycle, so you can quickly go from receiving a page to evaluating the situation, organizing the response, and communicating with any necessary parties. With our AI voice interface and handoff notifications, you can immediately assess the issue and take action fast. Then, with Datadog Status Pages, you can ensure your users stay abreast of any changes without pivoting away from remediation.
In this post, we’ll explore how Datadog helps you:
- Kick off your response faster with our AI voice interface
- Improve incident handoff with enhanced notifications
- Easily communicate with users via status pages
Kick off your response faster with our AI voice interface
To effectively triage incoming issues, you need immediate, actionable context. Ideally, pages can help you start gathering this information through notifications that identify the type of problem you’re facing, which services and users are impacted, and how you should begin strategizing your response. However, many paging notifications provide limited insights, requiring you to jump over to your troubleshooting tools to understand what’s happening.
By contrast, Datadog On-Call’s AI voice interface delivers real-time summaries of incidents directly to your paging device, helping you start responding before you reach your laptop. As soon as you acknowledge a page, the voice interface begins relaying key incident details: when the issue started, what services are affected, and how users are impacted. You can then ask follow-up questions to start investigating further. For example, you can request that the interface help you prioritize response activities, analyze the scope of the issue, and form hypotheses as to what happened.
Let’s say that, while you’re away from your laptop, you receive an alert that your checkout service is experiencing a sudden spike in latency.
After you’ve accepted the page on your phone, the voice interface starts filling you in on relevant details, such as when the spike in latency started. You ask the interface to provide you with the user impact and learn that the increased latency is causing many users to abandon their carts. Based on this information, you ask the interface to create a high-severity incident for you.
Then, while you open the Datadog web app to start investigating the problem more deeply, you ask the interface to start analyzing potential causes. Within seconds, the interface surfaces a recent deployment that seems to be linked to the increase in latency. You then ask the interface to ping the associated incident Slack channel with these findings.
Improve incident handoff with enhanced notifications
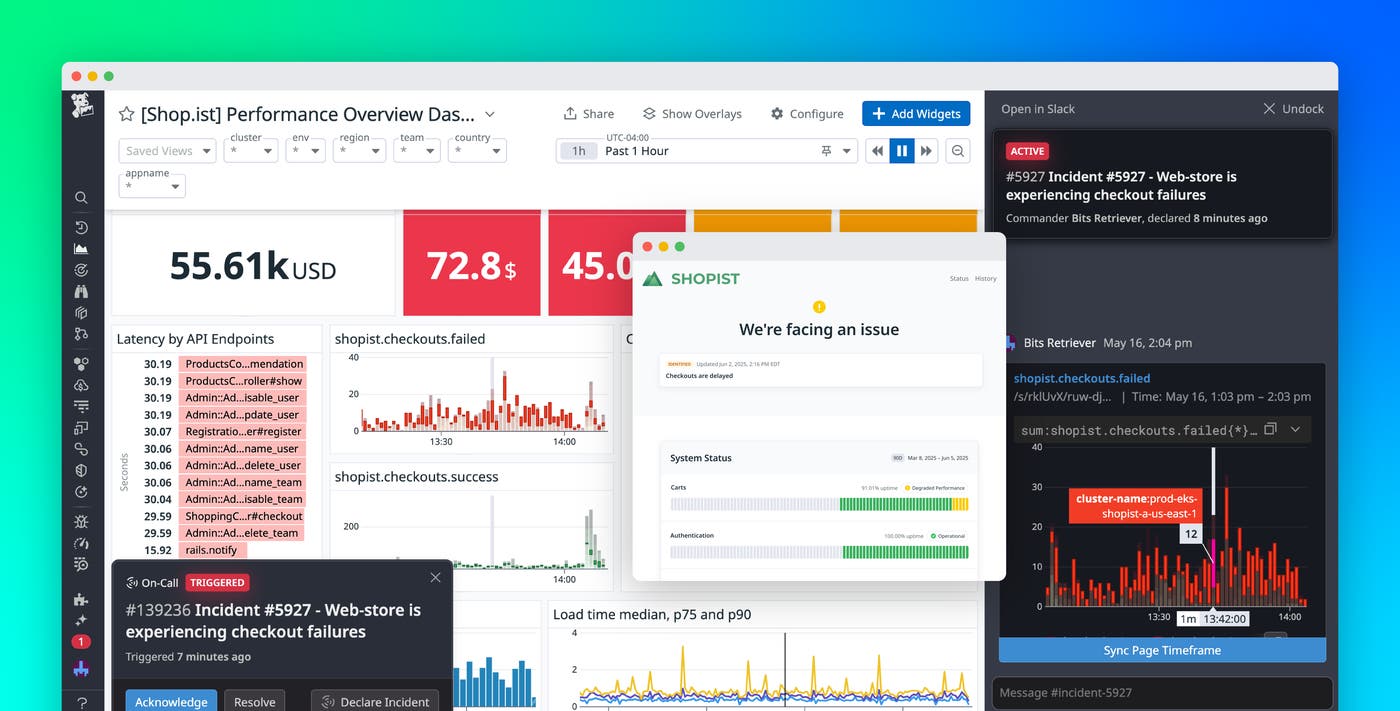
As you transition to troubleshooting within Datadog, you can easily dig into the issue with incident notifications. For any pages that you’re assigned to, you’ll see a popup with key details in the corner of the screen. This notification helps you jump straight into taking action—no searching for the alert within the platform or scrolling through lists of active issues. This especially comes in handy when you’re brought in as a responder for ongoing incidents and need to quickly come up to speed.
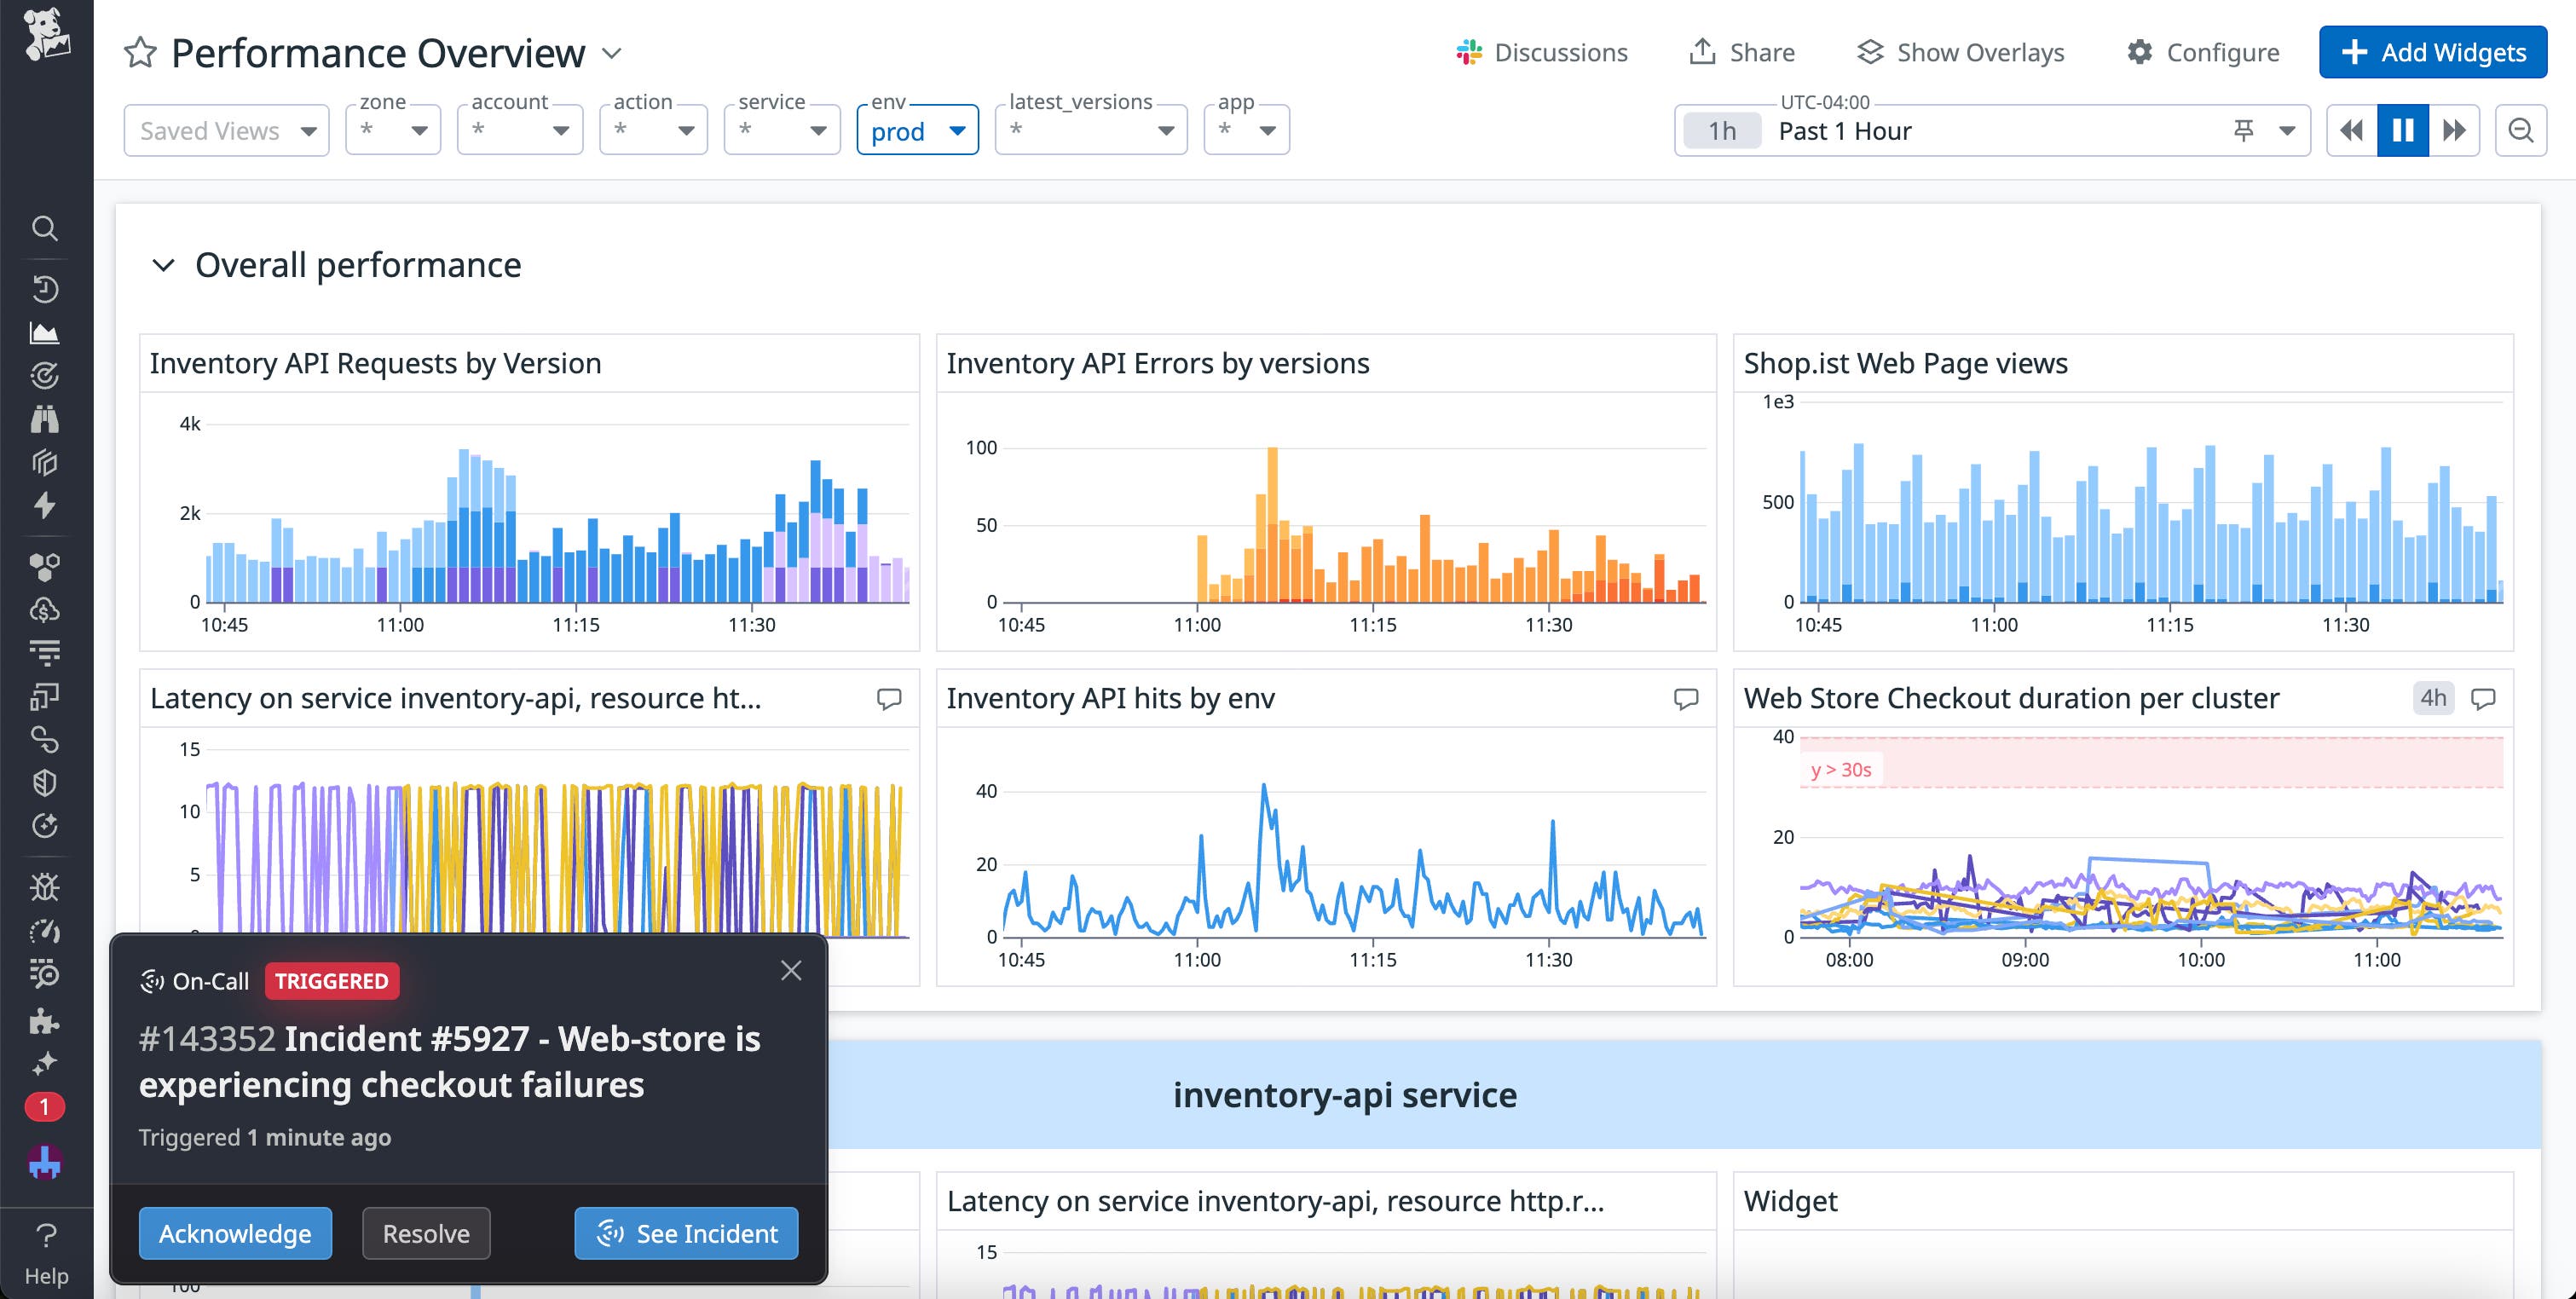
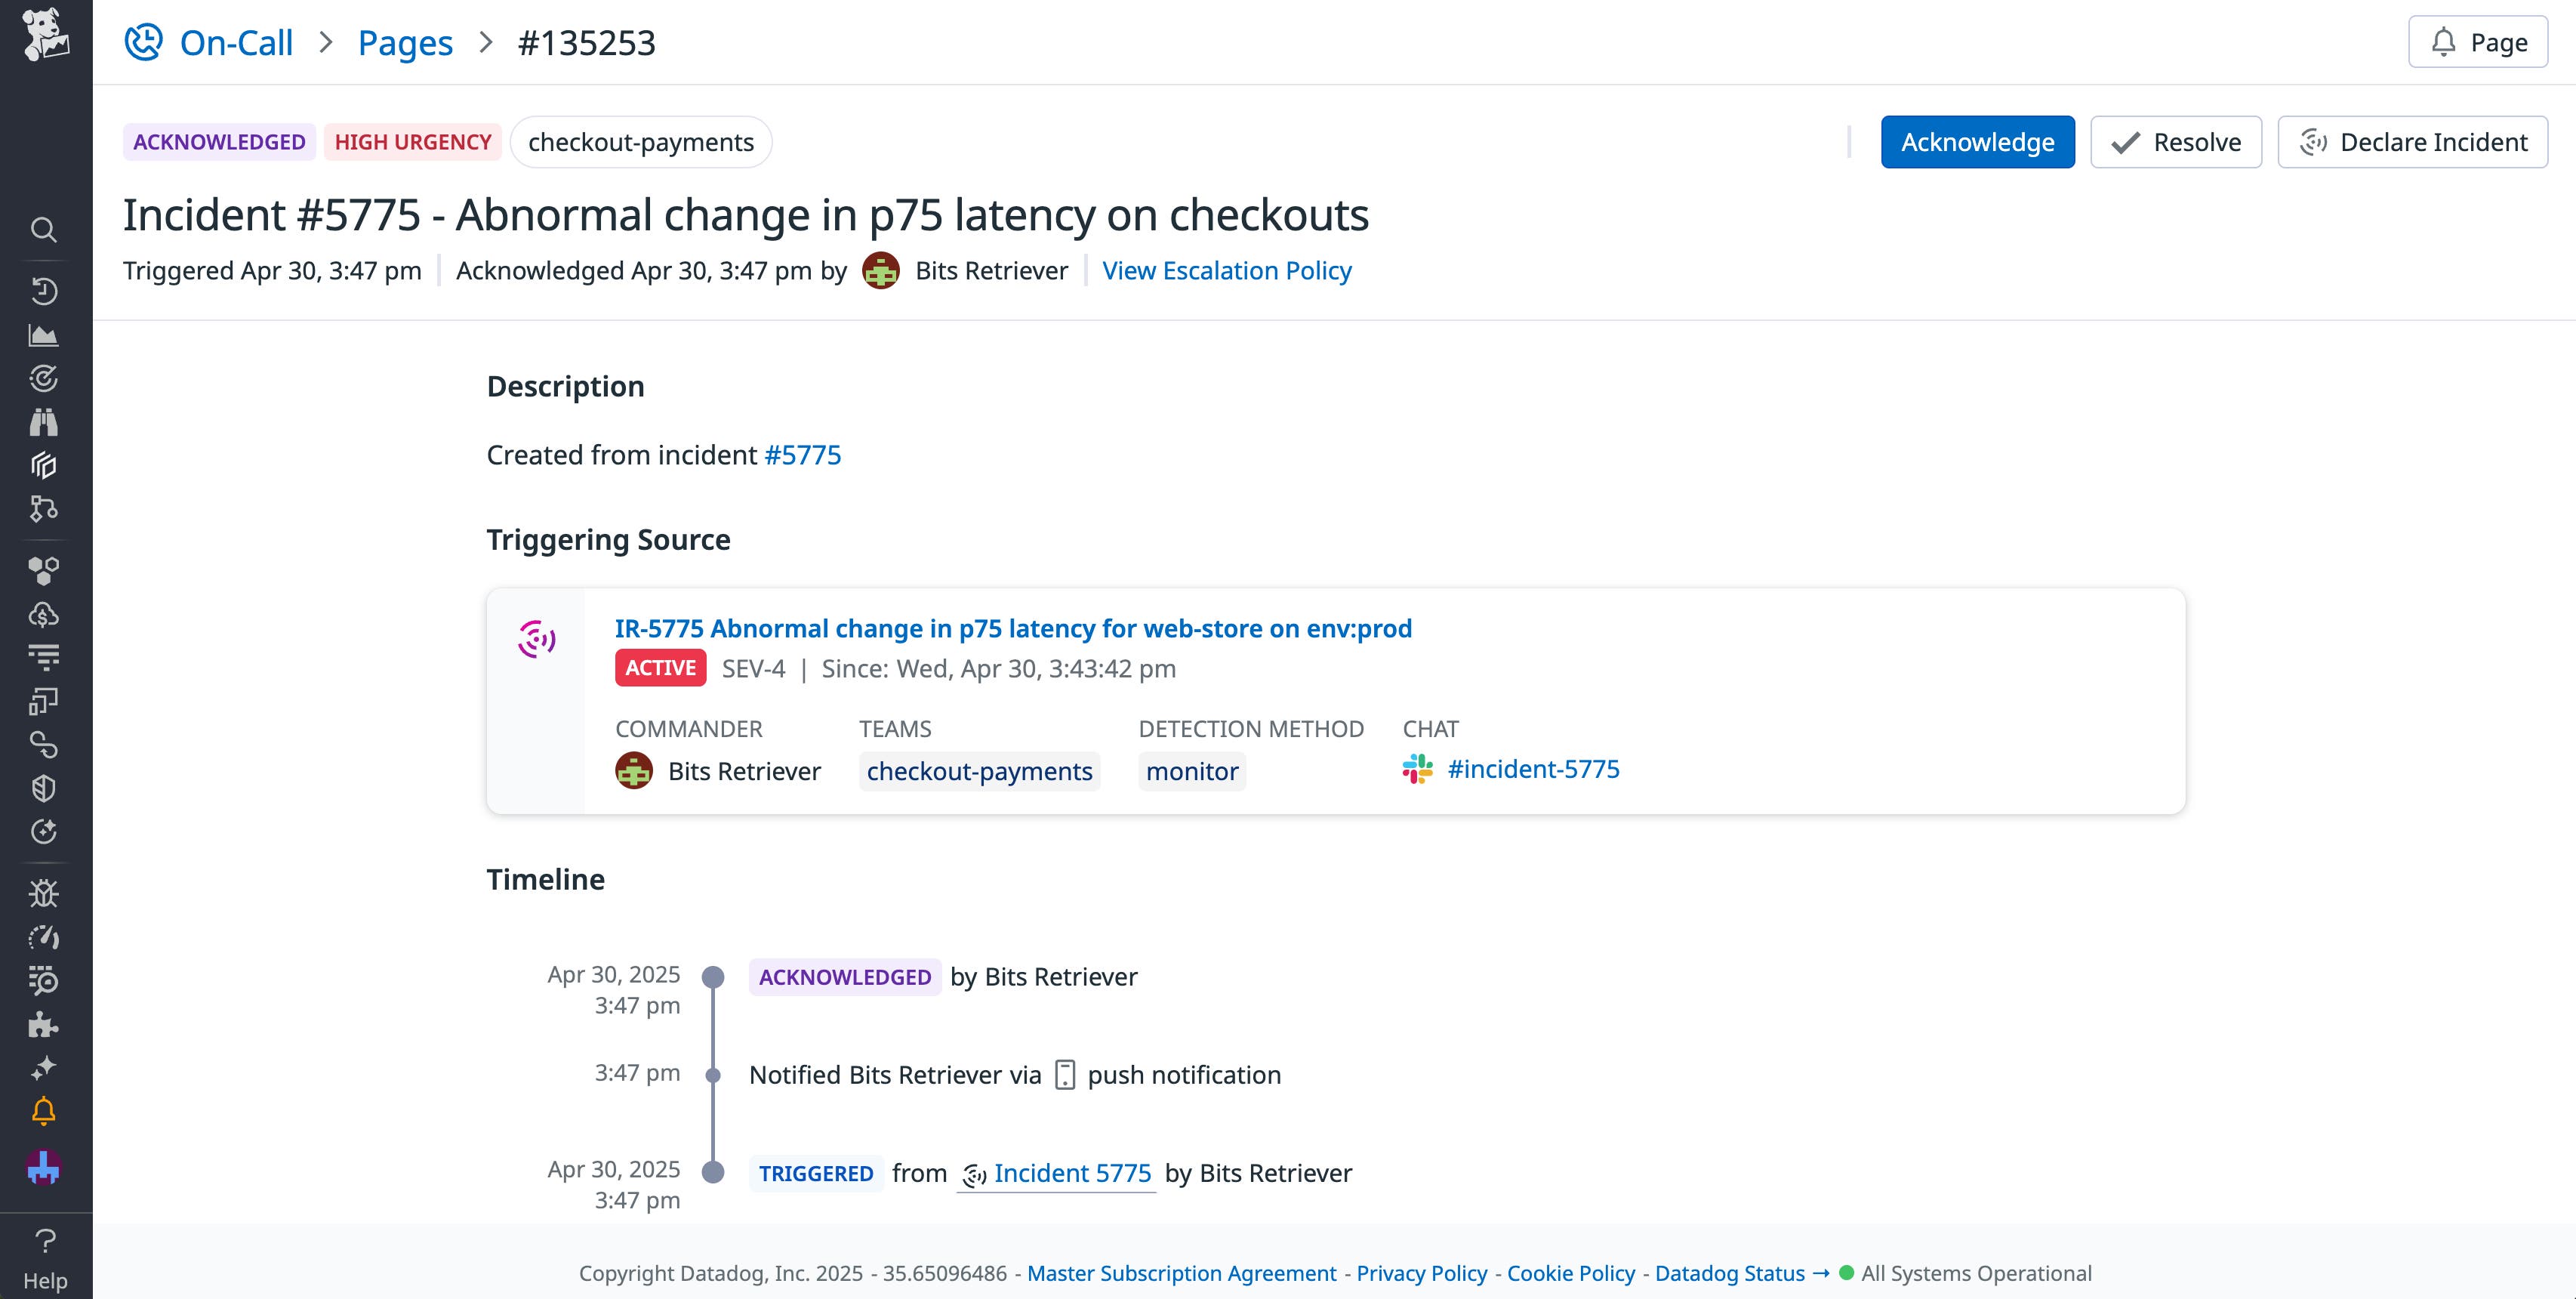
From this notification, you can acknowledge the page, declare an incident, or resolve the issue. If an incident already exists, you can easily view additional details about it and then dock it to the side of your screen to access a live workbench as you troubleshoot. This workbench enables you to Slack your team as the incident progresses. You can enrich these conversations with real-time graphs that dynamically update as you modify the associated dashboard’s scope, time frame, and variables.
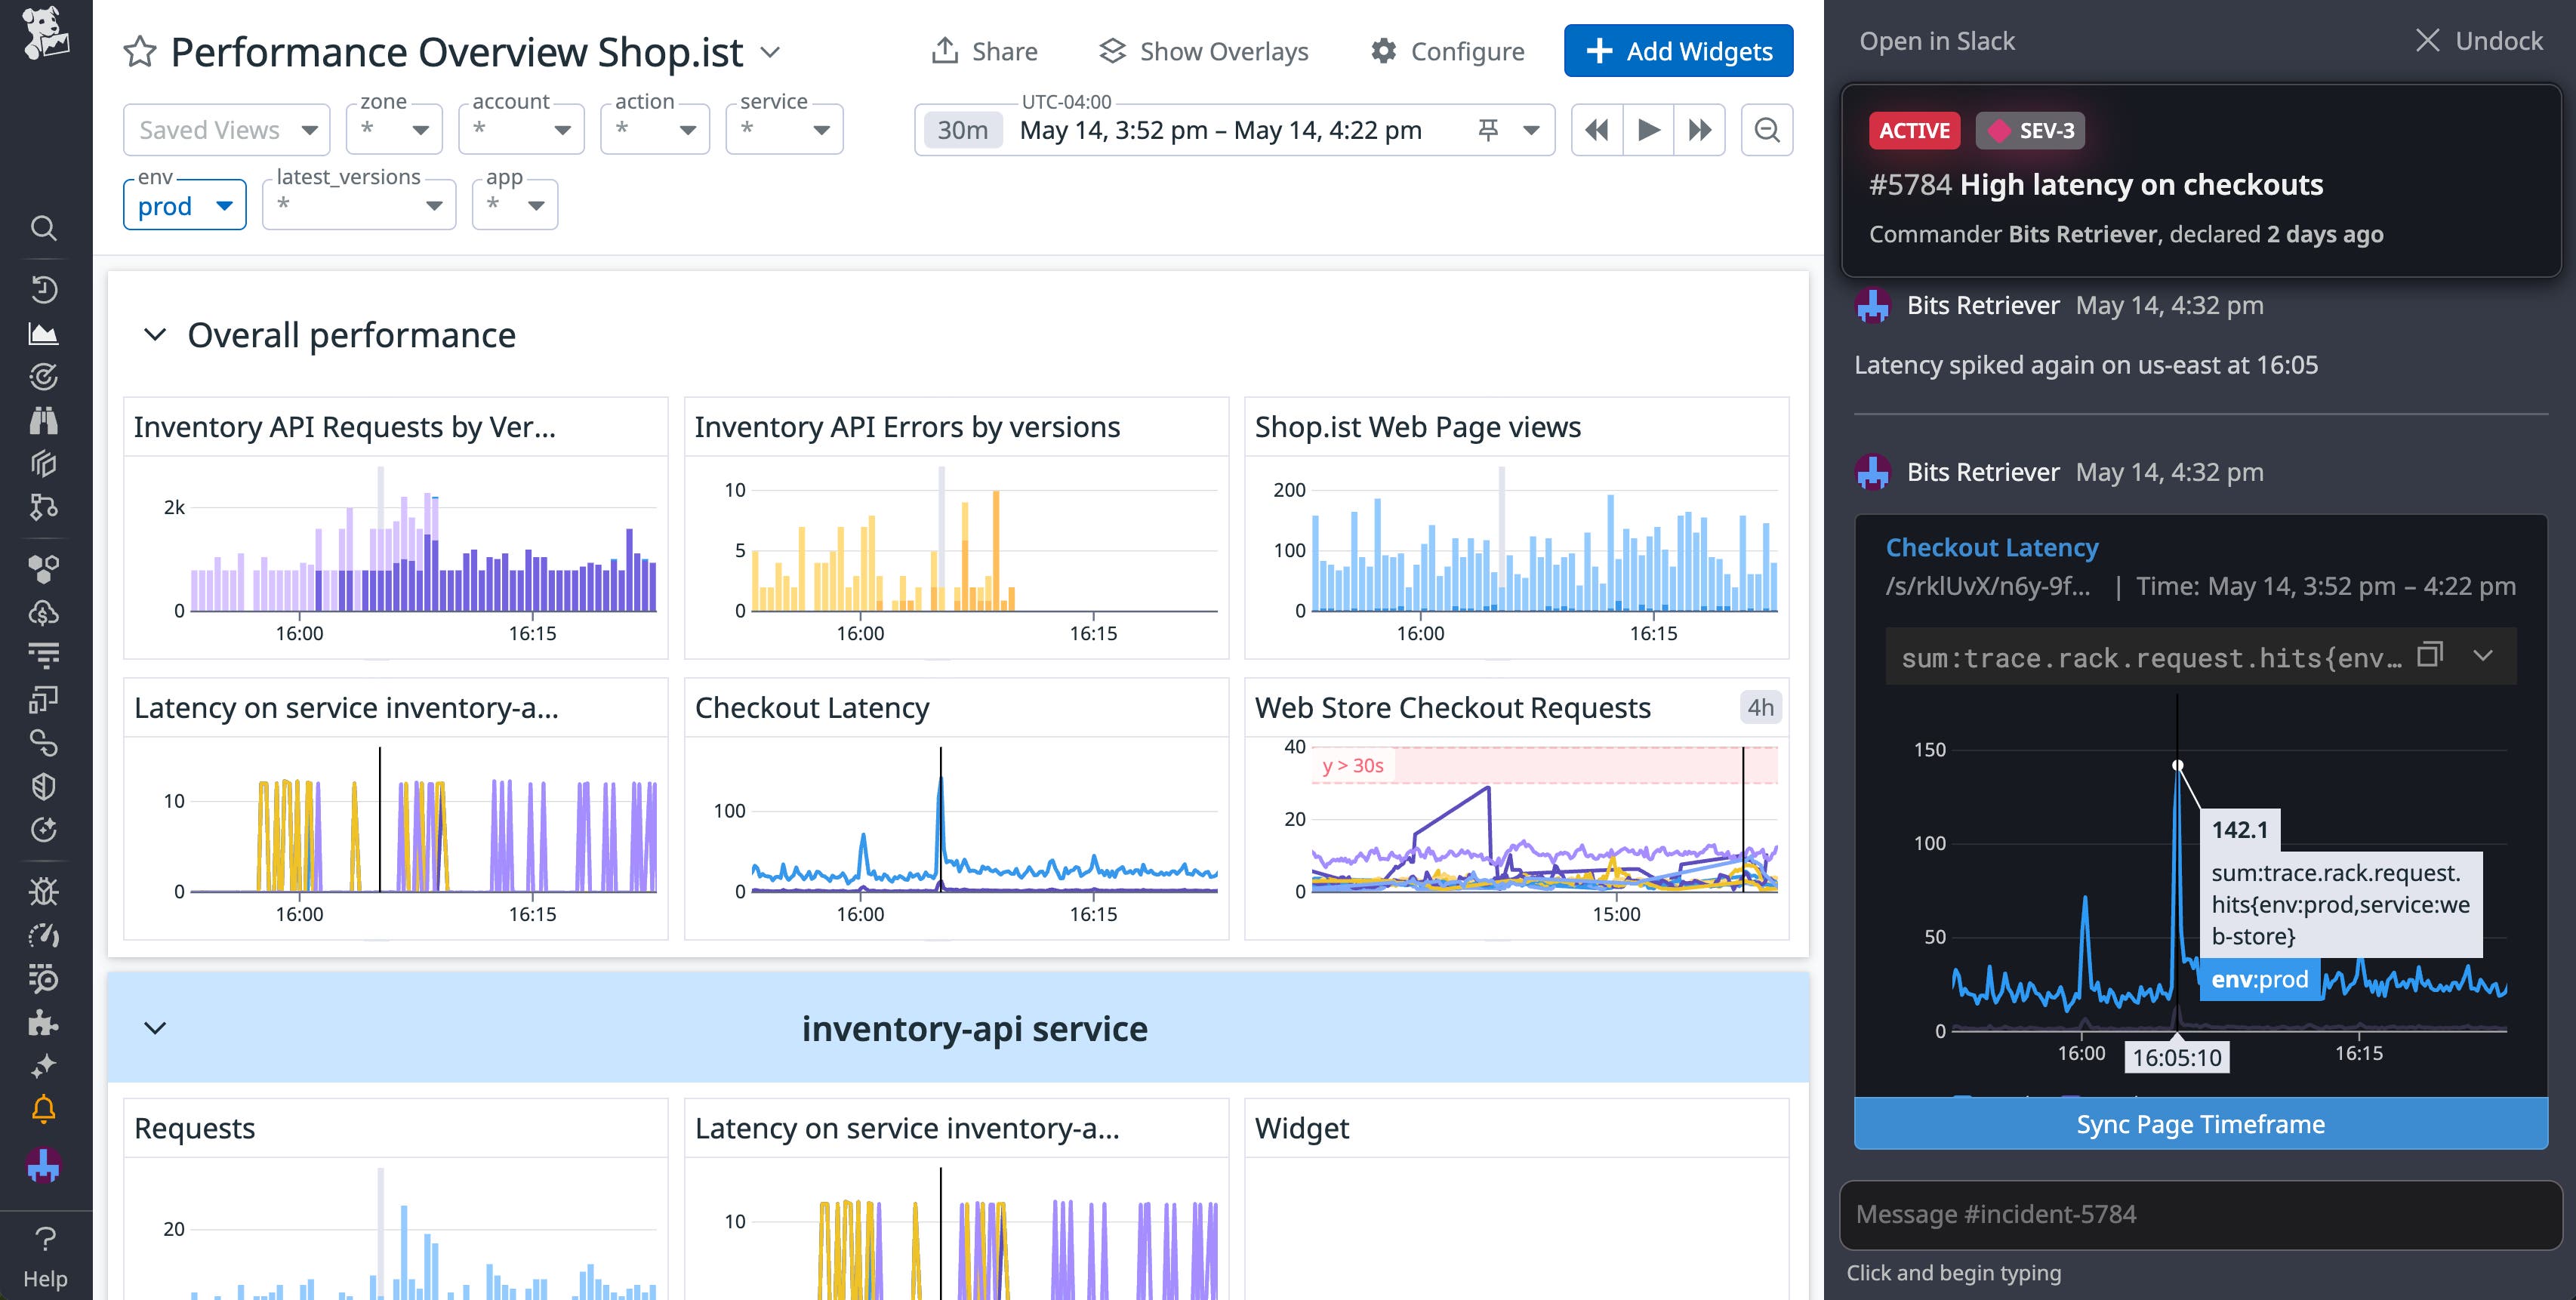
Continuing the example from above, let’s say you confirm that the voice interface was correct—the spike in latency seems to be caused by a recent version deployment. Using the incident workbench, you can send a graph to the other responders that shows latency activity for the last few system versions. You’ve scoped this graph to just before the incident began using the dashboard’s time frame. With this information, your teams are able to quickly understand the situation and help you decide on the next steps to take.
Easily communicate with users via status pages
In addition to keeping team members up-to-date as your incident progresses, you’ll want to make sure that your users are kept in the loop as well. However, creating and updating status pages can be tedious work that takes time away from remediation efforts.
Datadog Status Pages help you create custom status pages that stay in sync with your incident response. On these pages, your users can view the status of each service component—degraded or operational—and a full timeline of incident management activities. You can easily customize your status page, with options for adding company logos, setting the page visibility, and tailoring the visualizations displayed on your page. As the incident progresses, you can then update these pages in the same place that you conduct incident management, minimizing context switching.
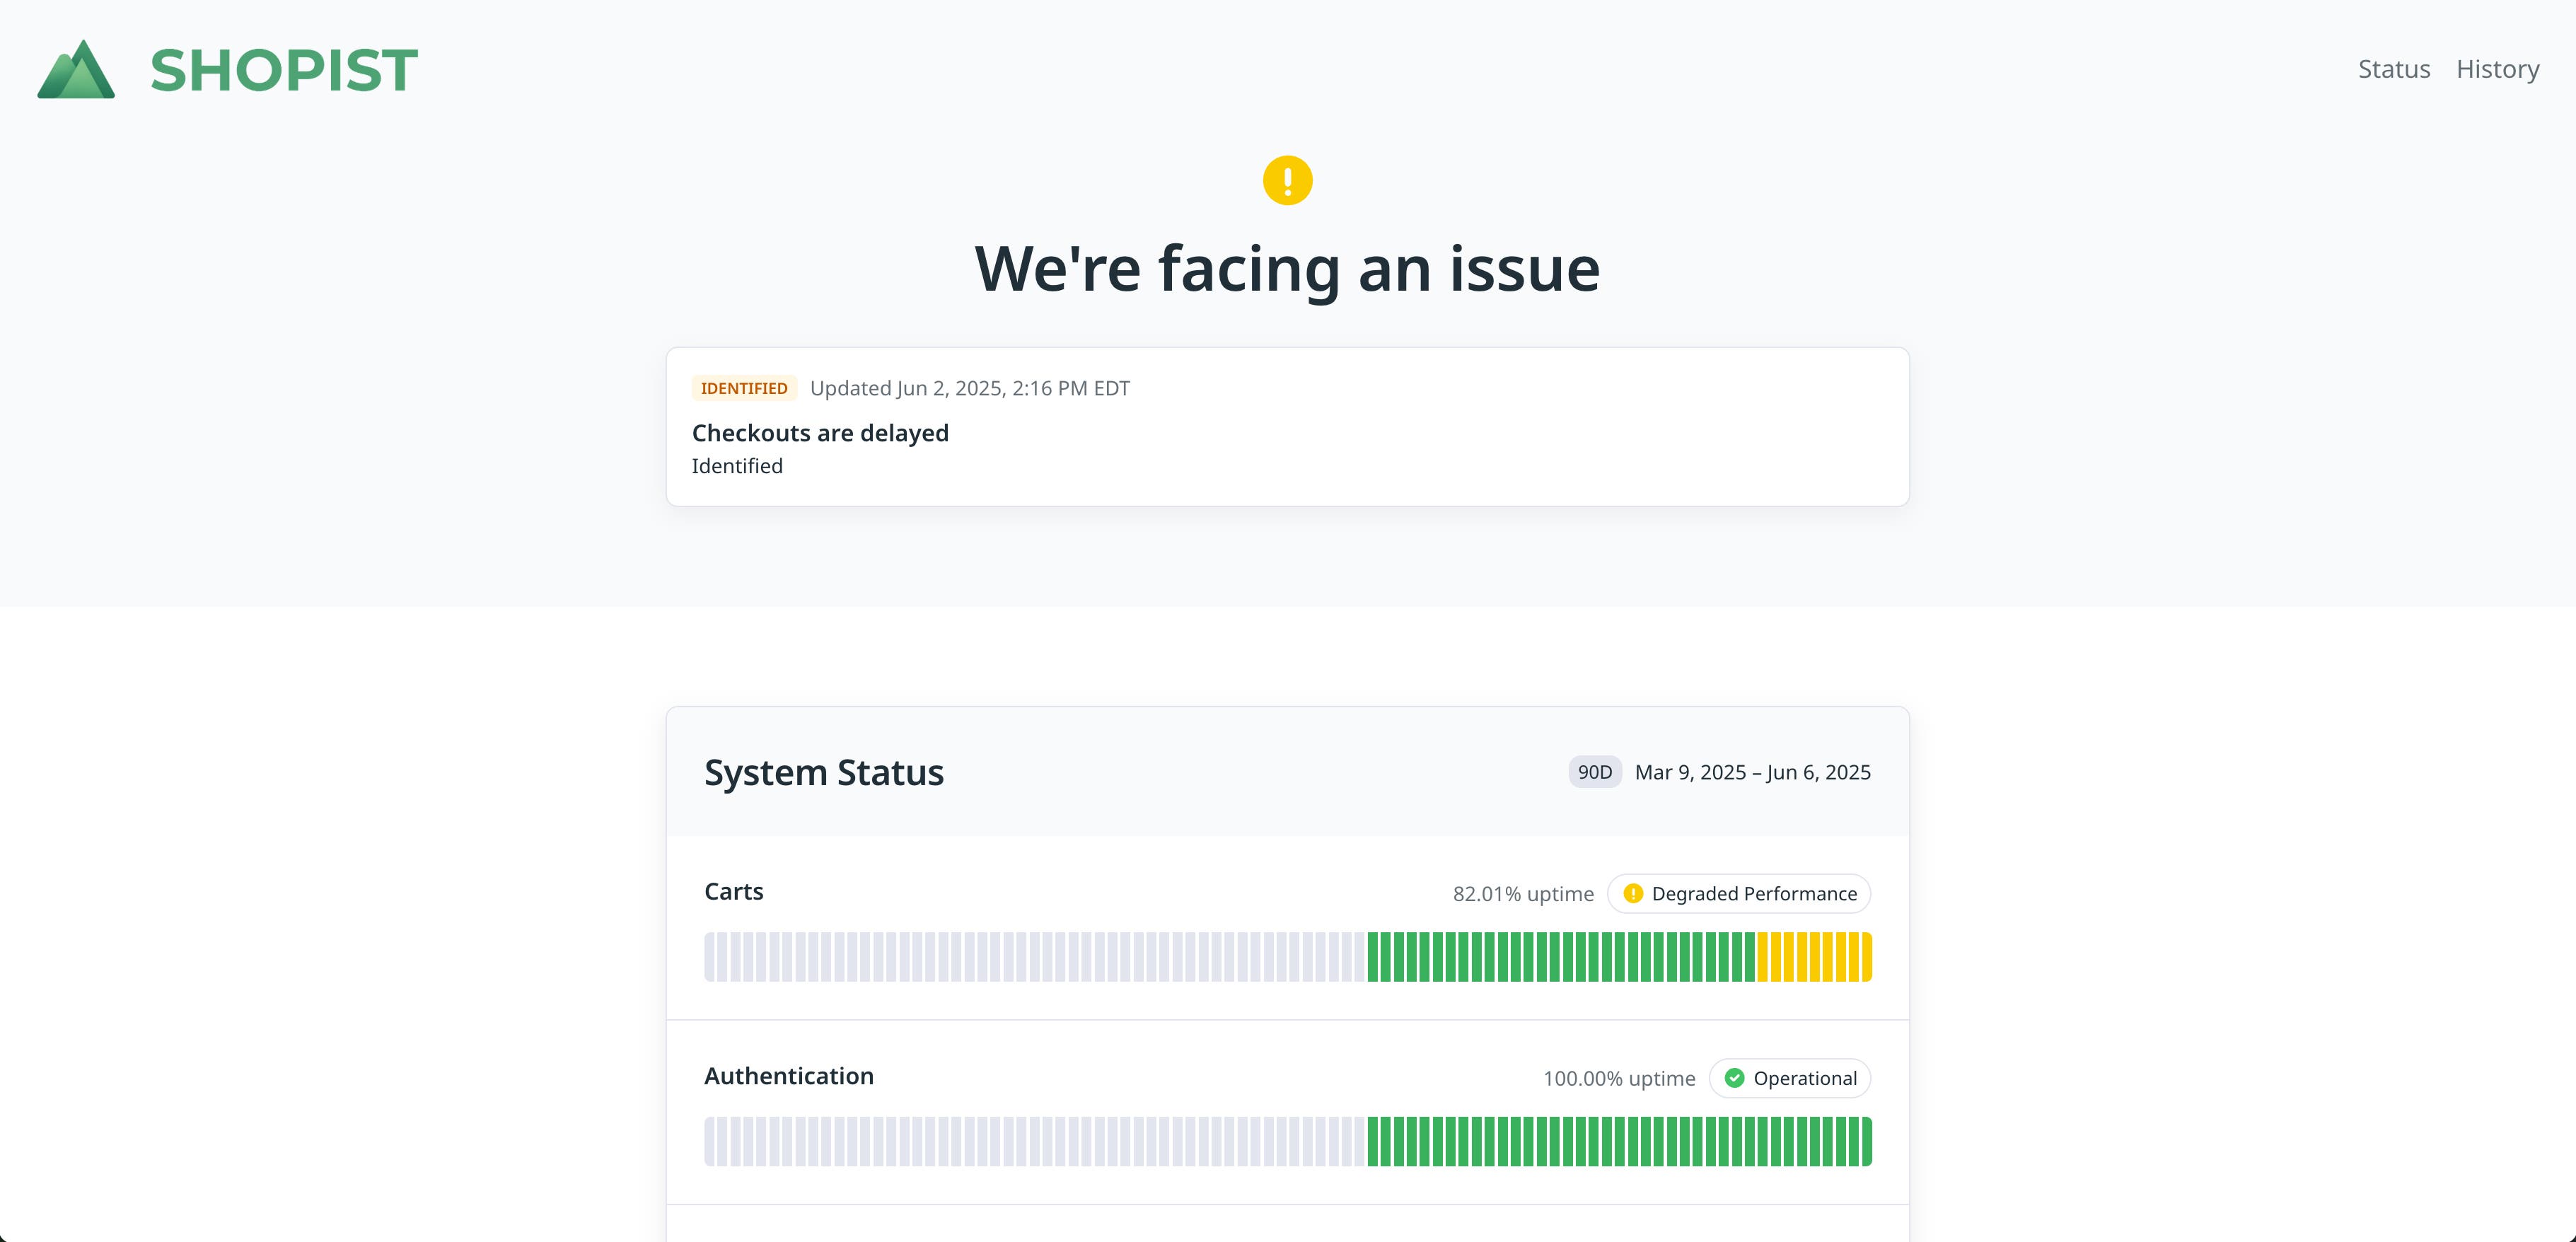
Let’s say that you have a status page for your checkout service. Users can see which functionality has been impacted and that you’re actively investigating the problem. This helps them understand the cause of the delays and sets the expectation that the checkout process will temporarily take longer than usual. Once you’ve rolled back the problematic deployment and resolved the issue, you can update the status page to reflect that your app is fully functional again.
Focus on troubleshooting with Datadog Incident Response
Datadog Incident Response already helps you triage, analyze, and remediate issues within a single platform. With our new features, you can easily move between each stage of the incident response process, communicating effectively with users and team members every step of the way. This enables you to dedicate more time and energy to troubleshooting, leading to faster remediation.
You can use our documentation to get started with Datadog Incident Management and On-Call. Or, if you’re new to Datadog, you can get started with a 14-day free trial.
