

Paul Gottschling
Datadog Technical Content Writer

Bruce Wang
Microsoft’s Internet Information Services (IIS) is a web server that has traditionally come bundled with Windows (e.g., versions 5.0, 6.0, and beyond). IIS has numerous extensibility features. Swappable interfaces like ISAPI and FastCGI make it possible to use IIS with a variety of backend technologies, from micro-frameworks like Flask to runtimes like Node.js, along with technologies you’d expect to find within a Windows-based production environment (e.g., ASP.NET). And through an ecosystem of IIS extensions, called modules, you can equip your server to perform tasks like rewriting URLs and programmatically load balancing requests. IIS lets you optimize performance with built-in content caching and compression features, and improve the reliability of your applications by isolating them in separate application pools.
In this post, we’ll survey IIS metrics that can help you ensure the availability and performance of your web server. While we’re focusing on IIS 10, which is bundled with Windows Server 2016 and Windows 10, you can consult the documentation if you’re using an earlier version and want to see if something we discuss is available to you. And while IIS can implement a number of TCP-based protocols, including FTP, we’ll be concentrating on IIS’s default configuration as a server for HTTP or HTTPS.
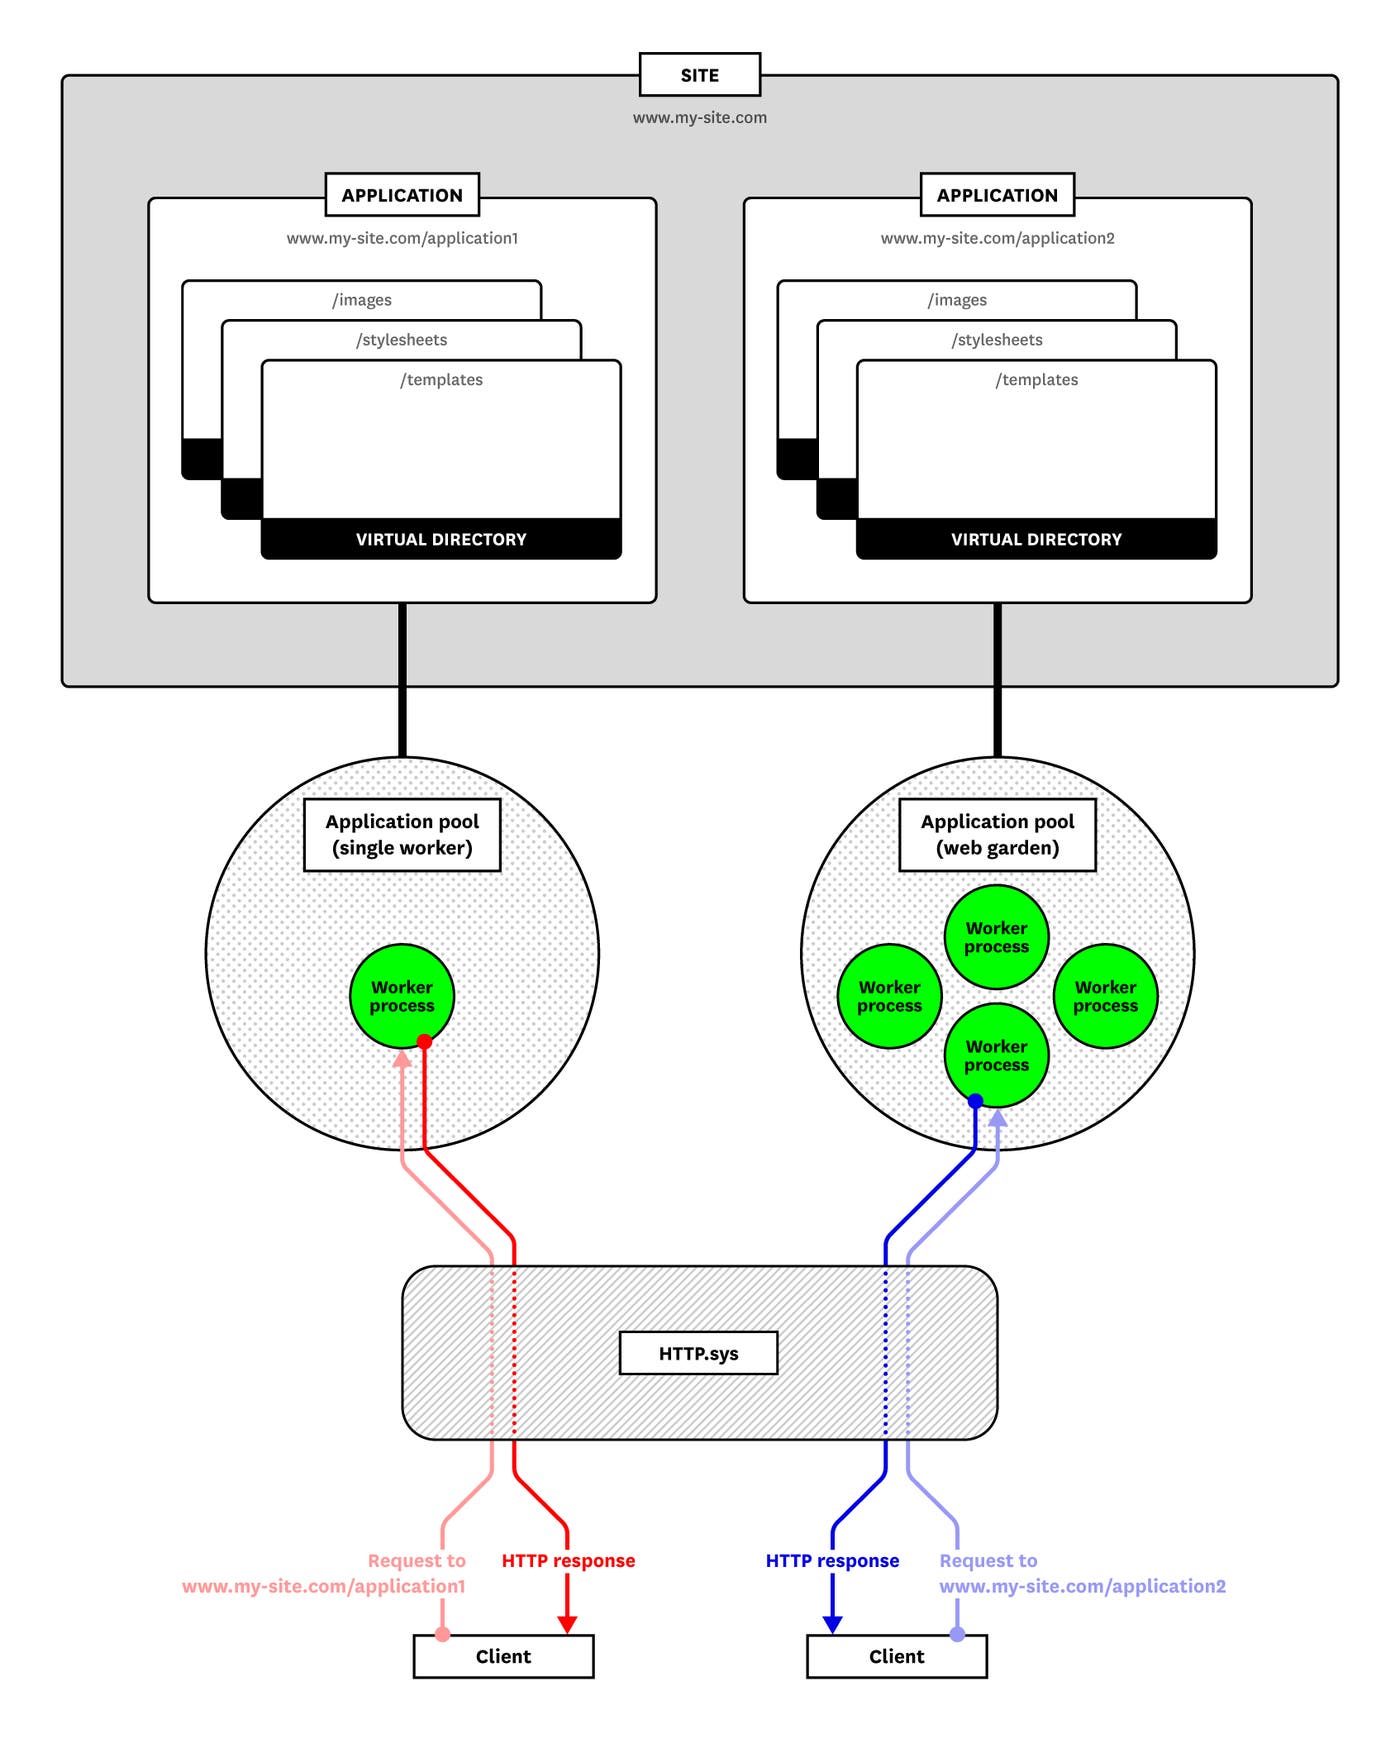
The structure of an IIS server
You’ll want to organize your monitoring strategy around the fact that IIS’s components are spread out across a number of Windows processes and drivers. We’ll take a look at these components, then introduce the IIS metrics you’ll want to use to monitor them.
HTTP.sys and worker processes
The worker process conducts the main work of a web server: handling client requests and serving responses. IIS can handle requests with multiple worker processes at a time (depending on your configuration), each of which runs as the executable w3wp.exe.
When a request reaches your Windows server, it passes through HTTP.sys, a kernel-mode device driver. HTTP.sys listens for HTTP and HTTPS requests, and validates each one before passing it to a worker process. If no worker process is available to handle a request, HTTP.sys places the request in a kernel-mode queue.
When monitoring traffic to HTTP.sys, you will likely be using performance counters collected by the World Wide Web Publishing Service (WWW Service), which runs as part of an instance of the process, svchost.exe. The WWW Service passes stored IIS configuration settings to HTTP.sys, and collects performance counters for each IIS site.
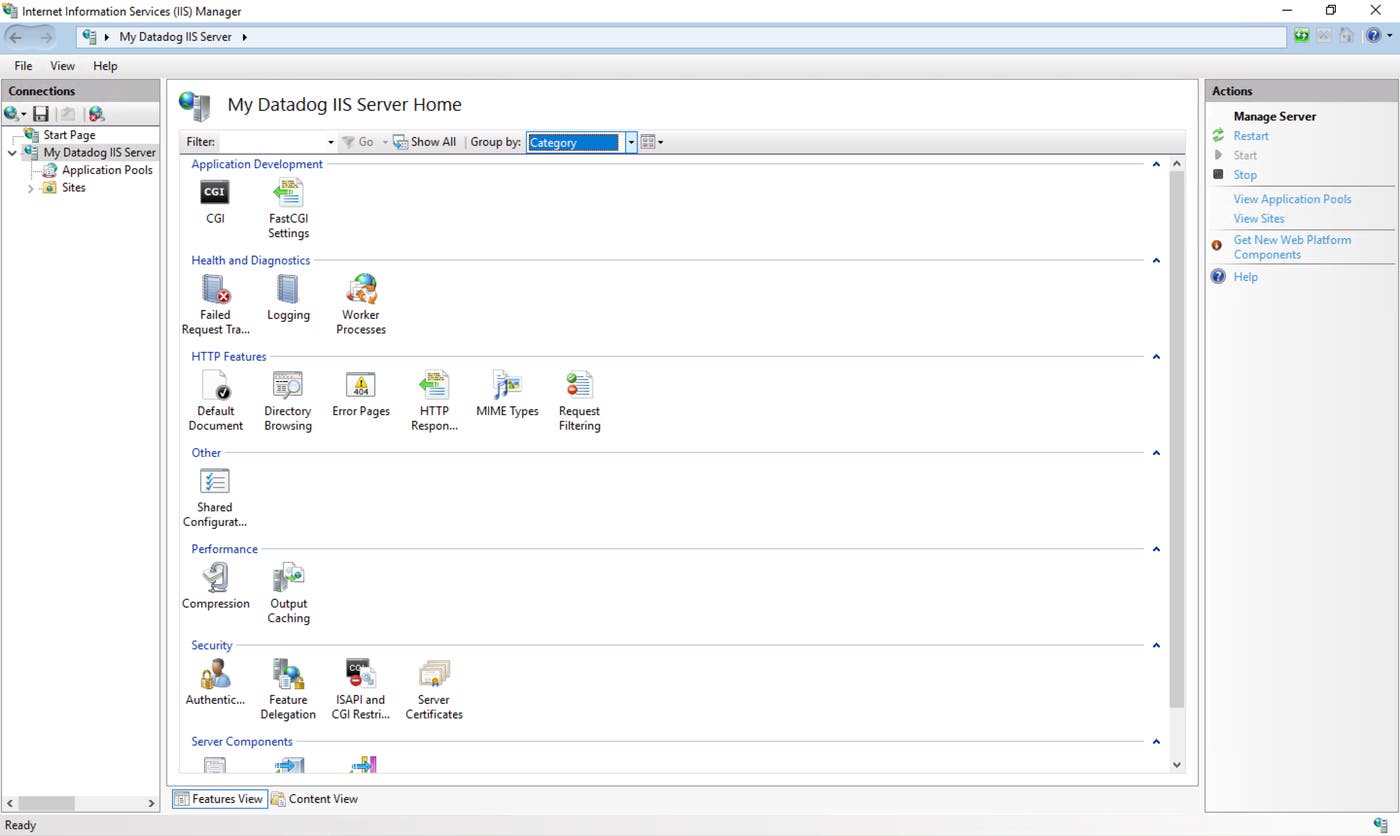
Every worker process belongs to an application pool, which keeps applications mutually isolated to improve their availability—if an application crashes, it won’t affect other application pools. Worker processes in one pool do not share resources with other pools. You can pass configuration settings to a single pool to, for instance, throttle the CPU utilization of its workers. Each application pool defaults to a single worker process, and you can configure your pools to include more.
URIs and resources
HTTP.sys routes a request to the correct worker process by using the request’s URI. You can match URIs with application pools and files by configuring sites, applications, and virtual directories. Each of these specifies part of a URI. Virtual directories are nested within applications, which are nested within sites, making it possible to define a resource with the URI, <site>/<application>/<virtual directory>.
In IIS, the domain name of a URI belongs to a site. A site specifies certain top-level configuration details, such as the protocol (HTTP and HTTPS for IIS versions 6 and earlier, and extensible to accommodate any protocol in IIS 7 and above), or the site’s IP address, port, and host header. Other settings determine how a site should process or route requests. You can apply configuration settings for how long IIS should keep an inactive connection alive and how many concurrent connections a site can accept.
An application associates a URI path with an application pool and a physical directory within the host. Every site has at least one default application, which binds to the root URI. When you create an application, you point it to an application pool (which multiple applications can share). Applications and sites can each point to a different application pool—IIS will route a request to the application pool for either the site or the application, based on the URI. An application’s physical directory can contain subdirectories that map to additional URIs, known as virtual directories. When you assign an application to a physical directory, IIS will designate each of the subdirectories as a virtual directory and give it a URI.
A single application can point to multiple virtual directories, letting you assign one subdirectory to images and another to stylesheets, or otherwise organize assets within your applications. A virtual directory can also have a different name than its corresponding file path.
Key IIS metrics
When monitoring IIS, you’ll want to focus on at least four categories of metrics:
The “Availability” column of each table indicates where you can access each metric. In Part 2, we’ll show you how to access these metrics from these sources: performance counters (objects that calculate metrics internally throughout the Windows operating system) and IIS logs.
This article refers to metric terminology from our Monitoring 101 series, which provides a framework for metric collection and alerting.
HTTP request metrics
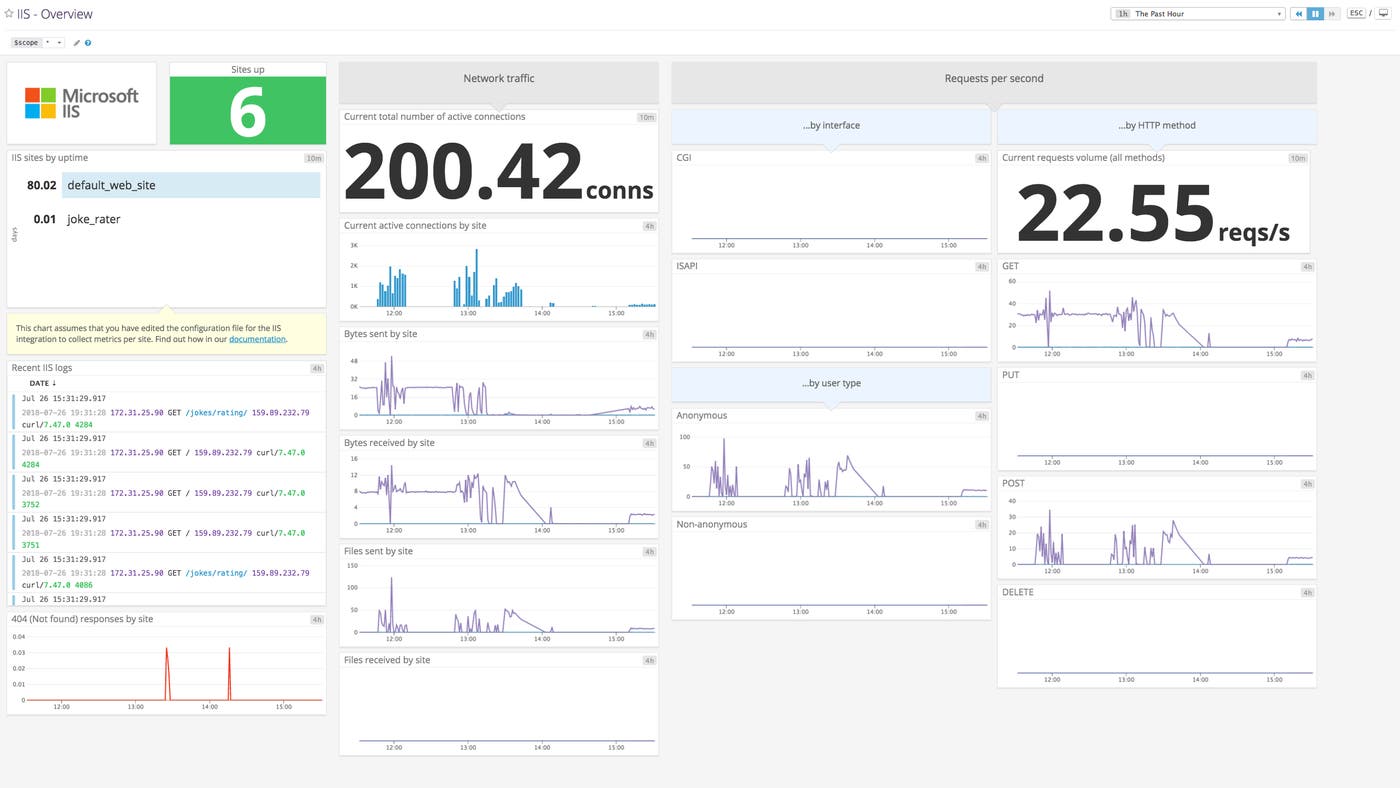
Tracking the volume of requests gives you an idea of how busy your server is, and serves as a starting point for understanding how well your IIS configuration is working. HTTP request metrics can also help you identify bottlenecks, see which URI paths receive the most traffic, and determine what sort of demands your application code places on your system resources.
| Name | Description | Metric Type | Availability |
|---|---|---|---|
TotalMethodRequestsPerSec | Rate of requests received per second by the WWW Service, per site | Work: Throughput | Web Service counter set |
Requests / Sec | Rate of requests received by a given worker process | Work: Throughput | W3SVC_W3WP performance counter set |
CurrentQueueSize | Number of requests in the HTTP.sys queue, per application pool | Resource: Saturation | HTTP Service Request Queues counter set |
cs-uri-stem | Rate of requests to a specific URI path | Work: Throughput | IIS logs |
cs-method | Rate of requests sent through a specific HTTP method | Work: Throughput | IIS logs, Web Service counter set |
Metric to alert on: TotalMethodRequestsPerSec
TotalMethodRequestsPerSec tracks the rate of all HTTP requests received per second by the server. This is a basic measure of throughput for HTTP requests, and a starting point for uncovering issues.
A rapid decrease in the rate of requests can indicate problems within your infrastructure, such as periods of server unavailability. You’ll want to set an alert to notify you of any sudden changes to your baseline request rate, and monitor this metric alongside 5xx errors and service uptime (which we’ll discuss later).
Keeping a close eye on IIS activity can help you distinguish between legitimate and illegitimate traffic. Network security is a discipline unto itself and outside the scope of this article, but in general, it’s important to have a deep understanding of your HTTP activity. Monitoring the number of requests per second is a good first step. If you notice a spike in requests per second, you can take further steps to determine if the cause is, for instance, a denial of service (DoS) attack or a surge of referrals from a popular source (the so-called hug of death).
Microsoft recommends monitoring your IIS logs for spikes in Timer_ConnectionIdle messages, which appear when a client’s connection has reached its keep-alive timeout. A jump in the number of Timer_ConnectionIdle logs may indicate that DoS attackers are trying to max out the available connections to your server. But it can also happen when users are having issues with connectivity.
Metric to alert on: CurrentQueueSize
We’ve mentioned earlier that if no worker processes are available to handle a request, HTTP.sys places the request in a queue. CurrentQueueSize measures the depth of the HTTP.sys request queue per application pool. If the CurrentQueueSize of a pool is consistently approaching the pool’s maximum request queue length (1,000, by default, and configurable within IIS Manager), you’ll want to figure out the source of the backlog.
You’ll want to watch for sustained increases in CurrentQueueSize. Since the CPU is what handles requests within an application pool, a full queue probably means either that you’ve misconfigured the CPU limit for your application pool or that the pool has been stuck performing a CPU-intensive operation on a single request. The graphs below show CurrentQueueSize (red) alongside the % Processor Time (blue) for a single worker process before and after we throttled an application pool’s CPU utilization to two percent. You can see the effect on CurrentQueueSize. In the first half of the graph, CPU utilization has a very low baseline with periodic spikes. After throttling, there are no more CPU spikes, and CurrentQueueSize increases.
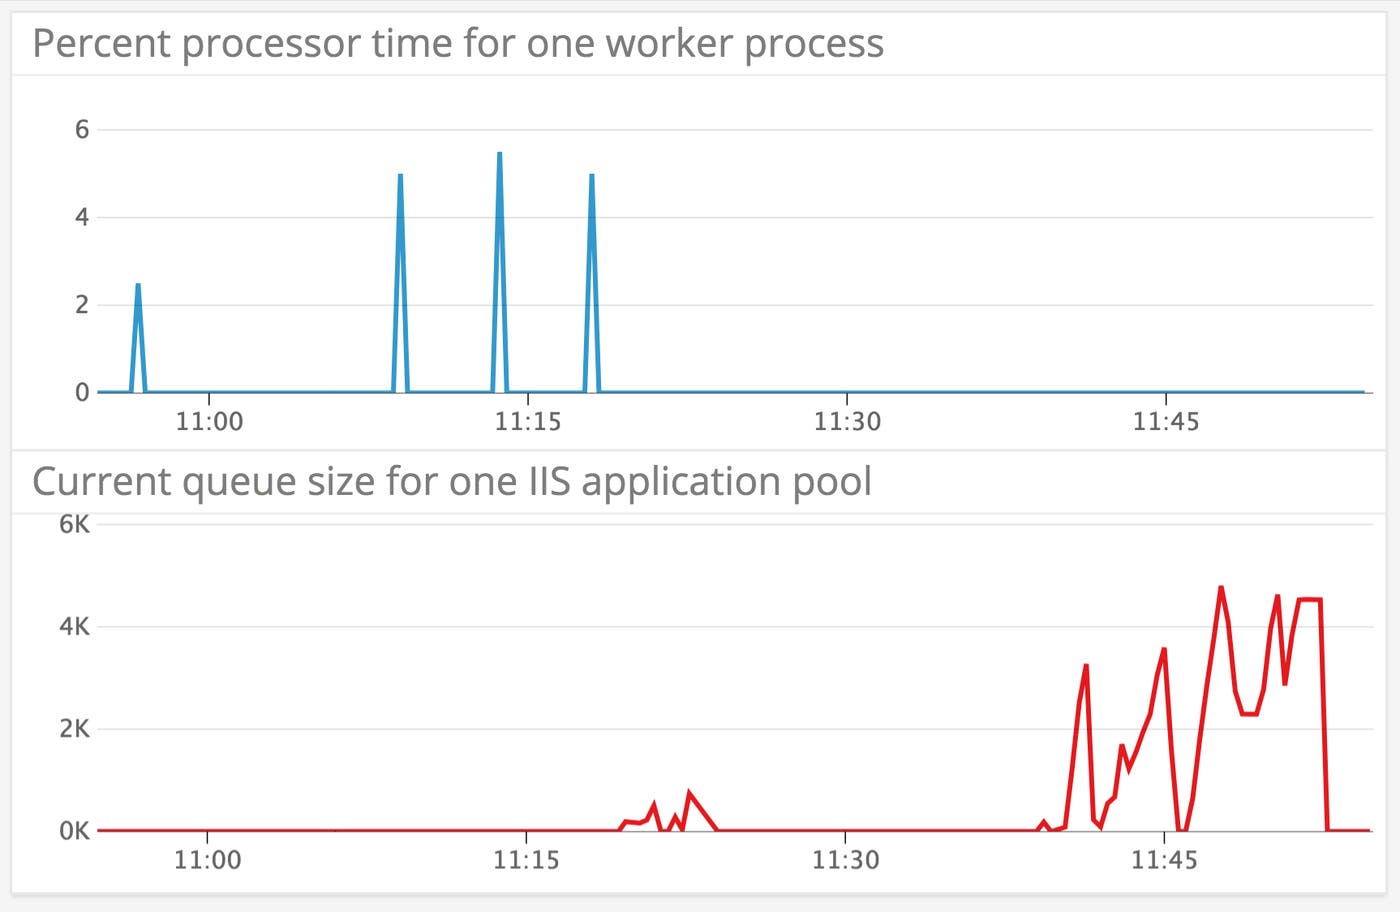
To ensure that your web applications are available for users, you’ll want to set up an alert to notify you when the CurrentQueueSize for a given application pool is approaching its maximum. After an application pool hits the maximum queue length, incoming requests will be dropped and the server will return the error code 503 (Server Too Busy). We’ll discuss this and other HTTP errors in a later section.
Depending on the source of your queuing issues, there are several steps you can take. If an application pool is consistently using a very high percentage of CPU, throttling that pool’s consumption to a specific limit prevents it from affecting the rest of your system until you can resolve the problem. As of IIS 8.0, you can also set the ThrottleUnderLoad property for an application pool, which allows an application pool to exceed its CPU limit if there is no contention for CPU. You may also want to allocate more CPU cores to your IIS hosts.
One way to reduce the number of 503 responses is to grant multiple worker processes to an application pool, an arrangement known as a web garden. Web gardens can ensure that worker processes are always available to handle requests.
Web gardens are not always suitable for every application, and in some cases, they may negatively impact IIS performance. First, if a worker process needs exclusive access to a file within the host, increasing the number of worker processes vying for the file will only create a bottleneck. Second, any additional worker process also maintains its own cache and CPU threads, and will increase the resource usage of an application pool. Depending on your use case, a more reliable alternative to web gardens may be splitting your application into microservices and dedicating an application pool to each. You can observe the extent to which web gardens are impacting performance in your particular case by monitoring the CPU and memory usage of each worker process.
You can also increase or decrease the maximum request queue length of each application pool. With a higher maximum queue length, IIS can serve a larger number of concurrent requests before it starts returning 503 errors to clients. However, if you set your maximum queue length too high, your server may seem unresponsive to clients while their requests are waiting in the queue. And if a request remains in an application pool’s queue for longer than the connectionTimeout limit you’ve specified for your site, the request will time out and record a Timer_AppPool error in the HTTPERR logs, which log the output of HTTP.sys. You can find these logs at C:\Windows\System32\LogFiles\HTTPERR\httperr.log. Microsoft recommends setting the maximum queue length no higher than 10,000.
Metric to watch: Requests / Sec
While TotalMethodRequestsPerSec counts all requests received by HTTP.sys, Requests / Sec tracks every request that HTTP.sys routes to each worker process. You should monitor both Requests / Sec (per worker process) and TotalMethodRequestsPerSec to get a more complete picture of IIS request throughput, since the behavior of these two metrics does not always coincide. As we explained, requests to IIS first reach HTTP.sys, and may enter a queue before shifting to the appropriate worker process. Monitoring TotalMethodRequestsPerSec alongside the Requests / Sec of each worker process makes it clear how (and how much) HTTP traffic is moving through your server.
Metrics to watch: cs-method, cs-uri-stem
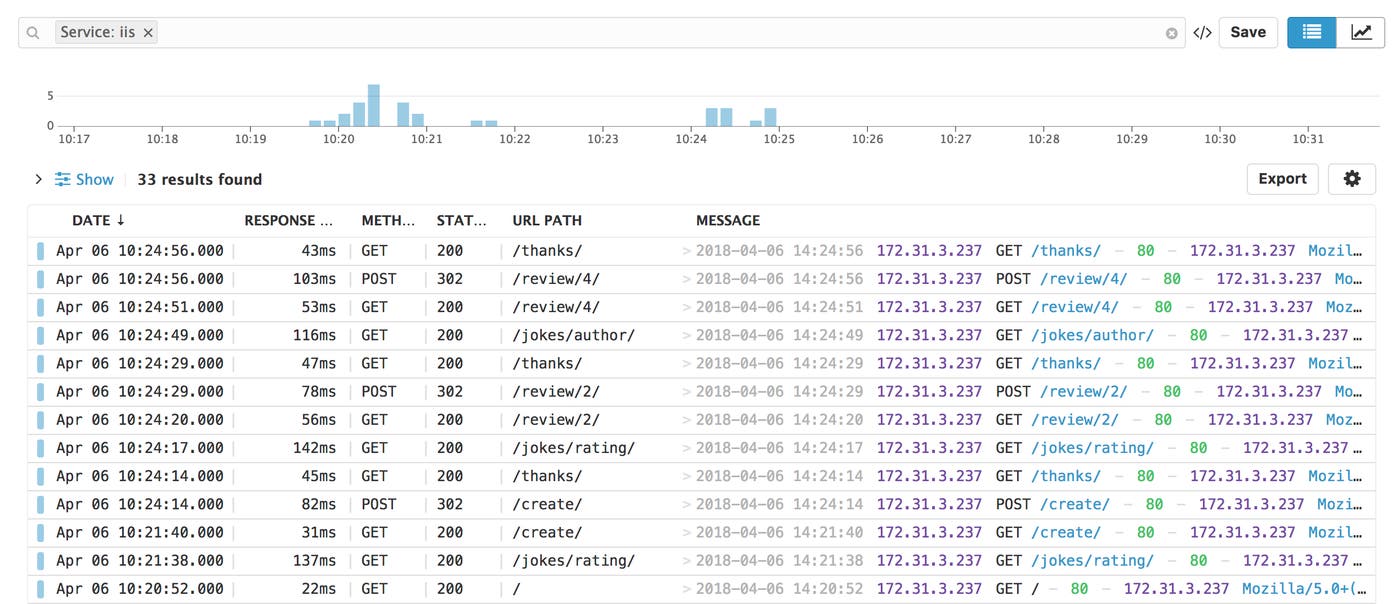
You’ll want to keep an eye on the URI paths and HTTP methods of requests to your IIS instances, as these are the most direct ways of determining which parts of your web applications are responsible for poor performance. By default, IIS will log the cs-method (HTTP request method such as GET or POST) and the cs-uri-stem, the URI target of the request (e.g., “/”). The cs in the names of these metrics stands for “client-to-server”.
You can parse your logs to collect the cs-method and cs-uri-stem of each request, and use this data to analyze the throughput, latency, and impact on resource usage of requests to specific routes within your web applications. If the average time-taken is higher than expected, for example, you can use cs-method and cs-uri-stem to see if the latency issues come from a specific page.
HTTP response metrics
Monitoring HTTP responses is the most direct way to see how your IIS sites are serving users. You’ll want to know about upticks in response latency before your users tell you. And a spike in 4xx or 5xx errors can signal a problem with a configuration setting or a breaking change in your application. You can parse and analyze your IIS logs to track the types of requests that have returned error responses. As of version 7.0+, IIS reports subsets of 4xx and 5xx status codes that provide more detailed descriptions. You can find a list of HTTP status and substatus codes here.
In Part 2, we’ll show you how to use the IIS logging module to log key information about each request, including the HTTP request method (GET, POST, etc.), cs-uri-stem (URL path), and time-taken (request processing time).
| Name | Description | Metric Type | Availability |
|---|---|---|---|
| 4xx errors | Count or rate of 4xx client errors | Work: Error | IIS logs, W3SVC_W3WP performance counter set (for certain error codes) |
| 5xx errors | Count or rate of 5xx server errors | Work: Error | IIS logs, W3SVC_W3WP performance counter set (for 500 error codes) |
time-taken | Time elapsed between the first byte of a request and the final byte of a response | Work: Performance | IIS logs |
Metric to alert on: 5xx server errors
IIS sends a 5xx status code when the server is unable to respond to a valid request. Common 5xx error codes include 503 (Server Too Busy) and 500 (Internal Server Error).
IIS will start sending 503 error responses after it has reached its maximum request queue length and cannot process any additional requests. We’ve discussed how you can prevent one source of 503s by setting up web gardens or increasing the maximum queue length.
Yet there may also be alternative causes of 503s. If you start seeing a high rate of 503 errors without a corresponding increase in CPU usage (which is usually a key indicator that worker processes are overloaded), you may want to consult the HTTPERR logs, as HTTP.sys may return a 503 before a request reaches a worker process (e.g., if an application pool goes offline).
If you’re running an ASP.NET application, you may also see 503s that have to do with appConcurrentRequestLimit, the maximum queue size for concurrent requests piped from IIS. Just like when an application pool reaches its maximum queue length, an ASP.NET application will begin responding to requests with 503 errors after hitting its appConcurrentRequestLimit (by default, 5,000).
Without deeper investigation, it can be hard to determine the source of a 500 error, but the IIS substatus code may offer clues. For example, 500.13 indicates, “Web server is too busy,” which means that, because of resource constraints, the server has exceeded the number of concurrent requests it can process (irrespective of the appConcurrentRequestLimit you’ve configured). If you’re using the ASP web framework, the 500.100 substatus code indicates an “Internal ASP error.” In this case, you’ll want to check your ASP error logs for a more specific error message.
You may want to correlate 5xx errors with the rate or count of requested URI paths (cs-uri-stem) and HTTP request methods (cs-method). If requests to certain URI paths are returning 500 status codes at a much higher rate, you may want to investigate whether it’s related to recent changes in your application code.
Finally, you can use the W3SVC_W3WP counter, % 500 HTTP Response Sent, to track the percentage of responses that have returned a 500 error. Like the other error-related counters in this set, this counter won’t tell you a substatus code—you can only glean that information from the logs. It’s generally a better idea to monitor the rate of 5xx errors using logs, since they can provide more context around the exact cause of each error.
Metric to alert on: time-taken
You can configure IIS to log time-taken, the time it takes for IIS to process a request. This metric represents the difference, in milliseconds, between two timestamps: when HTTP.sys receives the first byte of a request, and when IIS finishes sending the final byte of the response to the client, including network latency. High response latency can affect user experience, so you’ll want to be alerted if it consistently exceeds an undesirable threshold.
Two ways you can improve response latency include using HTTP compression to reduce the size of the files that IIS returns, and using output caching to store commonly generated versions of dynamic content in memory.
The effectiveness of these solutions depends on your use case. Output caching won’t have any impact if your web server only sends static files. And if your content changes frequently, the resource use of caching may offset any drop in response latency. File compression only improves the latency of certain HTTP requests—those that include an Accept-encoding header that matches the compression strategy you’ve specified in your IIS configuration (e.g., “Deflate” or “GZIP”). If you’re looking to implement file compression, you may want to monitor the Accept-encoding header by logging it as a custom field.
Metric to watch: 4xx client errors
You have as little control over some 4xx errors as you do over the requests your users send. But a wave of specific messages may be worth investigating. If HTTP.sys doesn’t recognize an HTTP request as valid, IIS will return a 400 status code (Bad Request). A pattern of 400 status codes can indicate that HTTP.sys is shutting out requests that you want it to accept. For example, the MaxFieldLength property specifies the limit, in bytes, for each header in a request, and might be rejecting certain headers. You can find the reason for a 400 error in the HTTPERR logs. In the example of MaxFieldLength, you’ll see the value of the field s-reason as FieldLength in the HTTPERR logs. You can edit MaxFieldLength and other properties in the registry.
While the occasional 404 (Not Found) status code is to be expected, a sustained increase may indicate disorganized or missing assets. Some 404s may indicate an issue with handlers, IIS extensions that process requests to particular URI paths (e.g., by file type). IIS will return a 404 error when a handler is looking for its own dependencies at file paths that don’t exist (perhaps because you have not installed them).
While records of most HTTP errors are only available through logs, it’s worth noting that you can measure the rates of certain 4xx errors—401 (Unauthorized), 403 (Forbidden), and 404—by querying the W3SVC_W3WP performance counter set.
Availability metrics
To ensure that your users can access your content, you’ll need to monitor the availability of several components of IIS. You’ll want to know when your application pools have recently restarted or stopped running entirely. You’ll also want to get alerted if IIS is no longer listening for HTTP requests. In this section, we’ll discuss two IIS metrics that can give you insight into the availability of your server.
| Name | Description | Metric Type | Availability |
|---|---|---|---|
ElapsedTime | Number of seconds a process has been running | Resource: Availability | Process performance counter set |
ServiceUptime | Number of seconds the WWW Service has been running (per site or across all sites) | Resource: Availability | Web Service counter set |
Metric to watch: ElapsedTime
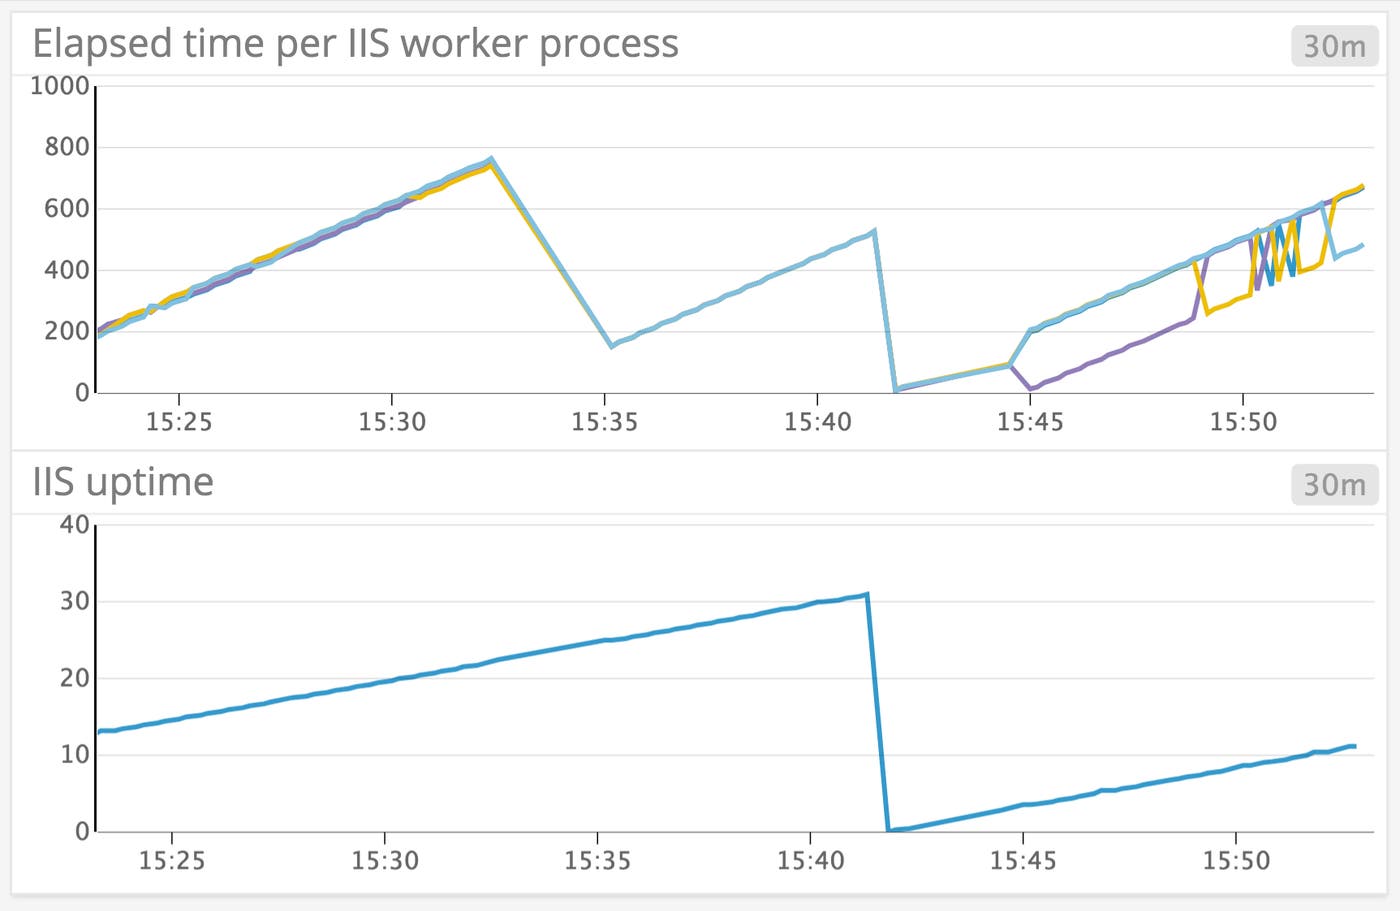
ElapsedTime records the number of seconds a Windows process has been running, and is particularly useful for monitoring IIS worker processes. When an application pool restarts (or “recycles”), ElapsedTime resets to zero. Recycle events may erase application state and cause brief periods of unavailability. If recycling events are causing issues for your infrastructure, the thresholds you’ve configured for recycling may be out of step with the actual resource use of your application pools.
You can configure your pools to recycle once they’ve hit two kinds of memory thresholds: private memory, which is not shared with other pools, as well as virtual memory, the reserved memory addresses of each application pool. It’s also possible to recycle an application pool based on regular, time-based intervals, or once it has served a certain number of requests.
By default, recycling based on request count and memory usage is disabled, and application pools will restart every 29 hours. These settings are configurable, as is the option for IIS to spin up a new application pool automatically whenever another one begins to shut down.
If you’ve noticed that the ElapsedTime of a worker process has reset recently, you can refer to the logs to find out whether an application pool may have recycled, and what the reason was. In the “Advanced Settings” window for an application pool within IIS Manager, you’ll find a section called, “Generate Recycle Event Log Entry,” which lists the names of recycle events and gives you the choice of whether or not to log them.
Metric to watch: ServiceUptime
ServiceUptime tracks the number of seconds the WWW Service (or a specific IIS site) has been running since it last restarted. Because the WWW Service operates atop an entire IIS instance, ServiceUptime is the only metric that can take a pulse from the IIS software as a whole. This is important because a single worker process can become unavailable while the WWW Service—and your IIS sites—will continue to run (and return 503 errors to users), so you’ll want to monitor both ElapsedTime and ServiceUptime separately.
In the example below, we recycled an application pool at around 3:32 p.m. The ElapsedTime of each worker process reset, while ServiceUptime continued to increment. When we restarted the IIS server at around 3:42 p.m., both metrics reset.
Resource metrics
Since application pools are isolated from one another, with their own worker processes, it’s important to monitor them individually. An application pool could face resource contention or even crash, while IIS as a whole appears to be functioning.
| Name | Description | Metric Type | Availability |
|---|---|---|---|
PercentProcessorTime | Percentage of CPU utilization per process (within a user-configured sample interval) | Resource: Utilization | Process performance counter set |
WorkingSet | Number of bytes within a process’s virtual address space stored in physical memory | Resource: Utilization | Process performance counter set |
Metric to watch: PercentProcessorTime
One resource metric you’ll want to monitor is PercentProcessorTime, the percentage of time a given process has used the CPU. Monitoring the CPU utilization of running worker processes lets you allocate your server resources effectively—for instance, you may want to throttle the CPU consumption of application pools when they reach a specific limit. You’ll also want to investigate the cause of high CPU usage and see if you can mitigate it.
If a single application pool is consistently using more than its expected CPU, it’s likely that you will need to find a way to optimize your application code. You’ll want to identify the application pool that’s causing the issue, and beyond that, any problematic code. While you cannot use IIS Manager to identify the application pool that a specific worker process belongs to, there are tools you can download for this purpose.
You may also want to approach the problem another way, by correlating periods of high CPU usage with the frequency of requests, broken down by URI path and HTTP method. If spikes in requests with a specific combination of HTTP method and URI path correspond with spikes in CPU utilization, you’ll want to look into backend code that handles these headers. You may also want to create a memory dump and use a separate software program to perform a stack trace.
Metric to watch: WorkingSet
Windows processes have access to a virtual address space, where they store pages that map to locations where data is also stored on physical RAM. WorkingSet tracks the number of bytes currently within a worker process’s working set, the pages within a process’s virtual address space that are stored in physical memory.
You’ll want to monitor memory consumption, both by application pool and across your system. Too much memory usage across your system can cause an out-of-memory exception. And if you’ve configured an application pool to recycle when it hits a certain memory threshold, but the code that handles requests to the pool continues to consume a lot of memory, recycling the pool will only postpone the problem.
It’s important to watch for memory leaks in your application pools, as well as whether you can trace them to an IIS module or your application code. It could also be the case that your application simply consumes a lot of memory, for example, by using string concatenation to return HTML.
As with CPU utilization, you can find the source of high memory consumption by analyzing a memory dump with a tool like DebugDiag (see Part 2), correlating memory consumption with the paths and methods of HTTP requests, and identifying which w3wp.exe instance belongs to which worker process.
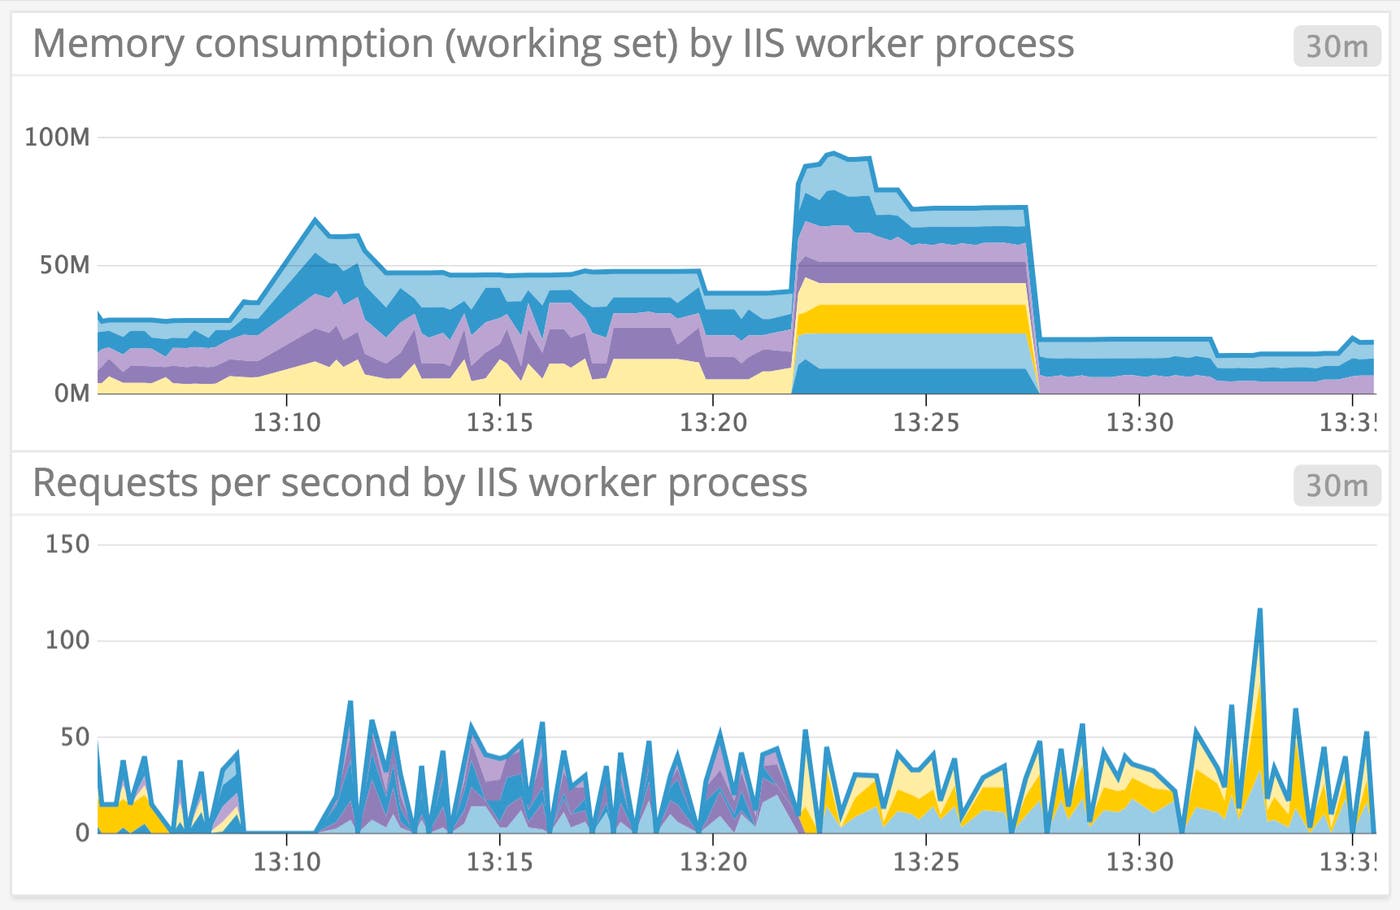
Below, we see a bump in memory consumption per worker process in a specific application pool, after the pool recycled around 1:22 p.m.
Next step: Collect IIS metrics
This post has covered some key IIS metrics for tracking the health and performance of IIS. In particular, we’ve illustrated the importance of monitoring the traffic and resource usage of IIS application pools alongside metrics aggregated from HTTP requests. In Part 2 of this series, we will show you how to collect these metrics from Windows Performance Counters, IIS logs, and the IIS HTTP API.
