Nils Bunge

Emily Chang
Logs provide a wealth of information that is invaluable for use cases like root cause analysis and audits. However, you typically don’t need to view the granular details of every log, particularly in dynamic environments that generate large volumes of them. Instead, it’s generally more useful to perform analytics on your logs in aggregate. Grouping your logs into categories—such as response duration buckets—helps you efficiently analyze all your logs, so you can get deep insight into your applications and infrastructure at lower cost.
Datadog’s log processing pipelines can automatically enrich your logs with attributes that categorize them as they are ingested. This means, for example, that you’ll be able to immediately use attributes like url_path_category to break down traffic to main parts of your application, instead of manually querying all of the individual URL paths within major sections of your platform.
In this post, we’ll explore how these pipelines can help you categorize logs based on:
Then, we’ll walk through how to use your log categories to configure more precise log indexing policies and generate richer log-based metrics for more effective monitoring and analytics.
Categorize logs based on URL patterns
If your application dynamically generates URL paths that include elements like unique shopping cart IDs (e.g., /cart/<CART_ID>), it’s likely that you don’t need (or want) to dive down to logs that track traffic to individual carts. Instead, you’re more likely to analyze this data in aggregate: How are requests to cart-based URLs performing in general, rather than how is a specific cart performing?
In this section, we’ll cover two approaches to configuring log processors to categorize logs by enriching them with a http.url_category attribute, based on their URL paths.
Create custom URL categories with the category processor
Let’s say that your web access logs include a URL path attribute that includes values like these:
- /files/thumbnails/thumbnail1.png
- /files/images/myimage.jpg
- /products/robot_cat
- /products/trash_bags
- /files/thumbnails/thumbnail17.png
- /files/images/secondimage.jpg
Instead of tracking every one of these URLs individually, it’s probably more useful to group them into categories like these:
- /files/thumbnails
- /files/images
- /products
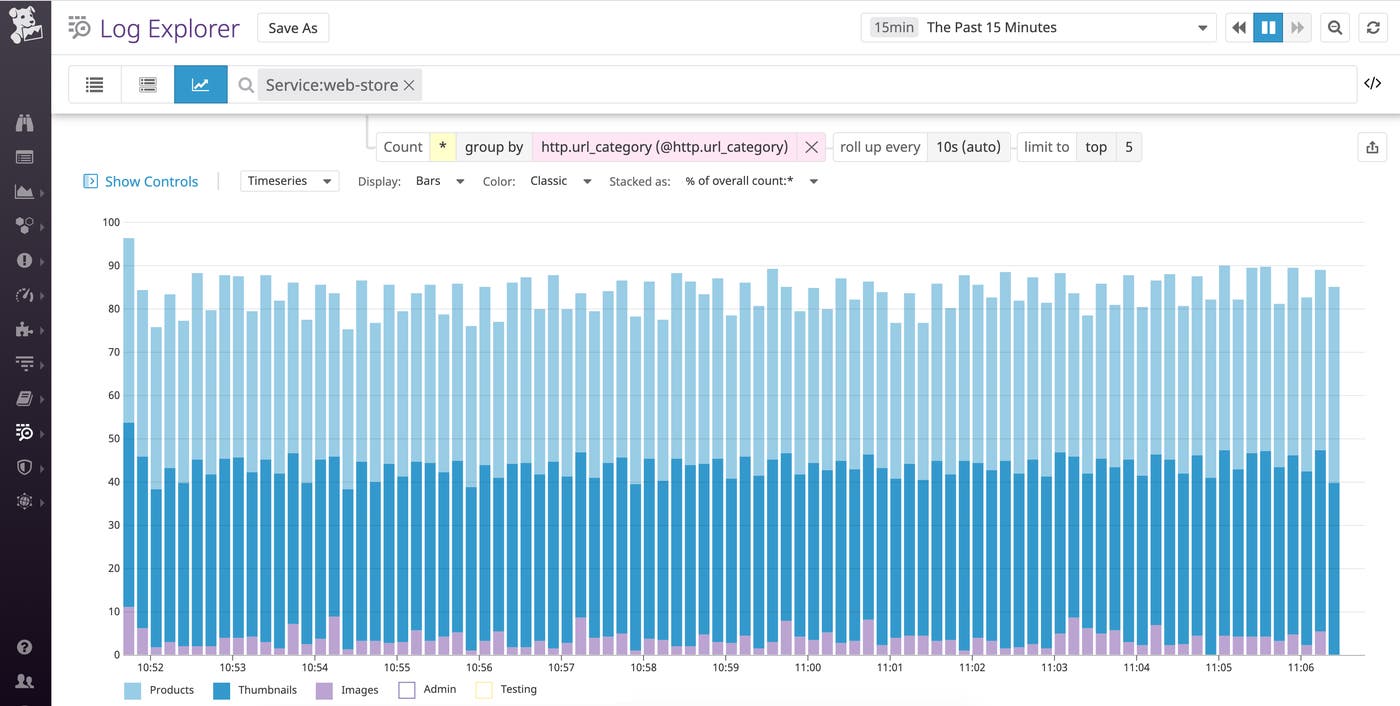
This would enable you to analyze and compare traffic to main categories of URLs in your application, instead of breaking down traffic across a large number of URL paths.
To do so, you can configure a category processor that specifies http.url_category as the category attribute to create (the “target category attribute” below). You can then define queries to look for logs that belong in this category. In this case, we’re looking for logs whose URL path attribute (http.url) matches one of the URL patterns from above. You can use wildcards when defining your queries to ensure that you account for all possible URL paths. Whenever a log’s http.url attribute matches a query, the processor will add the http.url_category attribute, along with the appropriate value of the attribute—Thumbnails, Images, or Products—to that log.
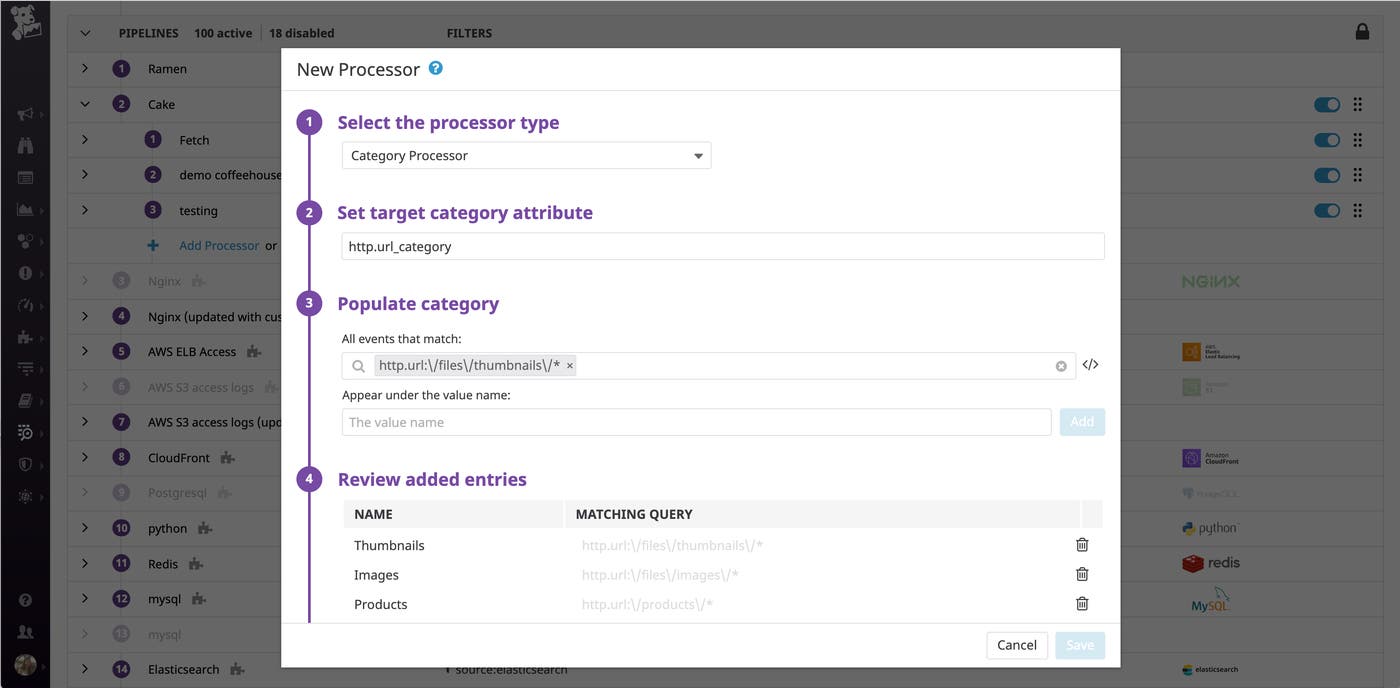
If your application only generates a handful of possible URL formats, this is an easy way to process logs into custom categories. If your logs fall under a larger number of categories, we recommend using a grok parser instead, which we’ll cover in the next section.
Auto-categorize logs by URL patterns with the grok parser
In addition to using a category processor to manually create categories, you can use a grok parser to parse URL paths from your web access logs and use the extracted text to automatically generate the name of the http.url_category attribute.
For instance, in the following list of URL paths, some paths contain two IDs, whereas other paths contain just one ID:
- /files/thumbnails/<THUMBNAIL_ID>
- /files/images/<IMAGE_ID>
- /files/pdfs/<PDF_NAME>
- /products/pages/<PRODUCT_ID>
- /products/remove/<PRODUCT_ID>
- /products/add/<PRODUCT_ID>
- /products/edit/<PRODUCT_ID>/<SESSION_ID>
You can configure the category processor to capture the exact part of the URL you want to use to generate the URL category name.
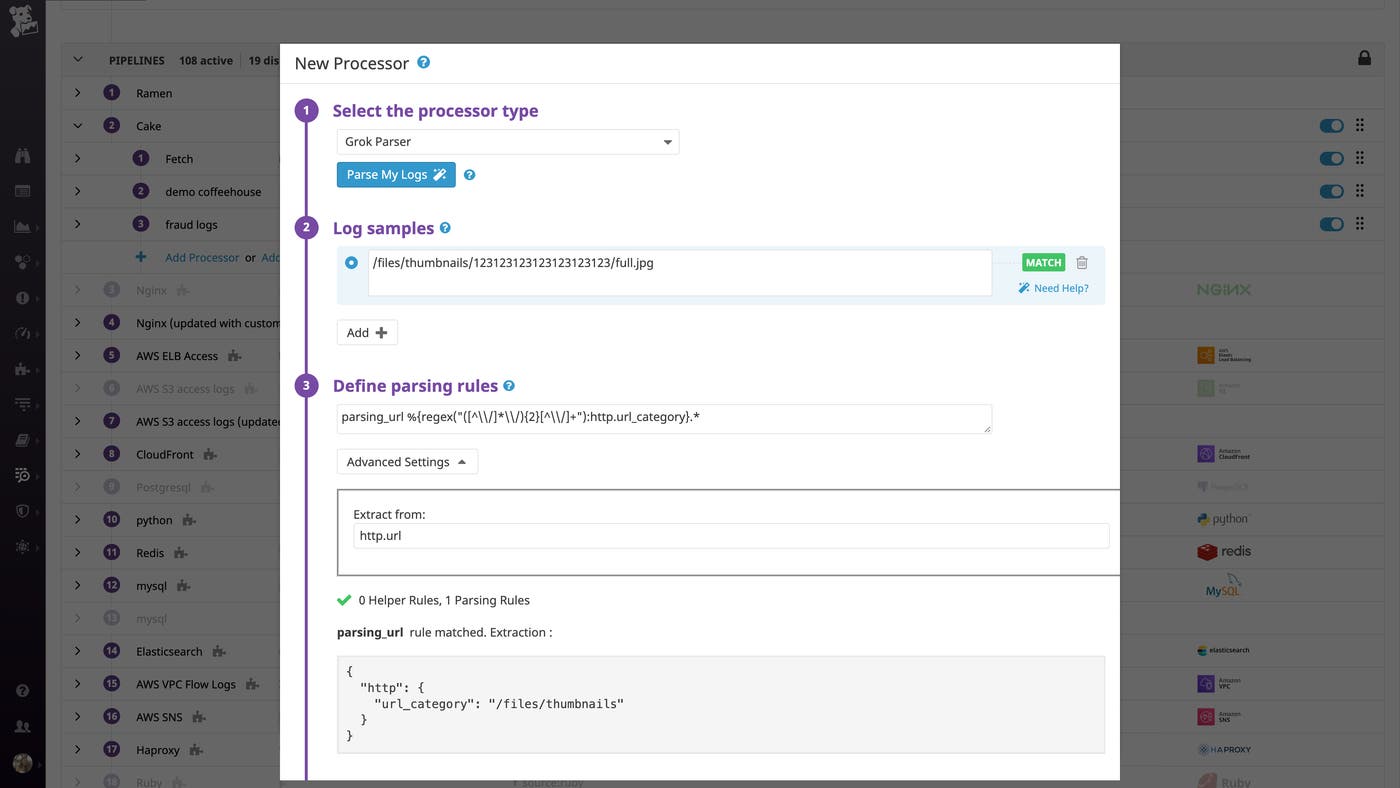
In the example below, the grok parser uses a parsing rule that looks like this:
parsing_url %{regex("([^\\/]*\\/){2}[^\\/]+"):http.url_category}.*The parsing rule uses a regex matcher to extract the two first elements of each log’s URL path. Then it automatically maps this extracted text to the value of a new http.url_category attribute. To learn more about parsing rules, check out our documentation.
Categorize logs based on response duration
If your web access logs or application logs include information about response time, you can configure a category processor to parse the value of that field and enrich the log with a response_time_bucket category that will group logs based on those values.
You can use a category processor to parse the value of the response time (represented by the duration log attribute in this case) and use that value to enrich the log with a specific response_time_bucket attribute. Every team, service, and organization has different performance requirements, so your rules will most likely differ from the example below.
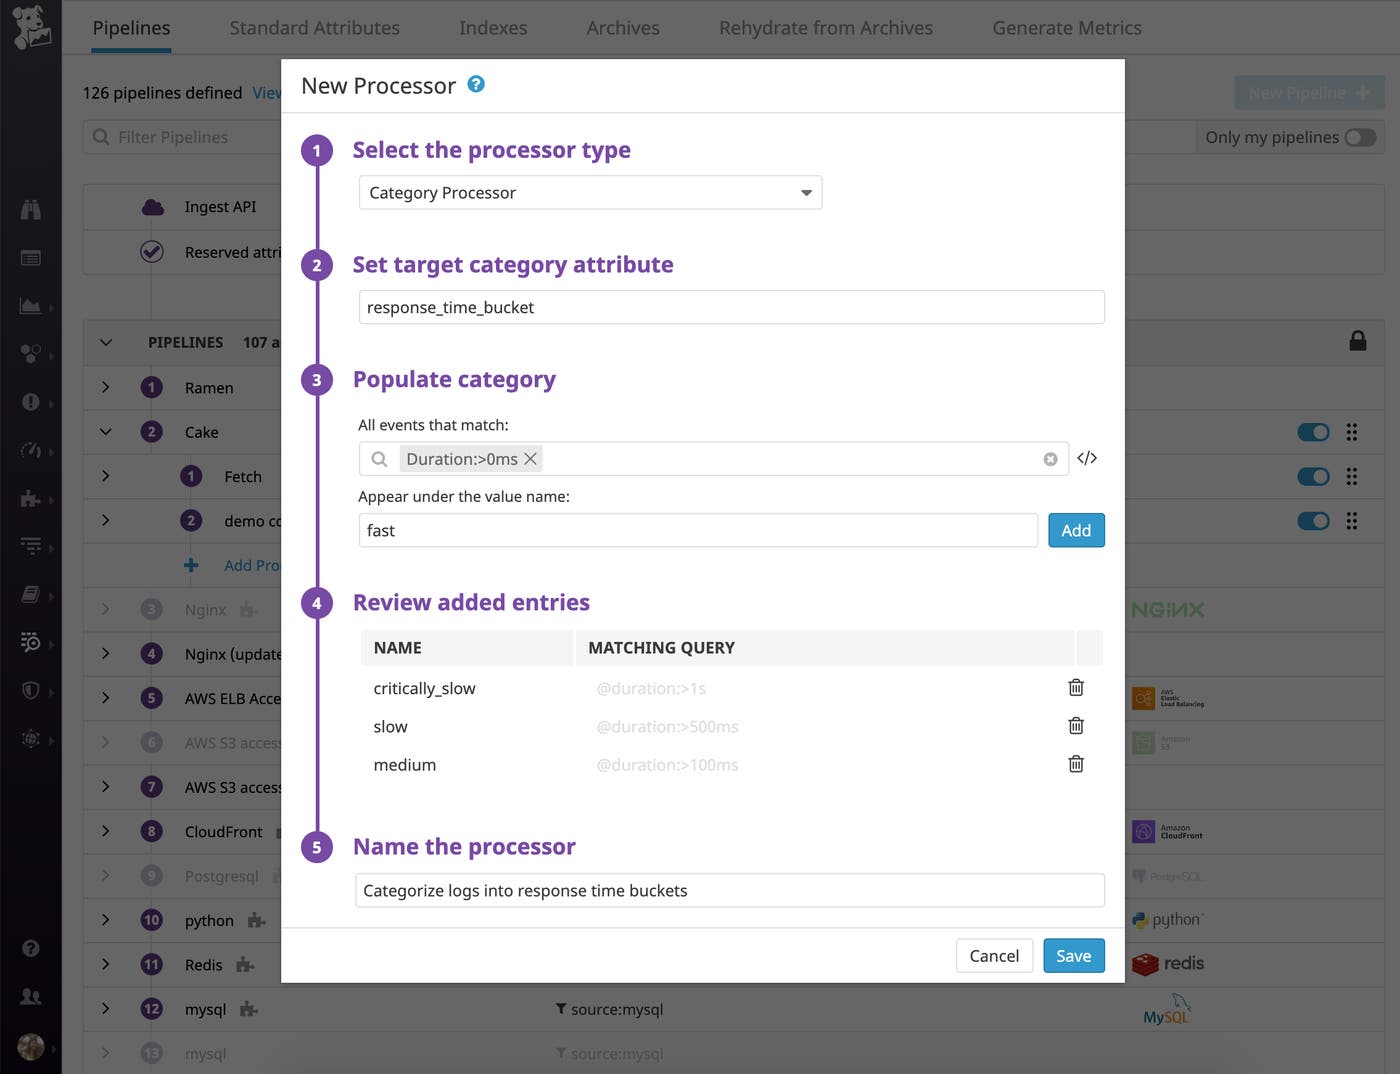
You could also define each query as a range (e.g., @duration:[1ms TO 100ms]). Note that the category processor applies rules in order, and once it determines that a log matches a category, it doesn’t continue evaluating that log against other rules.
Now you can start using this response_time_bucket attribute to analyze performance trends. Below, we can see that there was a spike in the number of “critically slow” logs, which could warrant further investigation.
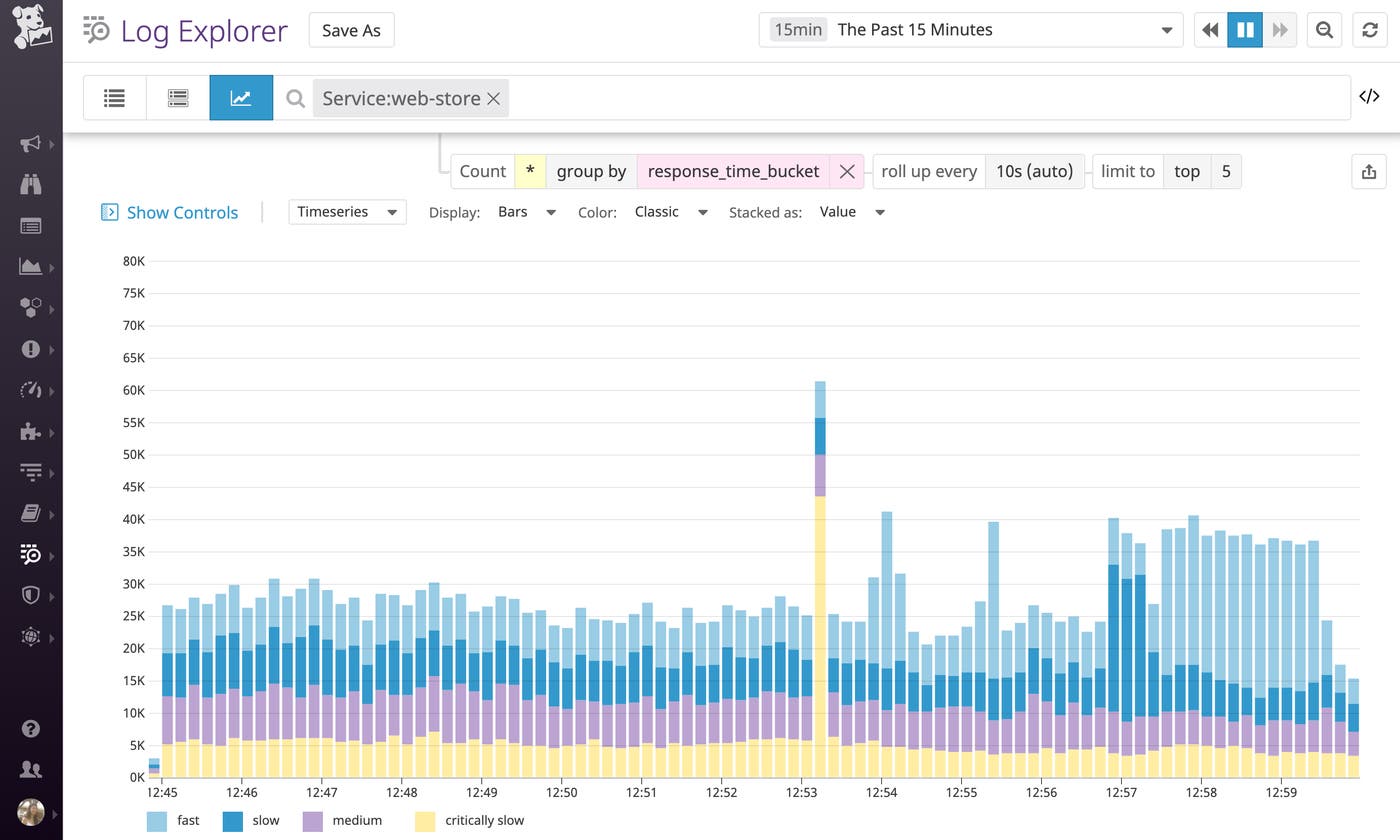
Once you’re categorizing logs based on response time, you will be able to create better log-based metrics and indexing policies, as we’ll cover in a later section.
Categorize by logs based on standard severity levels
Log severity levels help you quickly triage issues so you can focus on the most important ones, such as when a specific application endpoint is generating more errors than usual. However, many technologies and services represent log severity levels in different ways, which can make them difficult to interpret consistently.
For example, syslog severity levels range from 0 to 7, with lower numbers indicating higher priority. Meanwhile, Bunyan, a logging library for Node.js applications, uses log levels that range from 10 to 60, with higher numbers corresponding to higher priority.
And other services may not use numerical log levels at all. For instance, Redis uses symbols to represent log levels:
| Log severity symbol | Log level |
|---|---|
| . | debug |
| - | verbose |
| * | notice |
| # | warning |
By default, Redis inserts this log severity symbol after the date field of each log message:
<PROCESS_ID>:<ROLE> <DATE> <LOG_SEVERITY_SYMBOL> <MESSAGE>`All of this variation can make it difficult to interpret and analyze log severity information across the range of services in your environment. To address this challenge, Datadog’s log integration pipelines enforce a common schema by parsing your logs for log severity information and translating it into a standard status attribute that is helpful for analyzing all technologies in your stack.
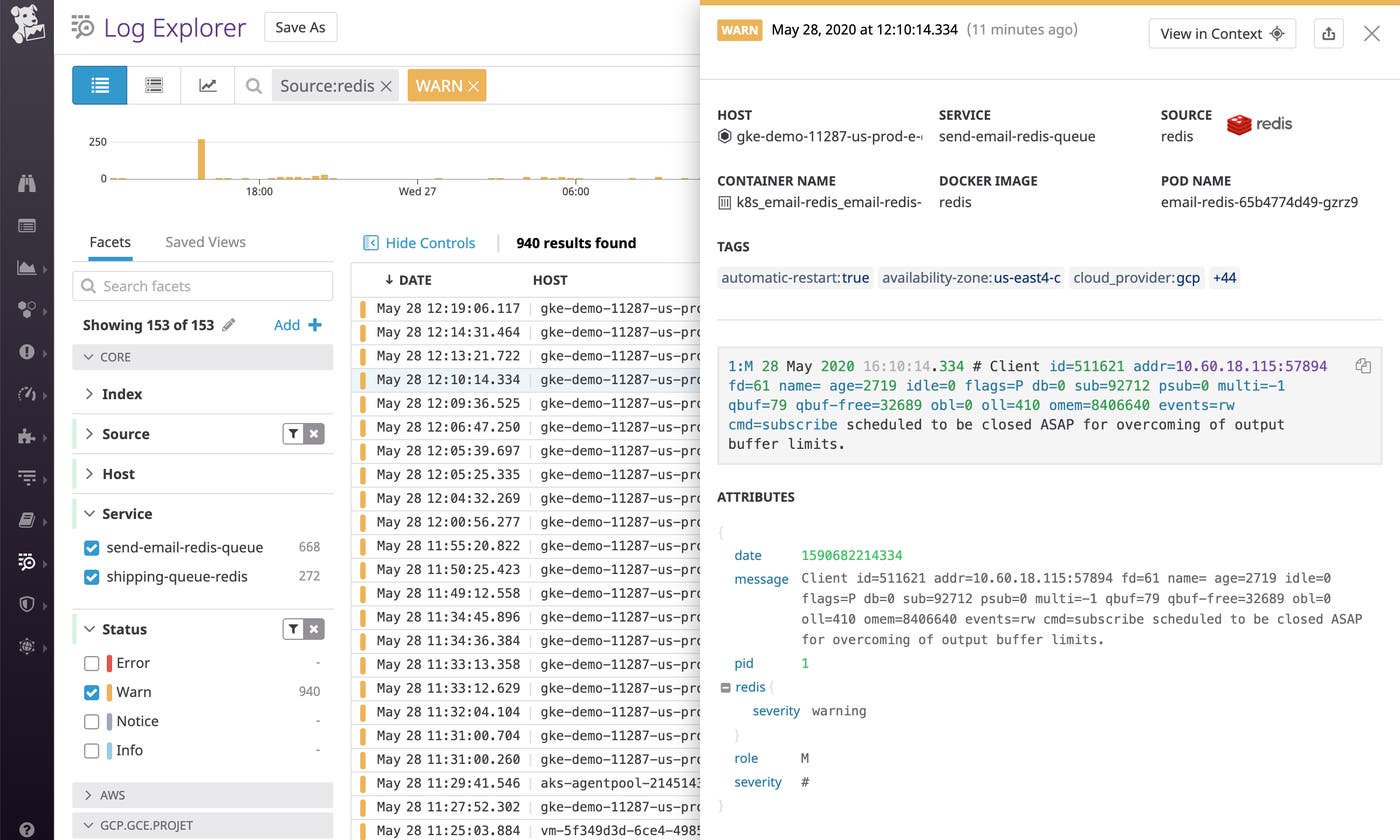
For example, Datadog’s log integration pipeline for Redis parses the log severity symbol (e.g., severity: #) from the message and uses a category processor to enrich the log with the appropriate severity level attribute (@severity: warning). It then maps that level to a standard, official status (WARN, in this case).
Similarly, Datadog’s log integration pipeline for MongoDB also uses the log severity information detected in the log message to assign a standard status value. By default, MongoDB represents warning-level logs as W, as shown in the log below. This log severity attribute (@db.severity: W) gets mapped to a WARN status.
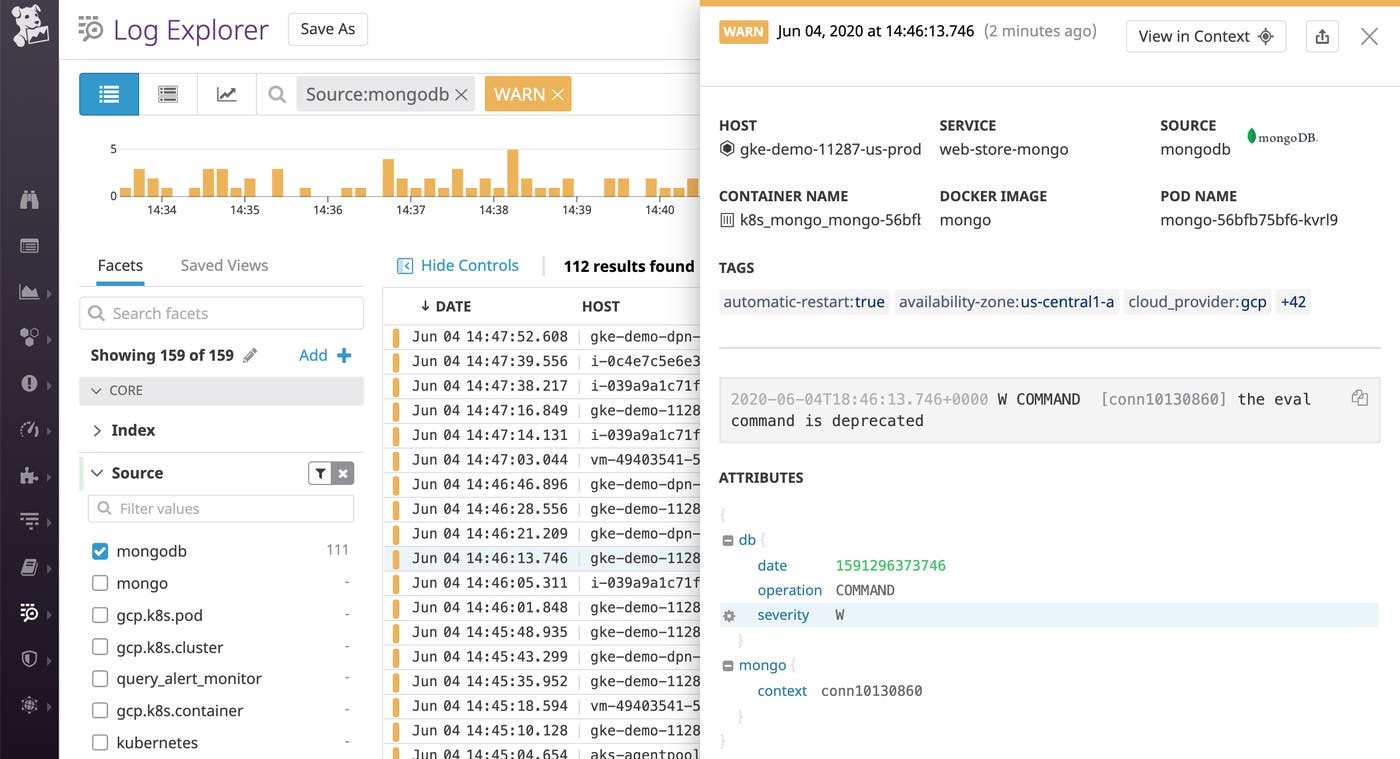
This means that we can now use these standard status values to analyze logs across different technologies. Below, we were able to filter for a single status value to analyze warning-level logs, instead of filtering by two attributes (@db.severity:W for MongoDB and @severity:warning for Redis).
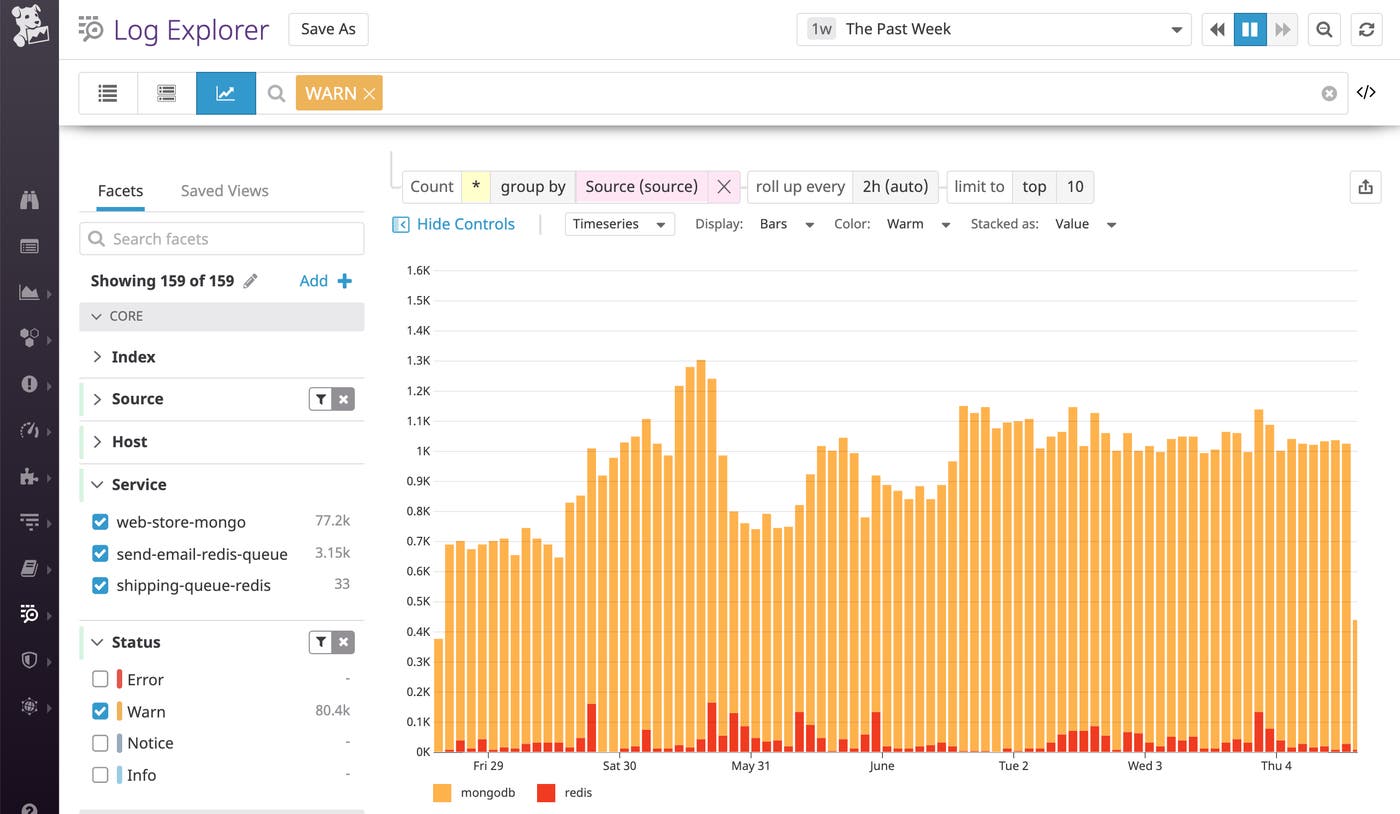
For any applications that use a custom log format that isn’t covered by our default log integrations, we recommend adding a category processor and a log status remapper to your log processing pipeline. This will ensure that your logs are enriched with the proper status based on the severity level.
For example, your Java application might write logs with an info severity level by default, but also include an HTTP status code. In this case, you’ll probably want to set the severity level based on the status code instead, as it more accurately reflects the seriousness of the log (e.g., 5xx logs should have an error status). To do so, you could follow the documentation here to ensure that logs are correctly categorized based on their status code.
Once your log processing pipelines are categorizing your logs by severity level and enriching them with a standard status attribute, you can use the status to perform analytics on your log data and to create better metrics and indexing policies. In the next section, we’ll walk through some examples of how to use the categories we’ve created thus far.
Use log categories to drive indexing policies and analyze trends
Now that Datadog’s log processing pipelines are enriching your logs with category-based metadata, you can use those attributes to configure indexing policies that address your team’s specific priorities. In this section, we’ll expand on how you can use categories to inform your exclusion filters, which determine what types of logs should get excluded from indexing. We will also walk through how you can start using your log category attributes to create metrics that capture insights from all your logs—regardless of whether or not they’re being indexed.
Index high-priority categories of logs
Category-based attributes can play a key role in ensuring that you’re indexing high-priority categories of logs that you’ll need for debugging or root cause analysis. This also effectively allows you to stop indexing other, lower-priority logs for more cost-effective monitoring—while still archiving all your enriched logs in long-term cloud storage.
With Datadog’s exclusion filters, you can dynamically change your indexing policies to address your business priorities and real-time circumstances (such as an outage). For example, you may want to index more types of logs from the /carts URL category (because those pages are customer-facing and directly related to revenue), but only the server-side error logs from an internal-facing /admin URL category.
In the exclusion filter below, Datadog will filter out 90 percent of logs from the /carts URL category with a 2xx status code while indexing all other logs from this category. You can set up another filter to exclude all status codes except for 5xx logs from the /admin URL category, since it is only accessed internally.
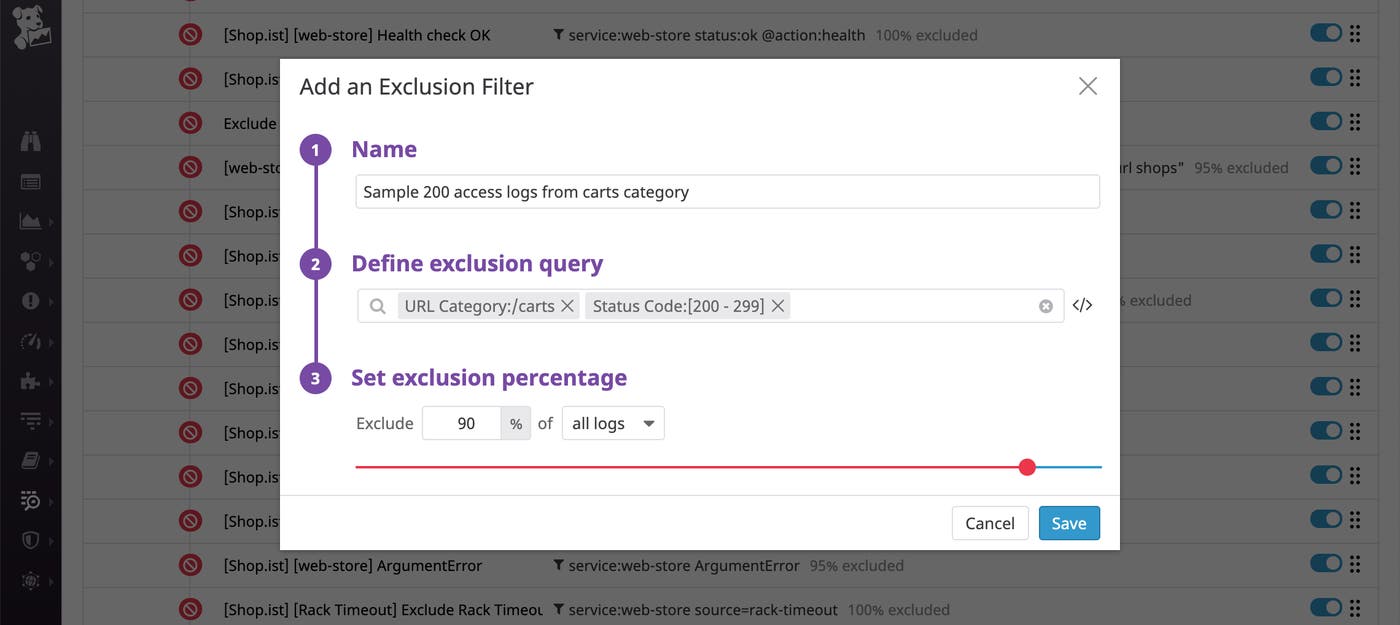
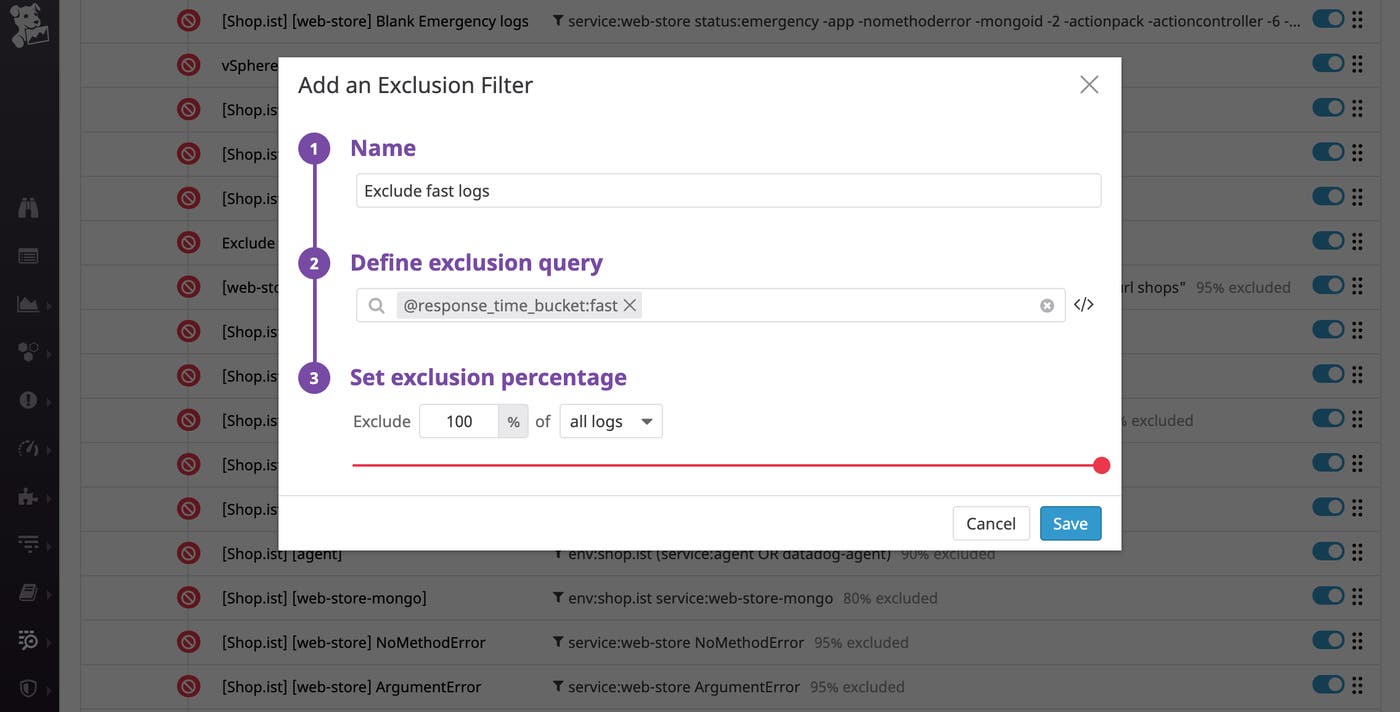
You can also use the response_time_bucket attribute to make sure that Datadog only indexes logs that fall into the “critically slow,” “slow,” and “medium” categories, which could be useful for debugging. Below, you can see that Datadog is excluding all logs that have an attribute of response_time_bucket:fast.
Analyze long-term trends in categories of logs
Generating metrics from your logs allows you to extract insights from your logs without the expense of indexing all of them. And, because metrics are retained for 15 months at full granularity, you can use them to track long-term trends across all categories of logs. When you create a log-based metric, you can ensure that the category attribute appears as a tag that you can use for analysis.
For example, you can create an app.request.count metric and convert your logs’ new category attributes (http.url_category and status) into tags. This means that you can use those tags to identify interesting trends in your metrics. Below, you can see that we’ve graphed application traffic that resulted in errors (by filtering for the status:error tag), and broken down this metric by URL category rather than a large number of unique URL paths. Here, we can see that the /products/remove category is exhibiting the most errors compared to the /products/pages category.
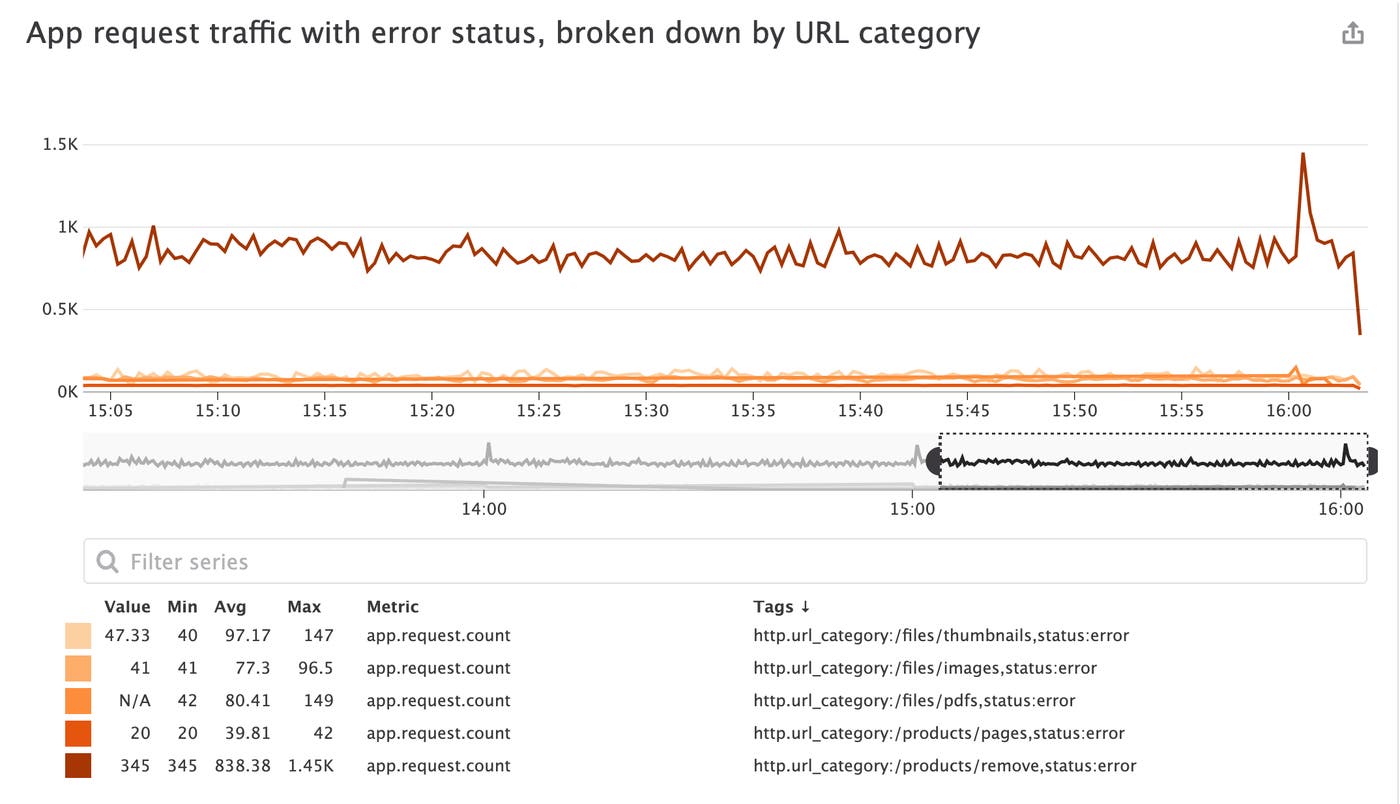
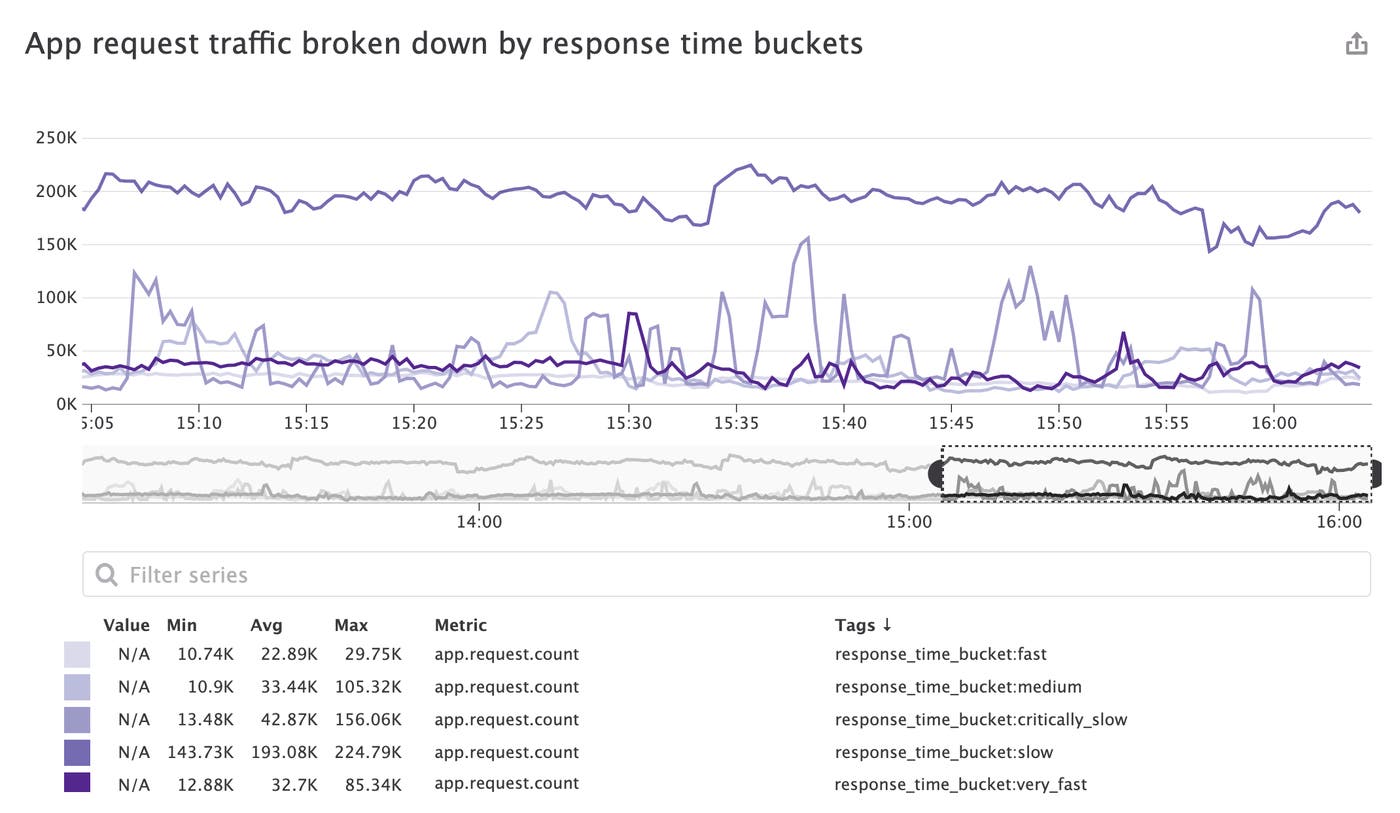
You can also tag your app.request.count metric with the response_time_bucket attribute, allowing you to accurately monitor the ratio of slow to fast requests and visualize the evolution of those buckets without indexing all of your logs.
Start categorizing logs with Datadog
In this post, we’ve explored how to get more out of your logs by categorizing them with log processors. We’ve also seen how log categories can help you create more cost-effective indexing policies and richer log-based metrics, allowing you to get critical visibility into high-priority logs and long-term trends, without the expense of indexing and retaining everything. You can complement your existing log pipelines with Reference Tables, which enable you to automatically map business-critical data to your logs for faster troubleshooting. If you’re already using Datadog, check out our documentation to learn more about using processors to categorize your log data. Otherwise, sign up for a free trial to get started.

