Paul Gottschling
Apache Hive is an open source interface that allows users to query and analyze distributed datasets using SQL commands. Hive compiles SQL commands into an execution plan, which it then runs against your Hadoop deployment. You can customize Hive by using a number of pluggable components (e.g., HDFS and HBase for storage, Spark and MapReduce for execution). With our new integration, you can monitor Hive metrics and logs in context with the rest of your big data infrastructure.
Optimize Hive memory usage
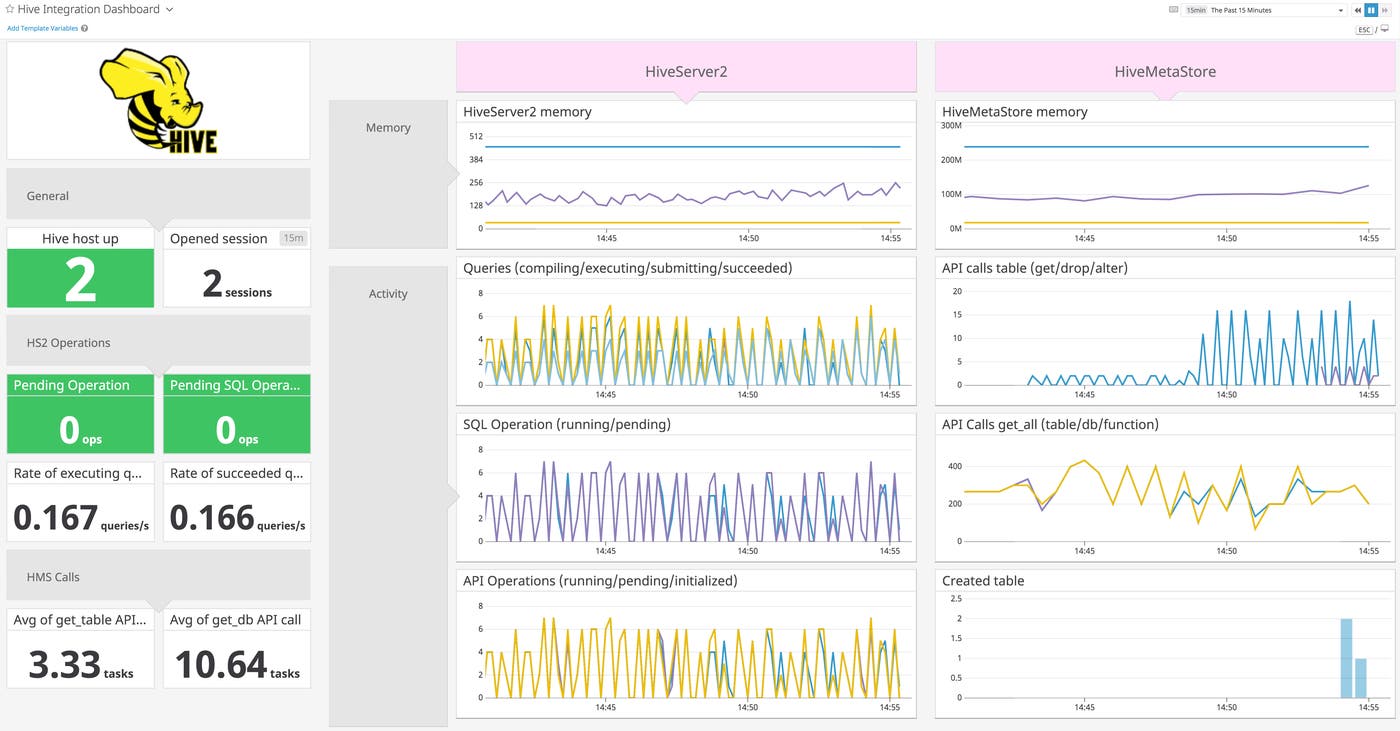
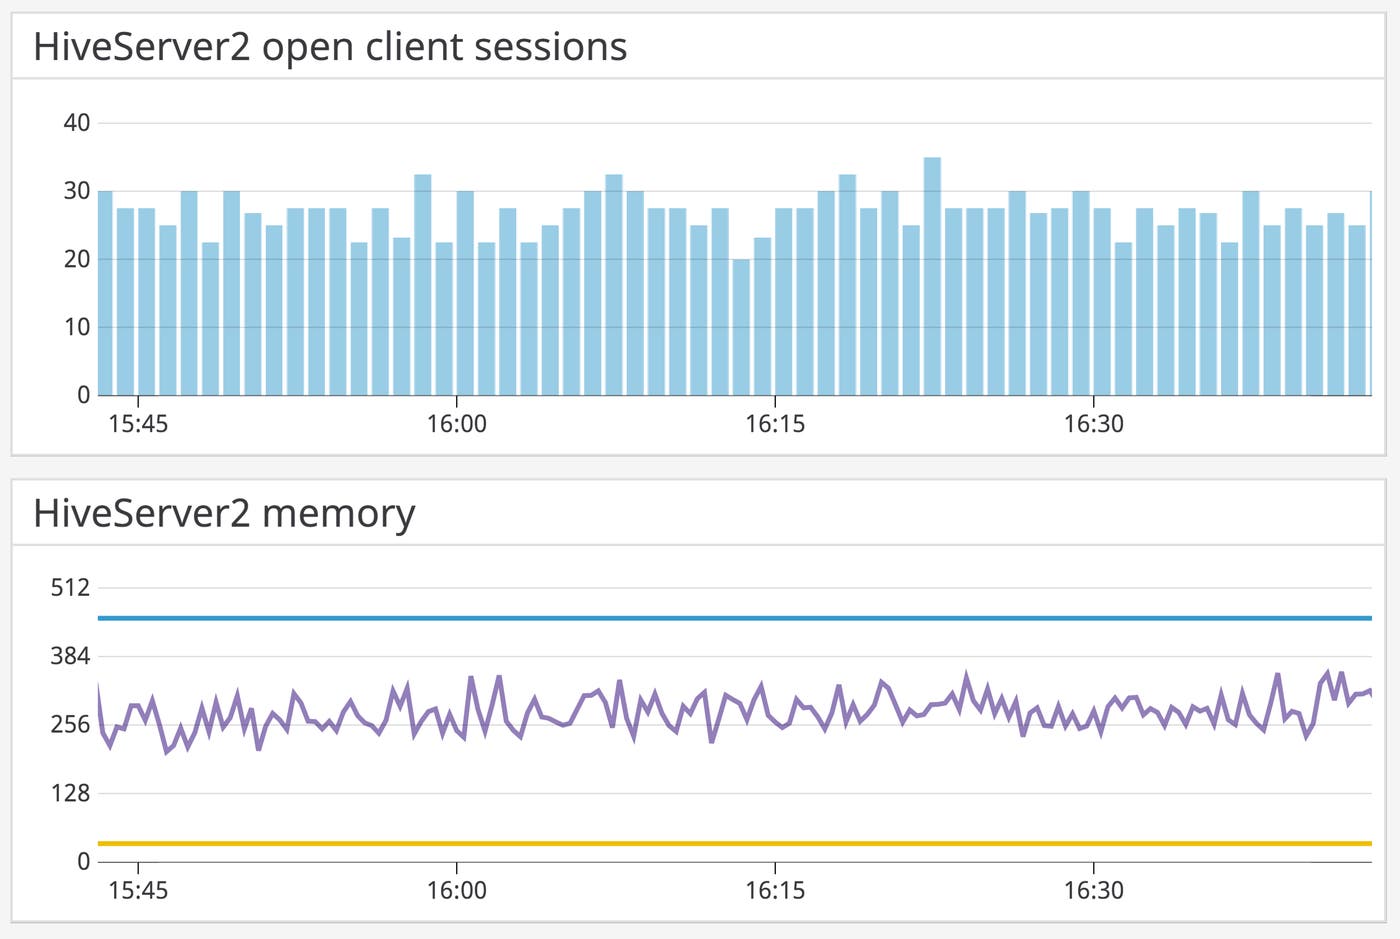
The more clients you expect to be using Hive at once, the more heap memory you will need to allocate to ensure proper performance. Datadog’s out-of-the-box dashboard allows you to track client sessions alongside memory usage from two Hive components:
- HiveServer2, which processes client connections using an RPC framework and HTTP server
- the Metastore, which stores information about the structure of your Hadoop data for use in executing and compiling queries
Monitor Apache Hive and the rest of your big data infrastructure with Datadog.
You can use the out-of-the-box dashboard to determine when HiveServer2 and the Metastore are nearing their maximum heap size. You can then clone and customize the dashboard to see how many concurrent sessions correspond with high memory usage, and understand when demand is likely to be high.
Troubleshoot slow queries
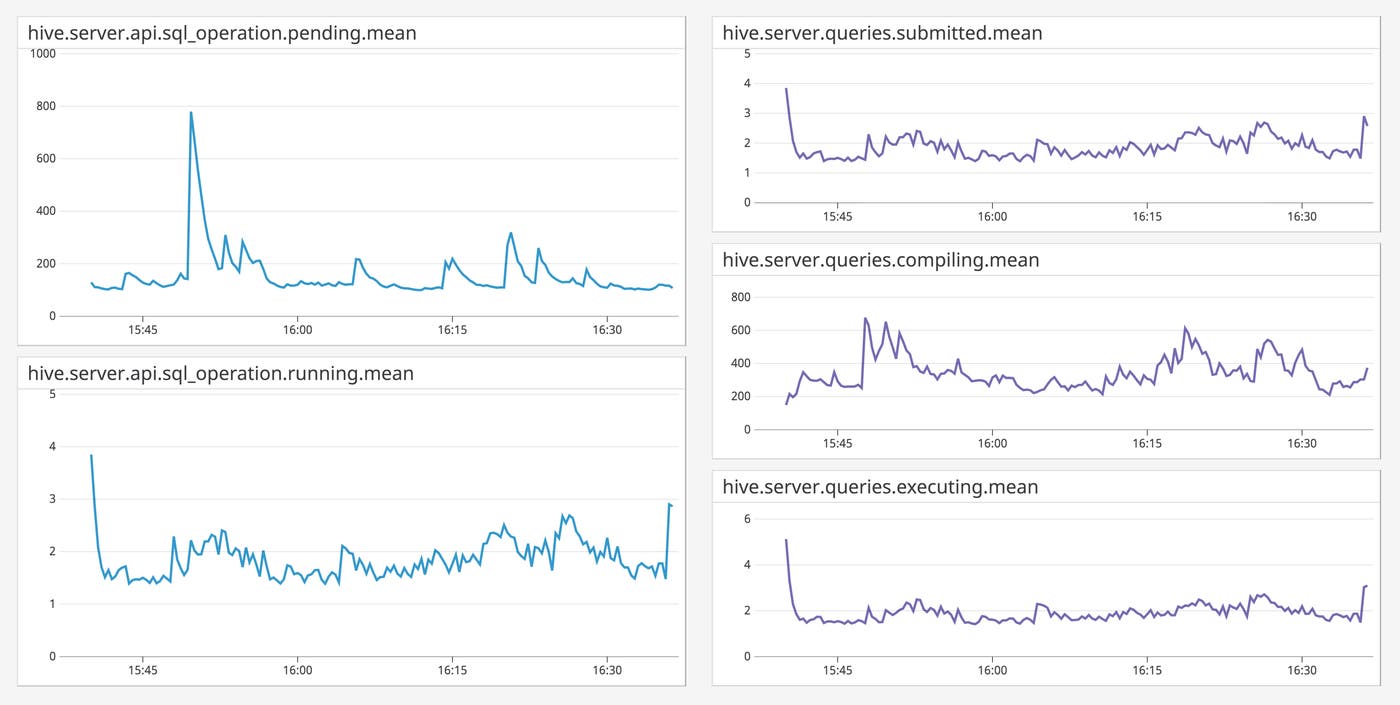
SQL operations in Hive go through a series of states before they return results to the user, such as INITIALIZED, PENDING, and RUNNING. Once these operations reach the Hive Driver, Hive tracks their progress through another set of phases: submission, compilation, and execution. With Datadog’s integration, you can track the time your SQL operations spend in different states, allowing you to identify bottlenecks and optimize performance.
Investigate execution errors in context
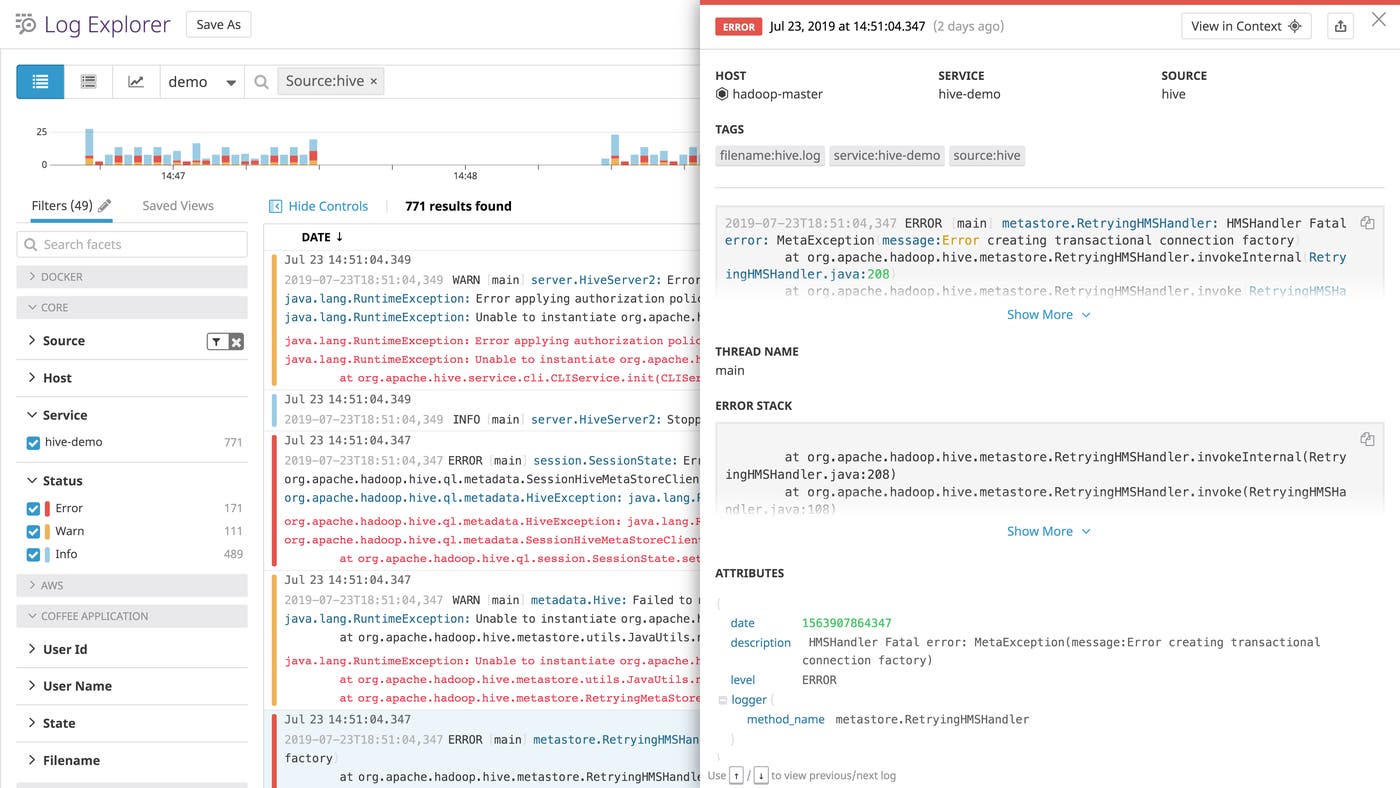
If your Hive queries fail to execute, it’s important to get context from your logs to help you troubleshoot. Datadog’s integration includes a log processing pipeline that makes it straightforward to troubleshoot Hive errors. The integration automatically parses your Hive logs for key information like the database operation and user, allowing you to find commonalities and discover erroneous commands. And for unhandled exceptions, Datadog’s log parser can also capture stack traces, making it easier to pinpoint the causes of errors (e.g., in the situation below, an internal exception thrown by the Metastore).
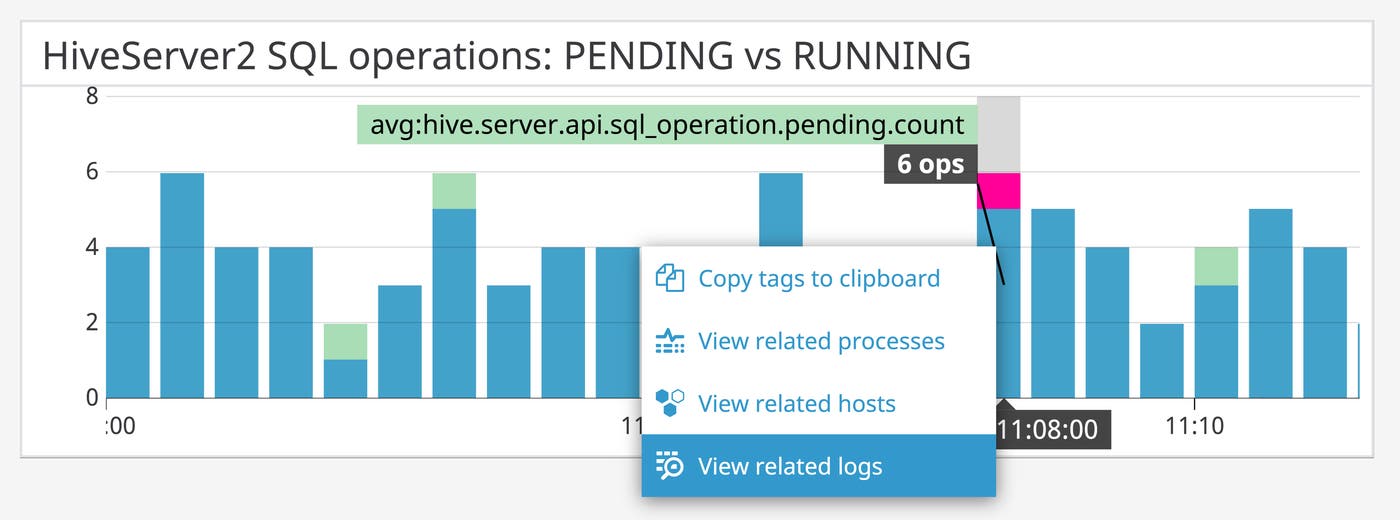
You can use Datadog to identify issues with a particular phase of query completion, and then navigate to correlated logs to investigate possible root causes. For example, if the out-of-the-box dashboard shows an increase in PENDING SQL operations but not in RUNNING ones (or RUNNING operations have dropped off), there might be errors in the PENDING phase. You can click the graph to consult logs from when RUNNING operations declined, and see if (for example) there’s been a HiveSQLException.
Dogs, bees, and elephants—oh my!
Datadog’s Hive integration gives you even more visibility than before across your distributed big data architecture, including HDFS, YARN, and MapReduce, as well as technologies that might be running alongside Hadoop, such as AWS Elastic MapReduce and ZooKeeper—all told, Datadog supports 1,000 integrations and counting. You can try out Datadog for yourself with a free trial.

