Abhinav Modugula

Angelina Jin

David Pointeau

Kyler Kang

Vic Weiss
As enterprises scale, teams often find it harder to identify user-reported issues. Software-defined wide area networks (SD-WANs) can make it easier to add branch offices, but they can also make it more challenging to distinguish connectivity degradation from changes in application behavior. FortiManager provides a centralized control plane for Fortinet Secure SD-WAN and reduces operational complexity.
Datadog’s FortiManager integration allows teams to monitor link quality and FortiGate edge device health, as well as validate SLA-based routing decisions. By correlating metrics, logs, and Network Device Monitoring (NDM) metadata, it becomes easier to spot connectivity issues and understand what may be affecting application performance.
In this post, we’ll explain how this integration allows engineering teams to:
Track link quality and SLA compliance
SD-WAN policies decide which links to route traffic based on real-time conditions and defined SLAs. Still, connections can appear to be fully functional while users experience intermittent failures. Having accurate information about the performance of these paths is key to diagnosing network issues that might initially present as application behavior.
By using FortiManager as a proxy, Datadog contacts each FortiGate device and collects key signals to determine link quality and status. The out-of-the-box dashboard helps teams visualize metrics like latency, jitter, and packet loss by link and SLA. During an incident, having centralized access to this data and its historical trends reduces investigation time and helps teams focus on remediation.
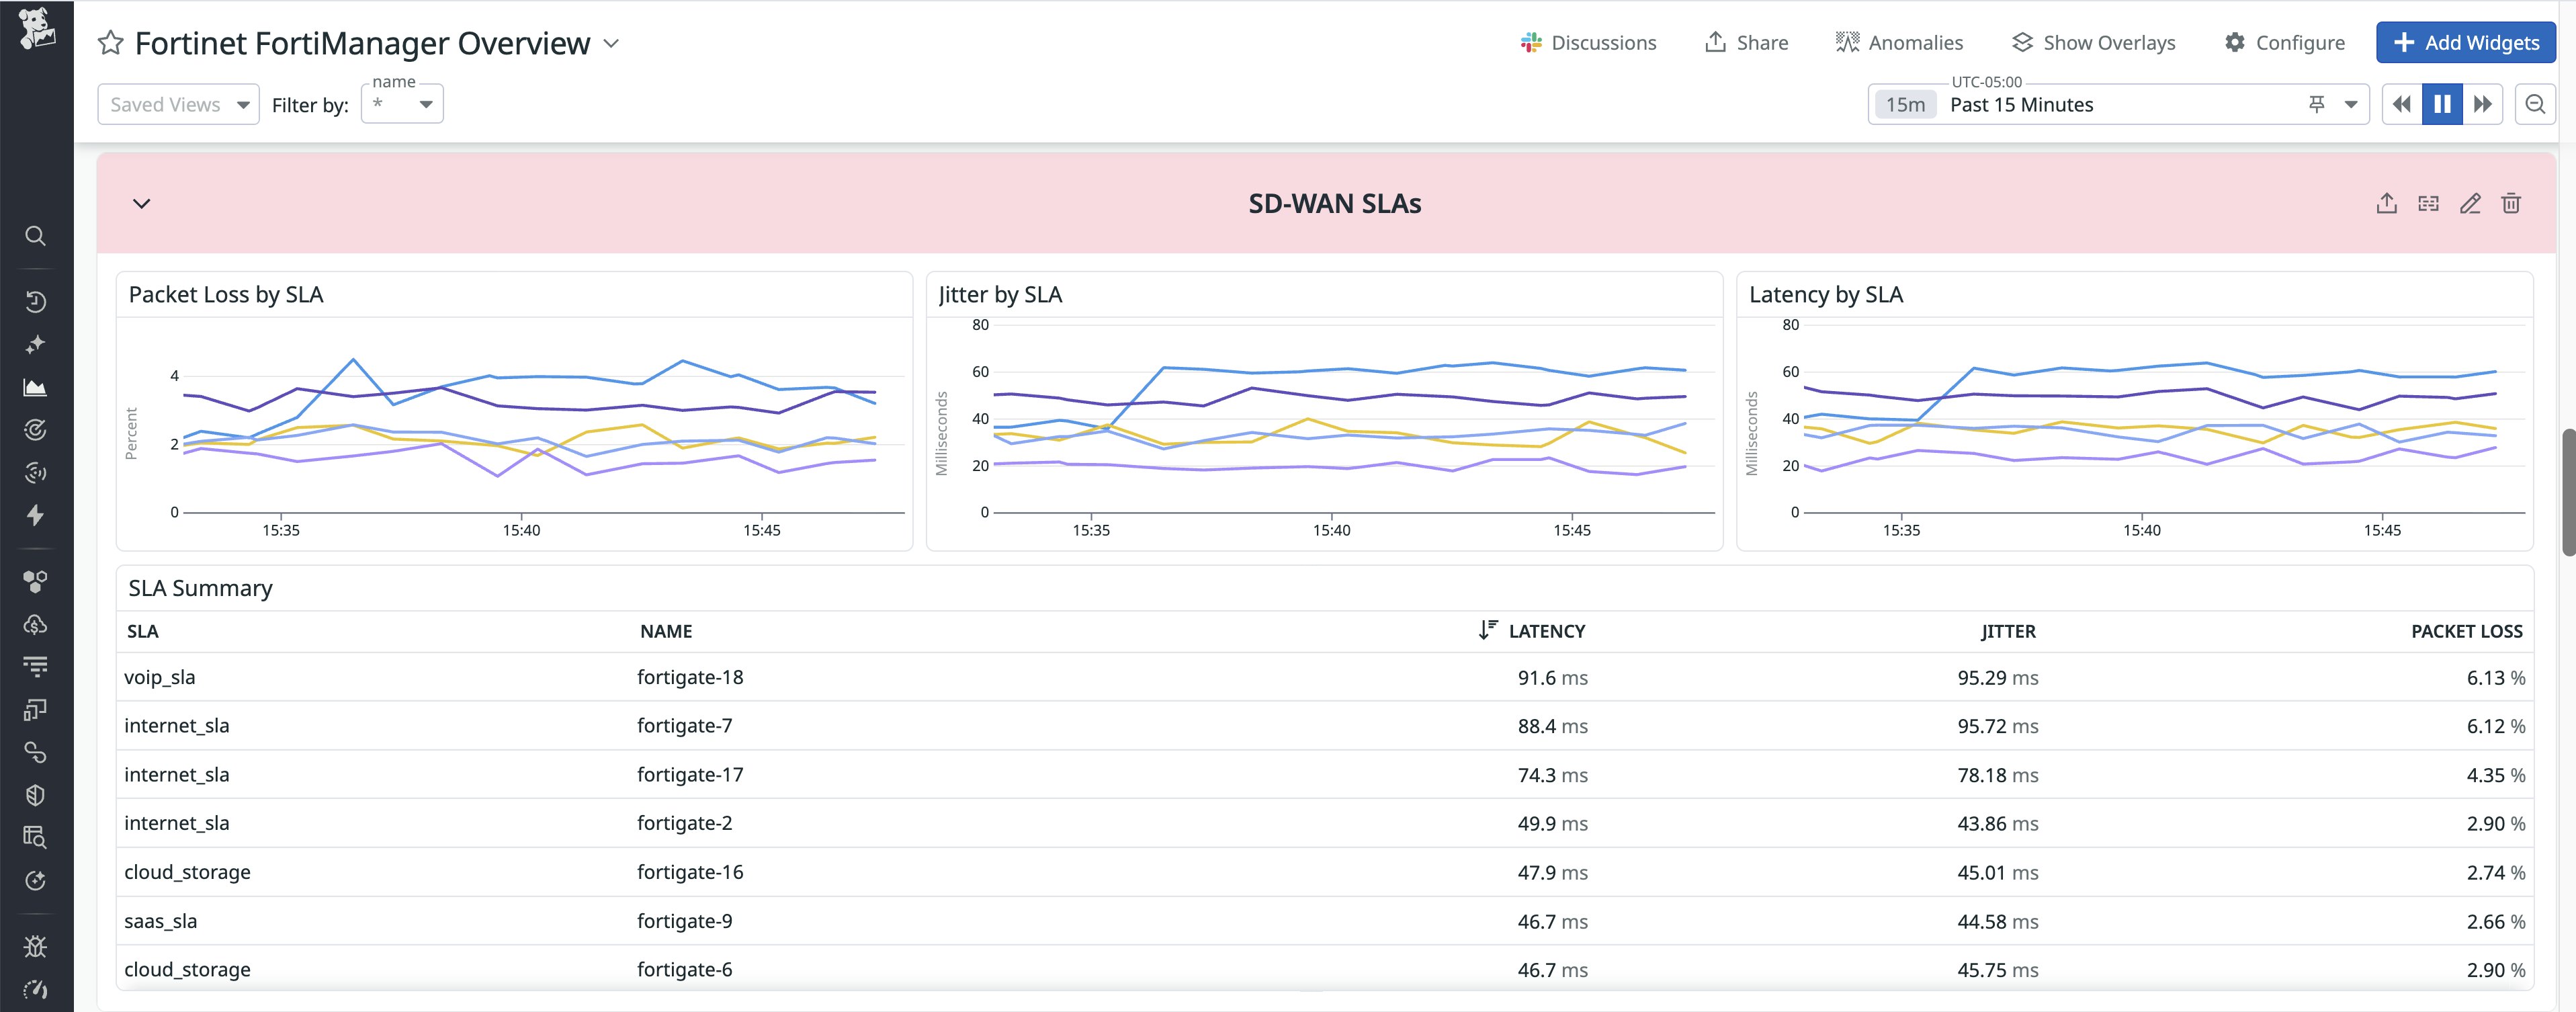
Once the integration is active, engineers can also build monitors around the conditions that matter to their organization, such as jitter spikes or sustained packet loss on primary circuits that lead to failed requests. Teams can then connect those to the context available in Datadog’s dashboards to compare link performance across sites, which can be useful when trying to determine whether a problem is isolated to a single branch or part of a broader issue.
Monitor edge device health
Even when WAN links are healthy, edge appliances can become the bottleneck. A common scenario is a FortiGate device with CPU near 100% utilization or low available memory. To users, this can look like a slow network, even when there is no clear failure signal. Without device health visibility, it can be difficult to separate an overloaded branch appliance from an upstream provider issue, especially when both problems can produce similar symptoms.
With Datadog’s integration, teams get more visibility into FortiGate devices’ status and resource utilization. This allows teams to spot patterns of gradual resource pressure before it leads to outages and prioritize remediation based on where it’s likely to have the most impact.
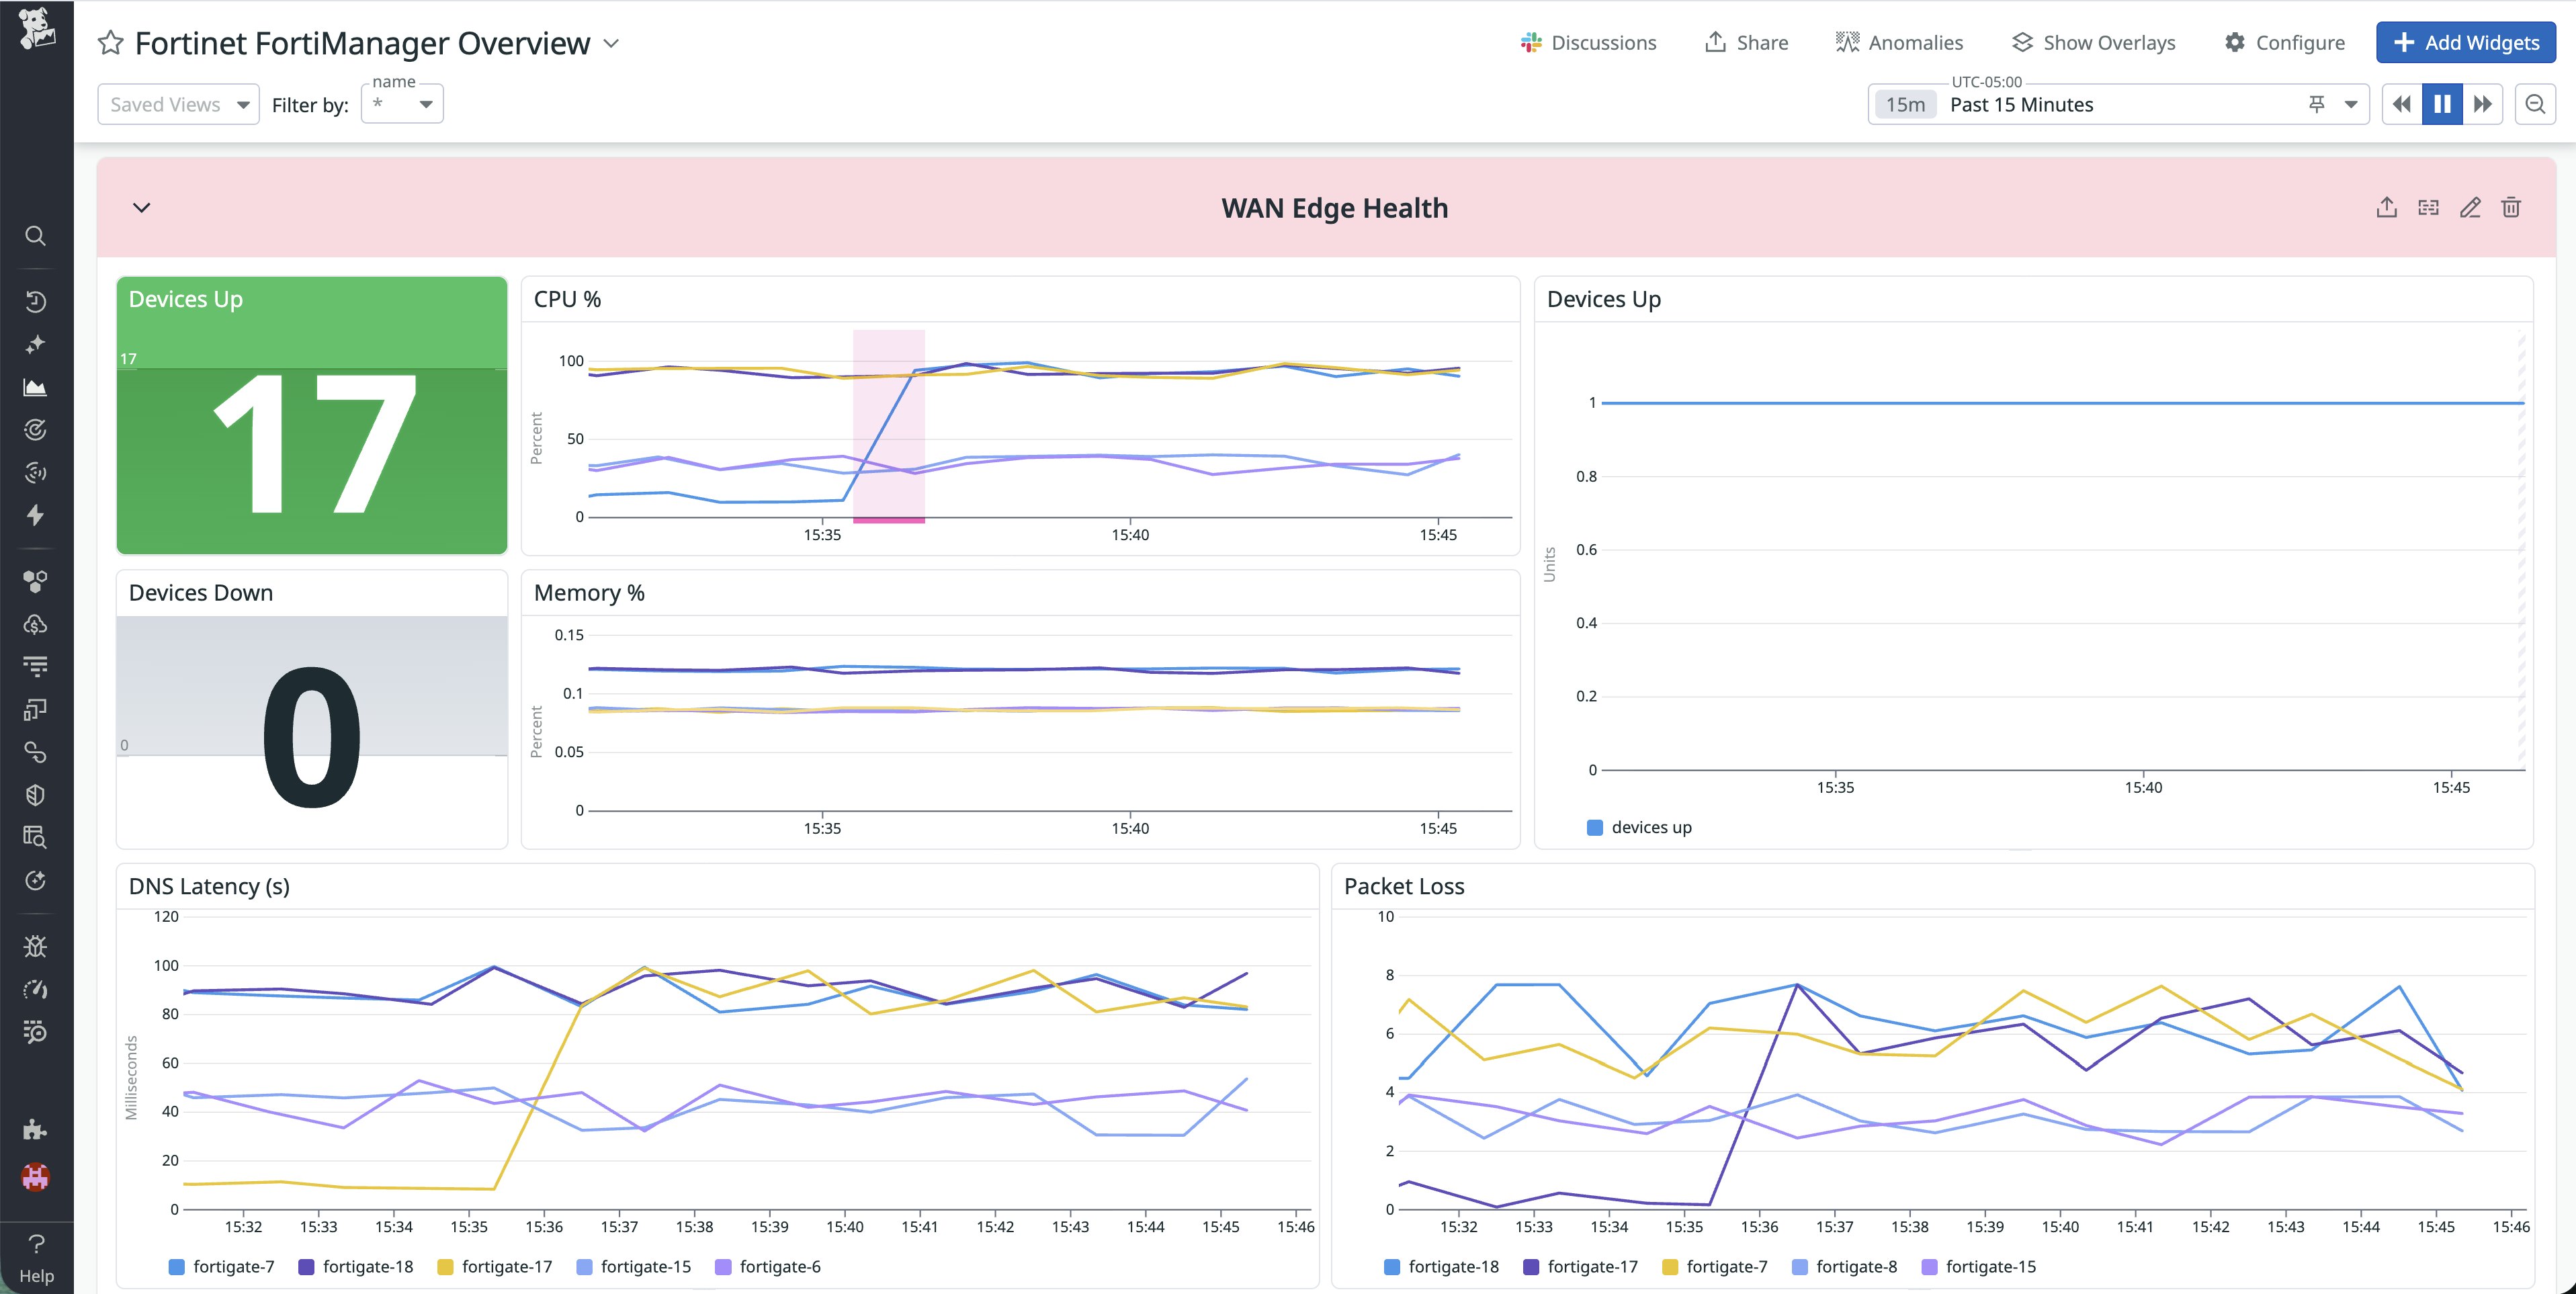
To understand how traffic is flowing through the branch, teams can also monitor metrics like RX/TX bandwidth, packet counts, and errors. Having this context makes it easier to determine whether a link is degraded or whether traffic is unevenly distributed across available paths. With that context, engineers can quickly decide whether to adjust SD-WAN policy, increase capacity, or replace failing hardware.
Understand application usage
Not every incident that looks like an issue with network performance truly originates in the network. A branch might be saturating a circuit because an application rollout increased payload sizes or a background process changed behavior. Without comprehensive visibility into applications, engineers can end up treating symptoms without addressing the underlying cause.
The FortiManager integration includes application and traffic visibility in an SD-WAN context, such as sessions and traffic volume by application category. This helps teams understand which classes of applications are driving WAN usage and whether that pattern matches expectations for a given site.
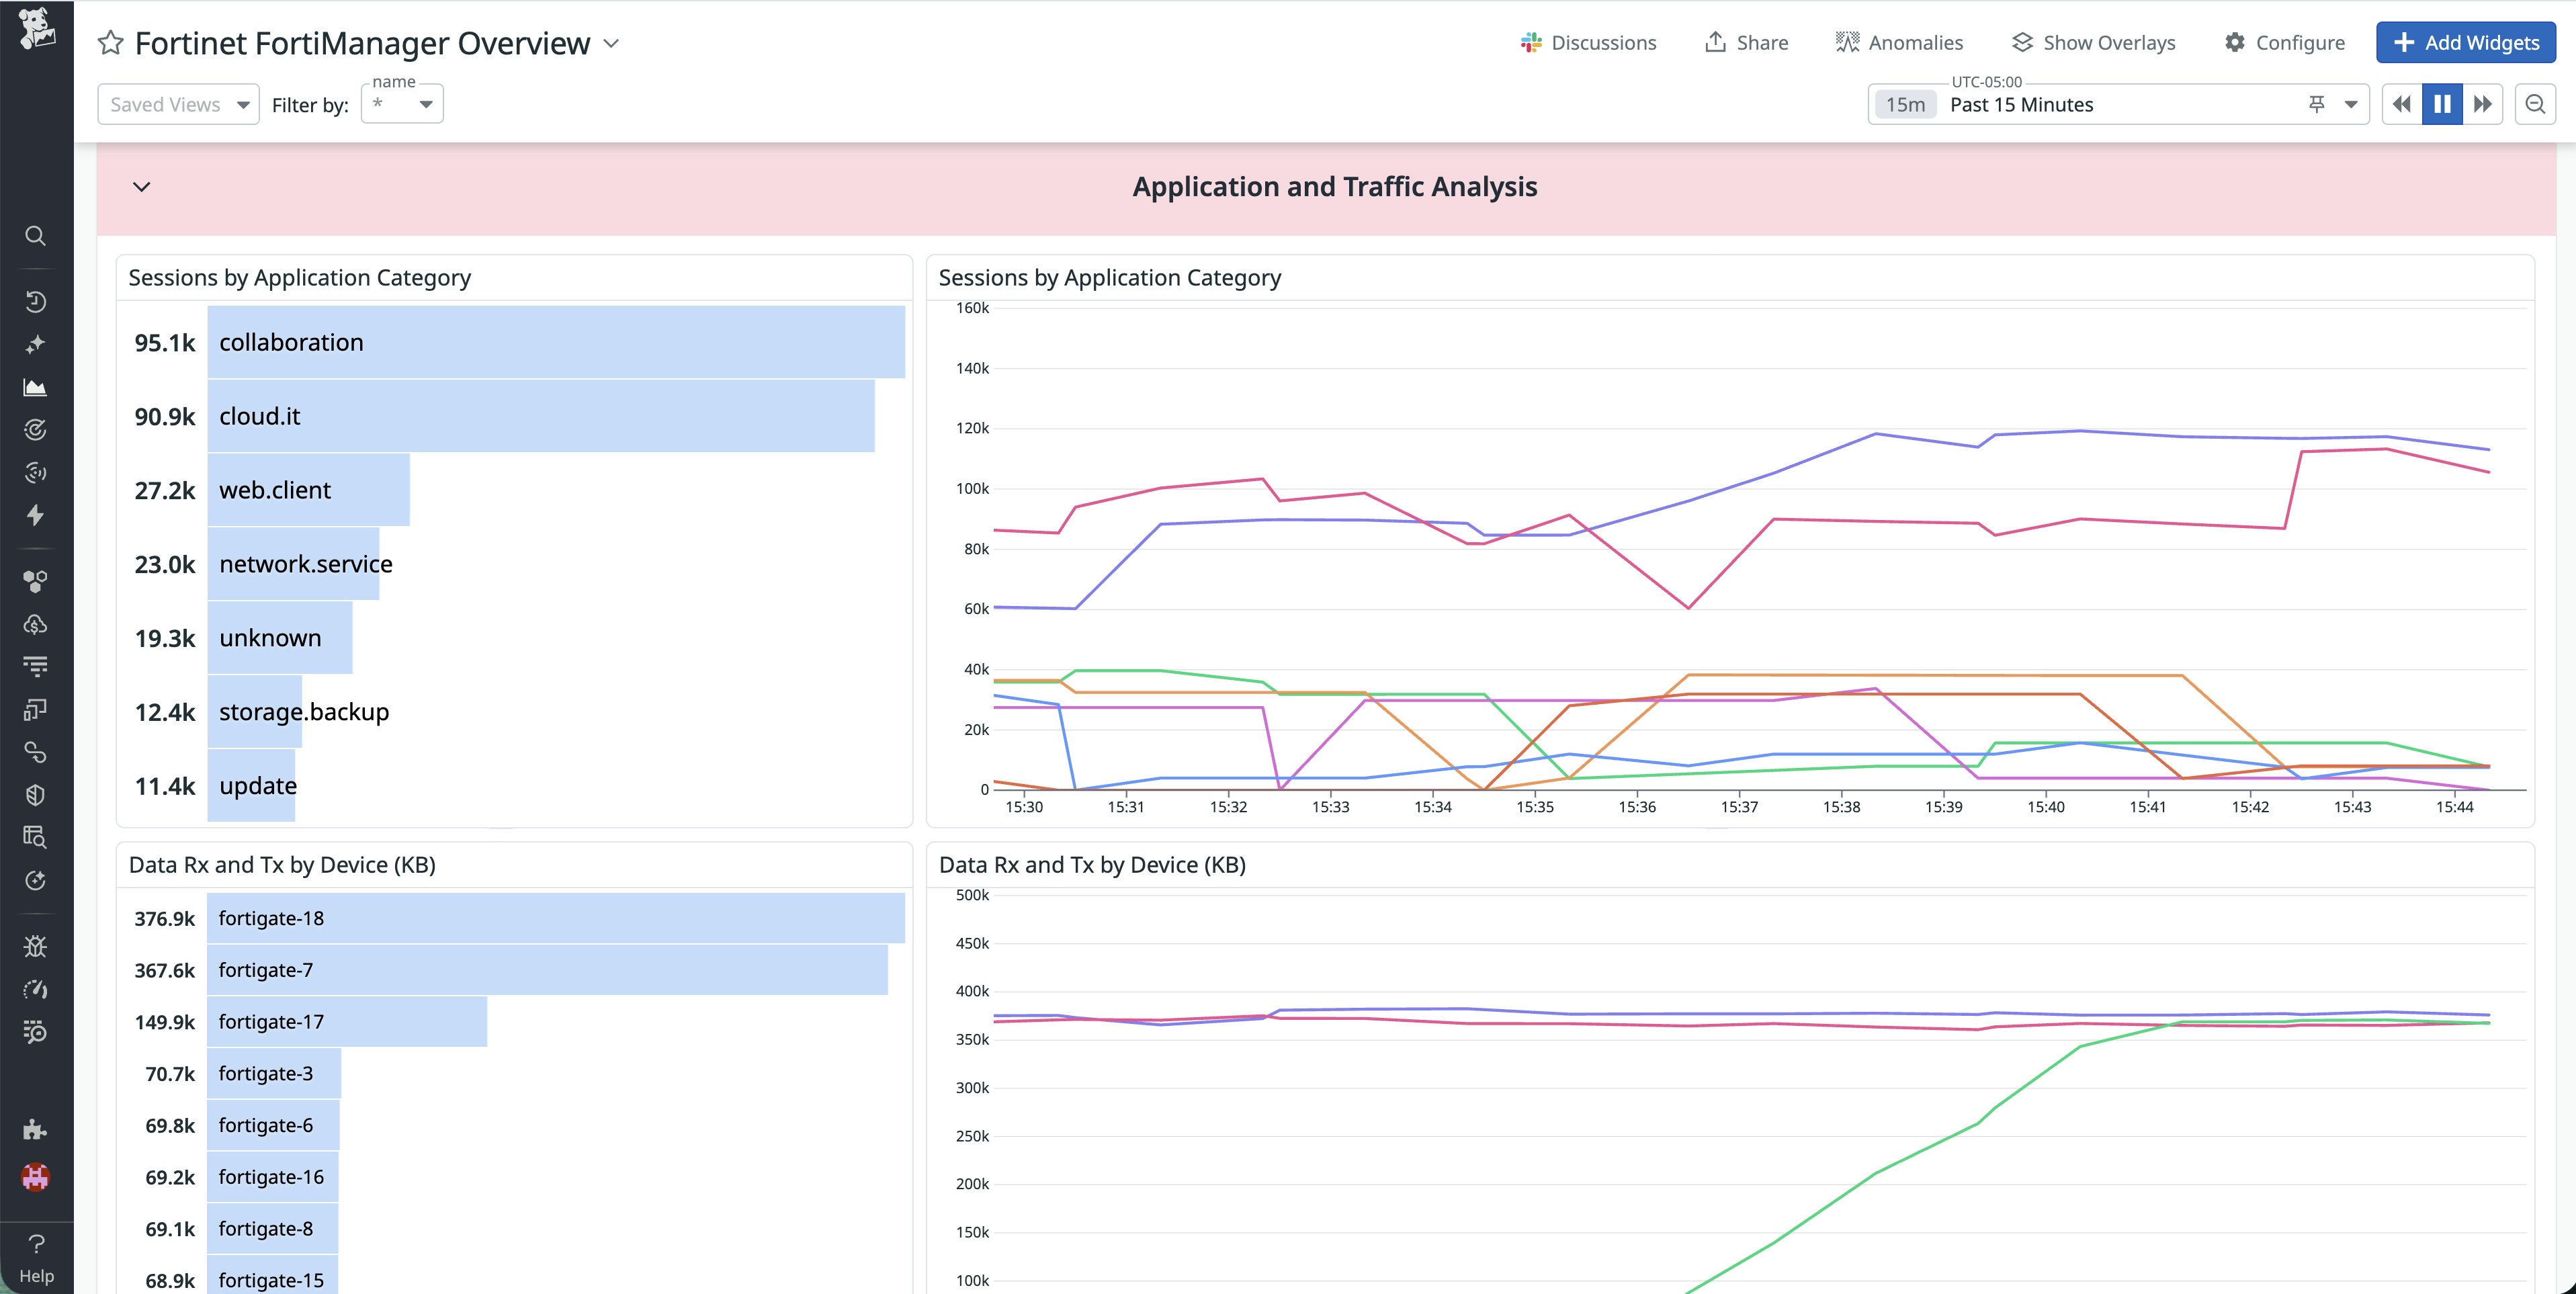
With this context in Datadog, troubleshooting is easier. For example, if packet loss increases while traffic in a particular category spikes across multiple branches, engineers can test clearer hypotheses. Did the traffic pattern change? Is policy routing that category over an unintended path? Or does the link no longer meet the SLA targets under load? By converging link-quality metrics, device health telemetry, and application usage in one place, teams can get to a root cause faster.
Get started with the FortiManager integration
Monitor SD-WAN performance end to end with the FortiManager integration by combining link-quality signals, FortiGate device health metrics, and application usage context in Datadog. With this visibility, teams can investigate incidents more efficiently and make informed decisions about routing policy, capacity planning, and branch reliability.
To get started, install the integration in Datadog, then follow the FortiManager documentation to configure it. If you’re new to Datadog, you can start a free 14-day trial.
