Nicholas Thomson
When troubleshooting an incident, DevOps teams often get bogged down searching for errors and unexpected events in an ever-increasing volume of logs. The painstaking nature of this work can result in teams struggling to resolve issues before new incidents appear, potentially leading to an incident backlog, longer MTTR, and a degraded end-user experience.
Zebrium leverages unsupervised machine learning to find correlated anomalies in your logs, thereby helping distributed teams quickly find the most useful root cause indicators in large volumes of complex log data. In a March 2022 study of 192 actual customer incidents, Cisco determined that Zebrium could correctly identify the root cause 95 percent of the time.
Datadog is pleased to announce that Zebrium now offers a data integration and Datadog app, available as a bundle through one tile on the Integrations page. You can now also purchase a subscription to Zebrium in the Datadog Marketplace, which is the first step in getting set up to stream data and alerts from Zebrium into Datadog. After you start a free trial or purchase a Zebrium subscription, the data integration component can send events and metrics about your logs and anomalies to Datadog. The app, in turn, can then populate a native Datadog dashboard widget that enriches any of your new or existing dashboards with root cause information from Zebrium. Joint Zebrium-Datadog customers can use this new functionality to instantly determine root causes without ever needing to dig through logs, thereby improving incident response workflow and reducing resolution times.
Expedite troubleshooting
Say you are a DevOps engineer for an organization that runs an e-commerce site built on Amazon EKS. In your EKS dashboard, you notice that network traffic and CPU utilization in the cluster have dropped to zero. Because your EKS dashboard tracks metrics across all your different services, you might be uncertain about where to start investigating the issue. However, the Zebrium widget can help by automatically flagging the potential root cause of the problem. The screenshot below displays your EKS dashboard in this example scenario. The dashboard shows that the Zebrium Root Cause Finder widget has automatically flagged a malicious agent (here called Chaos Monkey) as the potential root cause of the issue.
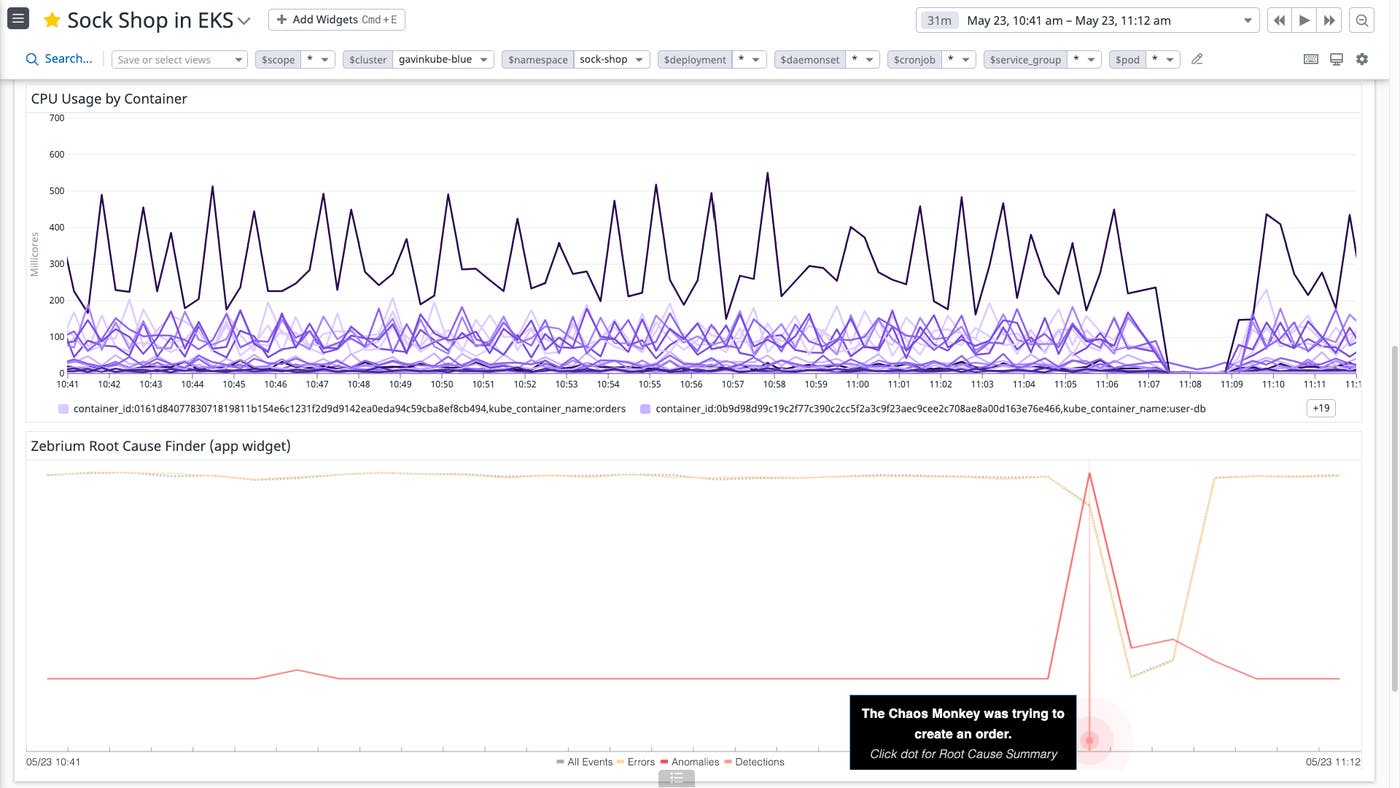
You can see a Natural Language Processing (NLP) summary by hovering over the alert (the red dot) in the Zebrium Root Cause Finder. Clicking on the alert shows a word cloud that helps communicate the nature of the issue by highlighting the most common terms found in log entries associated with the incident.
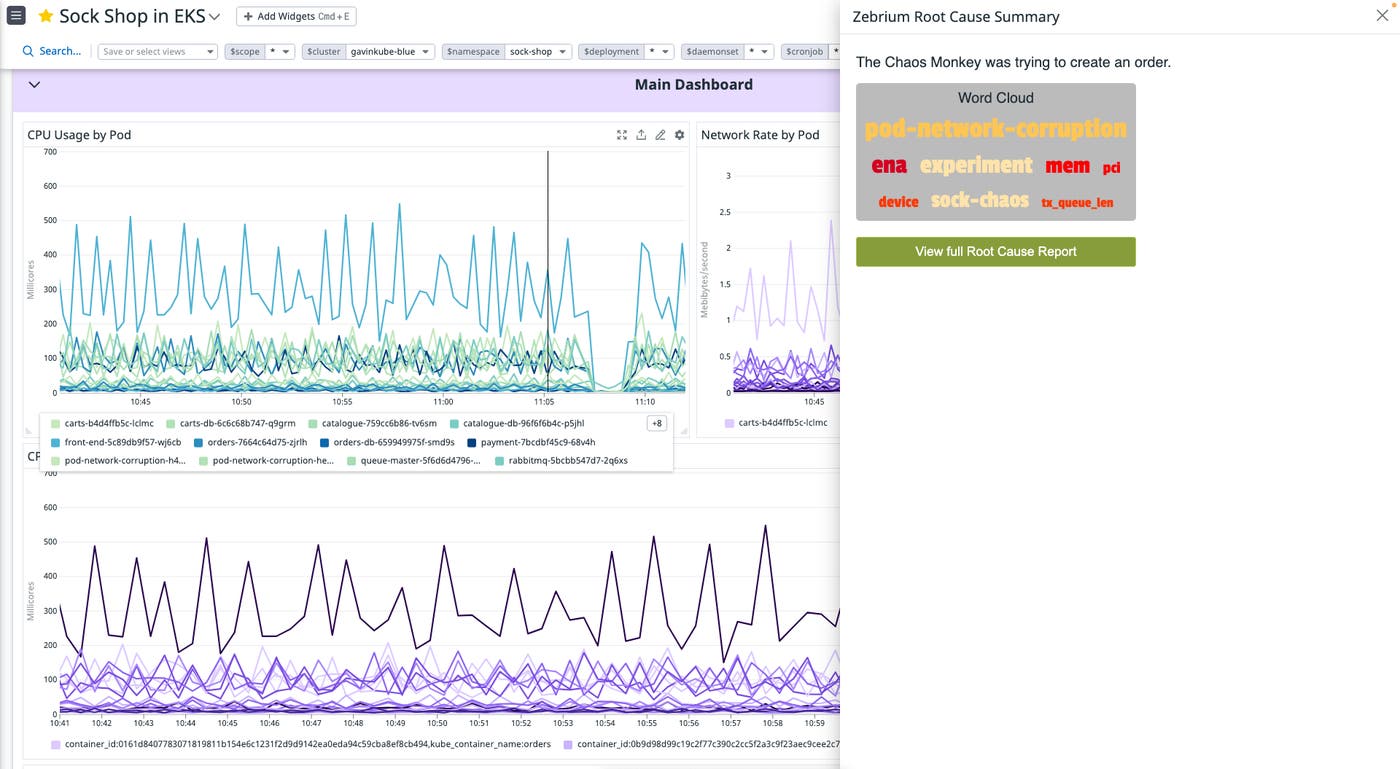
For even more information about the root cause, you can click on View full Root Cause Report. This step opens a full root cause report on the Zebrium site, an example of which is shown in the image below. From the millions of log entries generated by your application while the failure was occurring, Zebrium has surfaced 46 events from seven different services to tell the story of the incident.
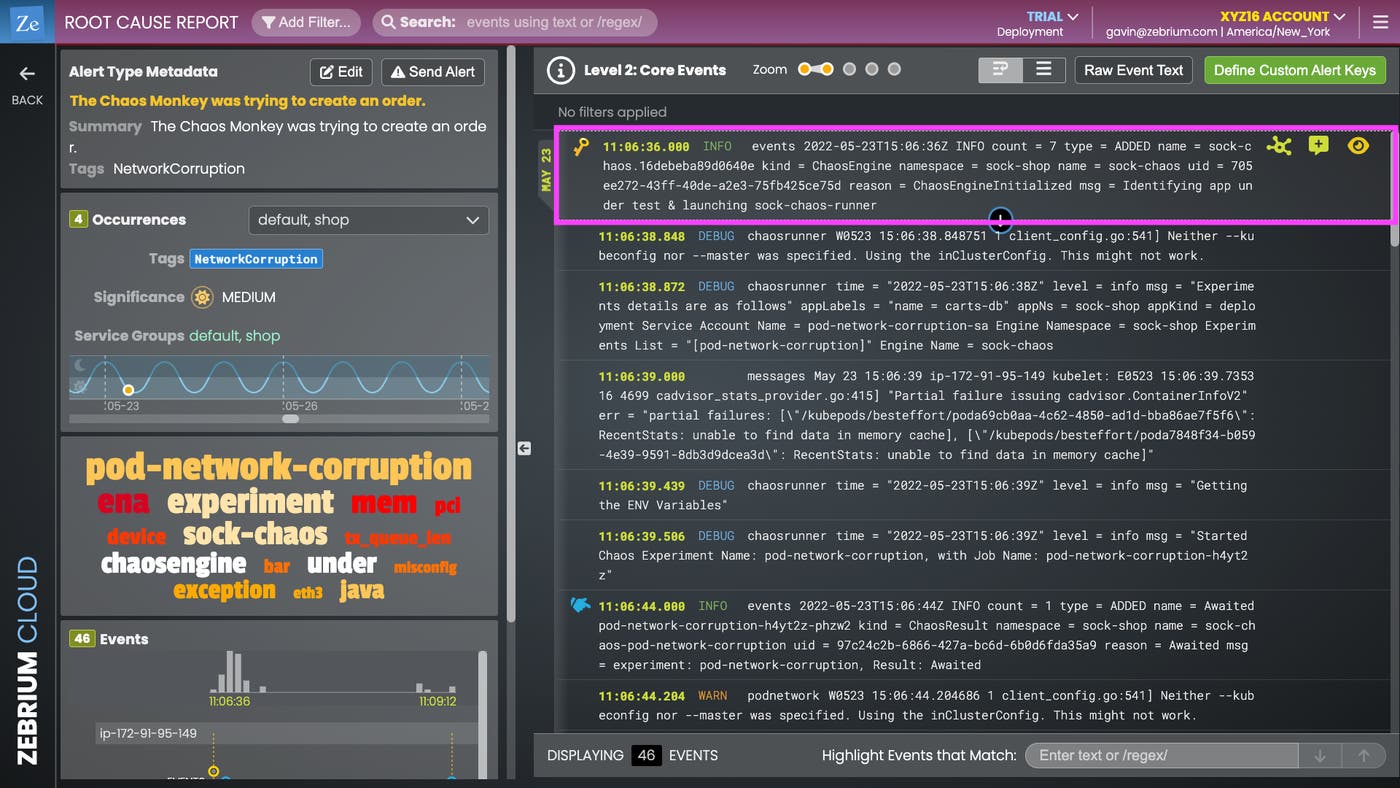
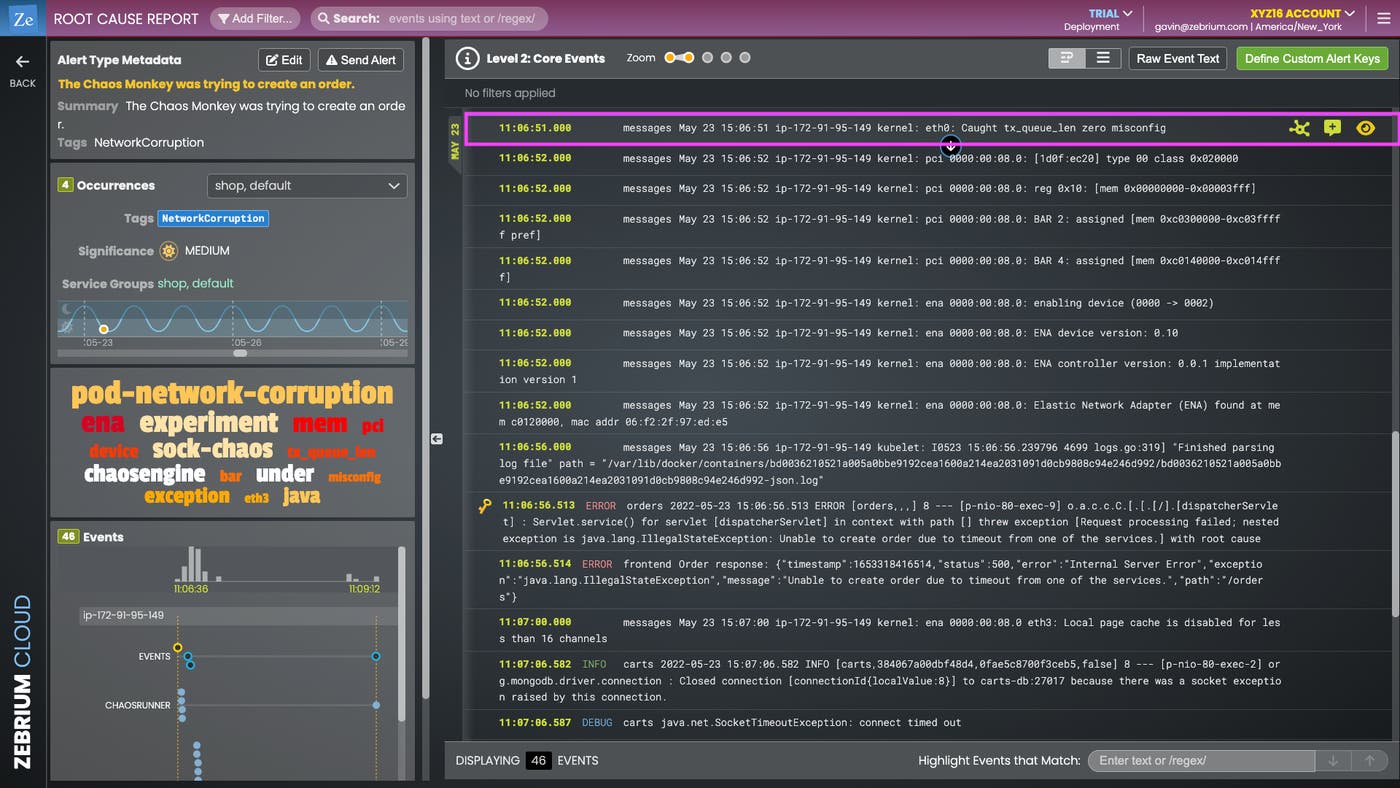
After following the link to the full root cause report, you can confirm that Chaos Monkey is indeed the root cause of the issue. Specifically, the chaos agent set off a cascading chain of events by kicking off a pod-network-corruption chaos experiment, which ultimately resulted in a queue length misconfiguration on eth0. You can see the evidence of this misconfiguration in the log entry that is highlighted and magnified below. This cause-and-effect sequence would have been very difficult for an engineer to piece together by manually searching through the logs without the help of Zebrium.

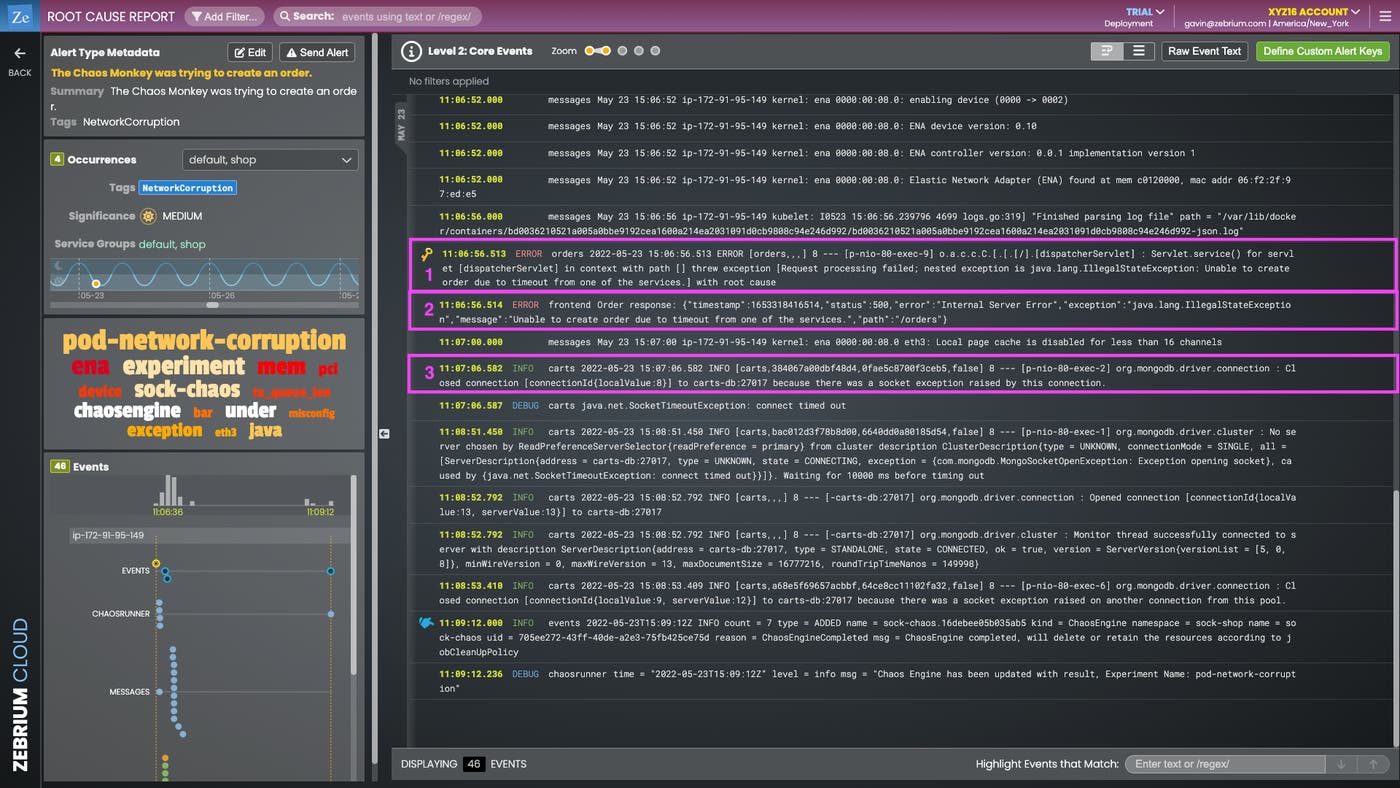
Zebrium also pulls out error messages and other log entries that highlight the impacts (symptoms) of the incident on your e-commerce application. For example, we can see the following symptoms in the root cause report below:
- A timeout in the order service
- A 500 error in the frontend service
- And a socket exception in the carts service
As a DevOps engineer in our scenario, without even needing to search through the logs, you’ve been able to use Datadog’s Zebrium App to pinpoint the root cause behind the issue of zero network traffic and CPU utilization in your Kubernetes cluster. And you identified this root cause without having created any predefined rules or having performed any manual ML training on datasets beforehand.
Speed up root cause analysis with Zebrium and Datadog
The Zebrium app and integration give you tools to easily find root causes while you’re working within Datadog, thereby expediting your troubleshooting and reducing MTTR. The Zebrium integration and app are now available on the Integrations page, and the software license needed to enable the Zebrium app and widget can be purchased in the Datadog Marketplace. To get up and running, sign up for a free trial in the Datadog Marketplace. If you’re new to Datadog, sign up for a 14-day free trial.
The ability to promote branded monitoring tools in the Datadog Marketplace is one of the benefits of membership in the Datadog Partner Network. If you’re interested in developing an integration or application for the Datadog Marketplace, contact us at marketplace@datadog.com.
