Tal Usvyatsky
Comprehensive observability is critical for running performant, reliable, and secure serverless workloads. However, configuring and maintaining that visibility across hundreds or thousands of serverless functions can be difficult to scale and sustain.
Developers across teams often manage serverless functions using different infrastructure as code (IaC) frameworks, as well as different review, deployment, and update processes. Instrumenting each of these environments separately requires ramping up new codebases, coordinating across teams, and repeating new setup steps whenever instrumentation updates are released.
This complexity makes it difficult to ensure consistent coverage during major releases or critical incidents. In these situations, missing or outdated instrumentation can obscure critical telemetry and delay remediation. Although on-demand instrumentation could help close these gaps, it is often too manual and time-consuming to deploy effectively when needed most.
In this post, we’ll show you how to:
- Instrument Lambda functions in the Datadog UI
- Select Lambda functions to instrument
- Configure instrumentation settings for specific functions
- See instrumentation in minutes
Instrument Lambda functions in the Datadog UI
For development teams managing Lambda functions across different frameworks and deployment processes, Datadog now offers a centralized way to enable consistent monitoring across your organization.
The remote instrumentation flow in Datadog provides a single interface for managing your AWS Lambda functions. You can enable and manage instrumentation entirely through the Datadog UI without requiring code updates or additional reviews.
To get started, set up the AWS integration from the Integrations page in Datadog. Once your AWS accounts appear in the Datadog, launch the remote instrumenter CloudFormation stack in each region where you want to use remote instrumentation. This stack creates the resources necessary for remote instrumentation in your account, including a remote instrumenter Lambda function that Datadog uses to apply instrumentation across other functions.
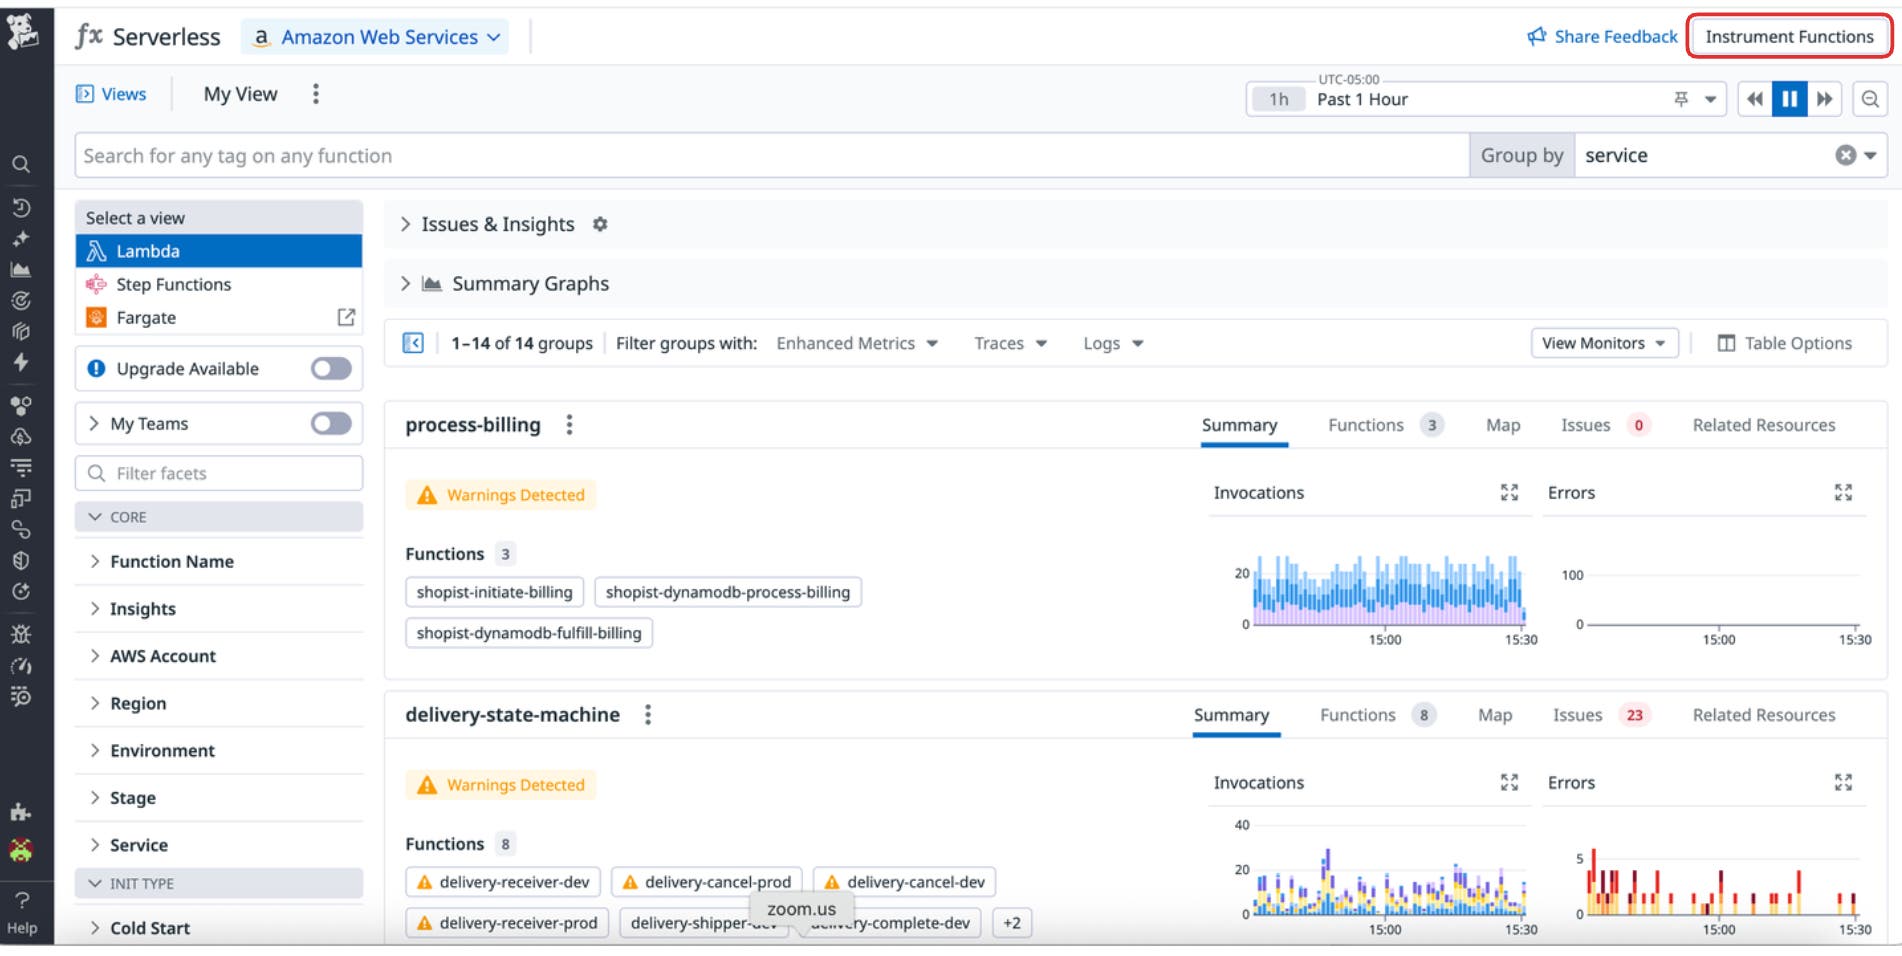
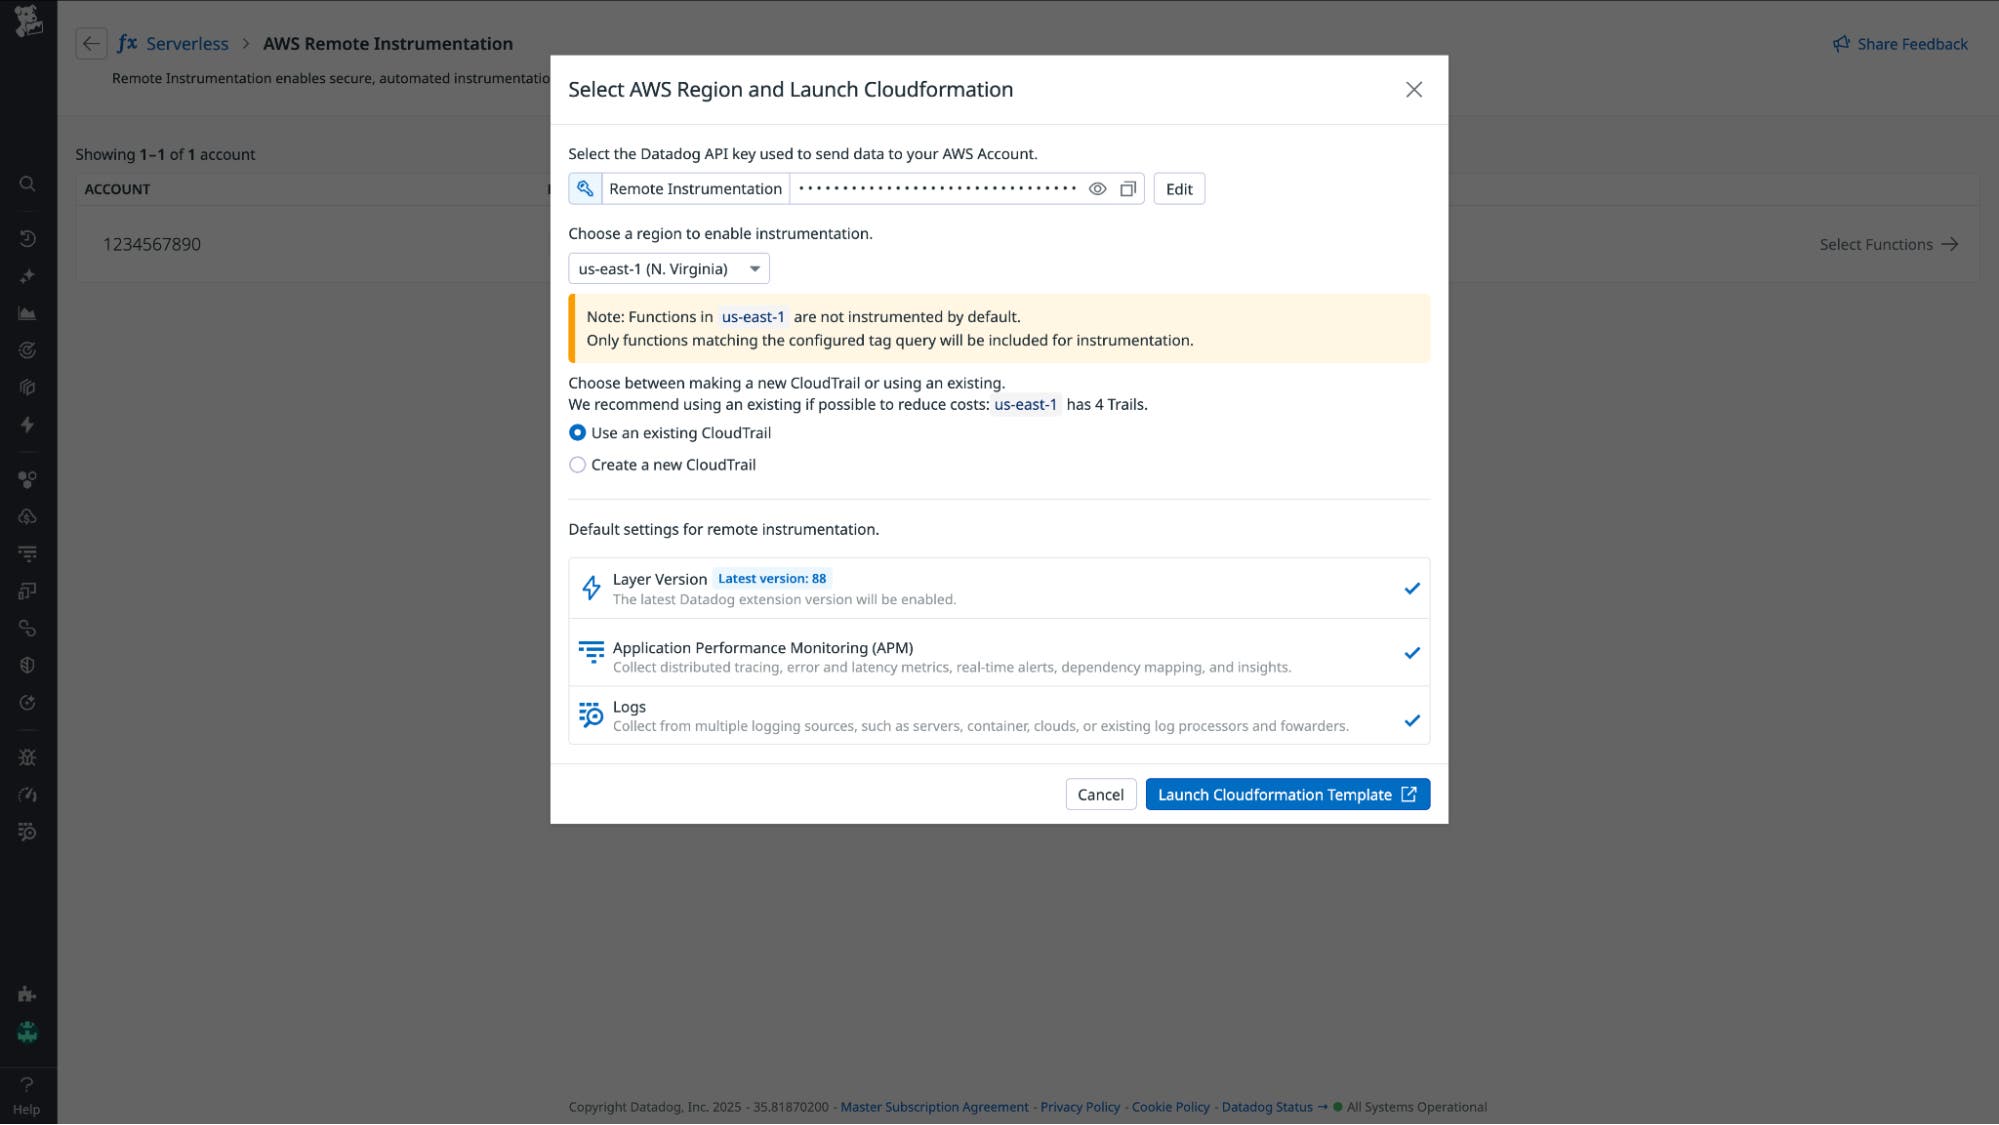
The remote instrumenter Lambda automatically instruments your functions, reinstruments them when they’re redeployed, and applies instrumentation to any new functions that match your existing instrumentation preferences.
Select Lambda functions to instrument
After deploying the remote instrumenter, you can view all available AWS Lambda functions across your connected accounts in Datadog. This includes functions managed by other teams, services, IaC frameworks, and deployment pipelines, giving you a complete view of what’s running in your AWS environment.
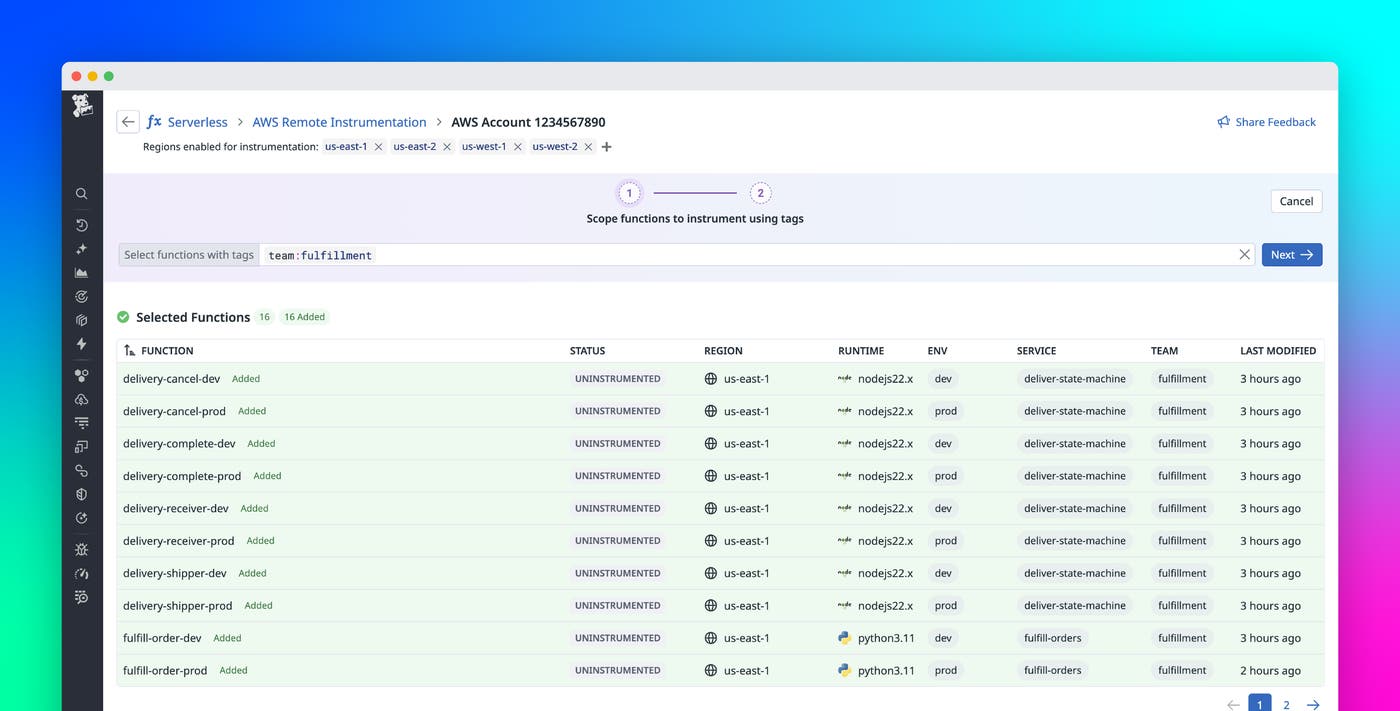
You can select multiple Lambda functions to instrument at once using function name, tags in DD_TAGS, or AWS tags. For example, you can target all functions for a specific service with tags such as service:my-service. Tag-based selection allows you to apply instrumentation consistently across teams and automatically include new functions that share the same tags.
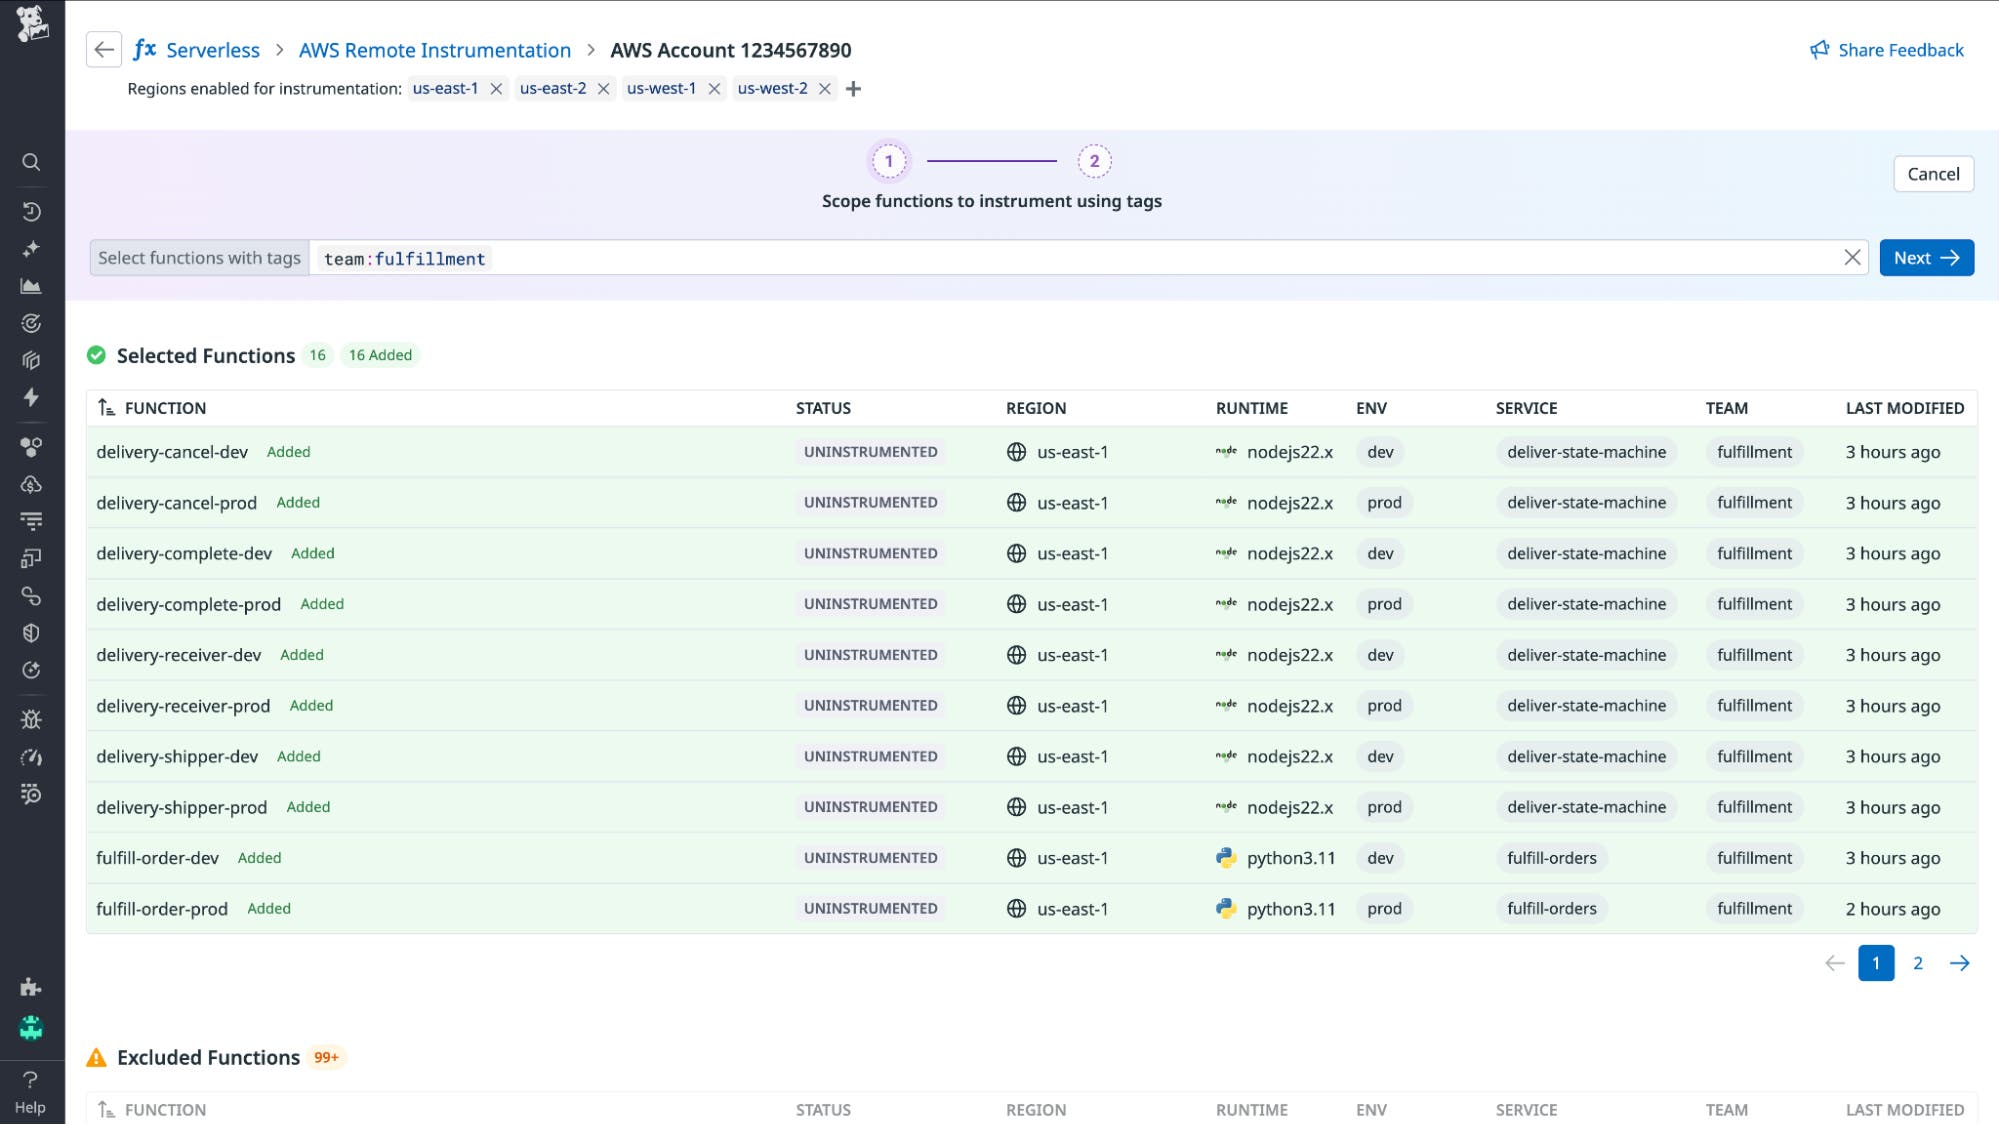
Once you’ve chosen the functions you want to instrument, select Next to review and confirm your selections before configuring settings for tracing, logging, and layers.
Configure instrumentation settings for specific functions
After selecting the functions you want to instrument, you can review and select available configuration options in Datadog. On the Instrumentation Settings page, select the layer versions for your Lambda functions. You can then enable or disable tracing and logging before saving your configuration.
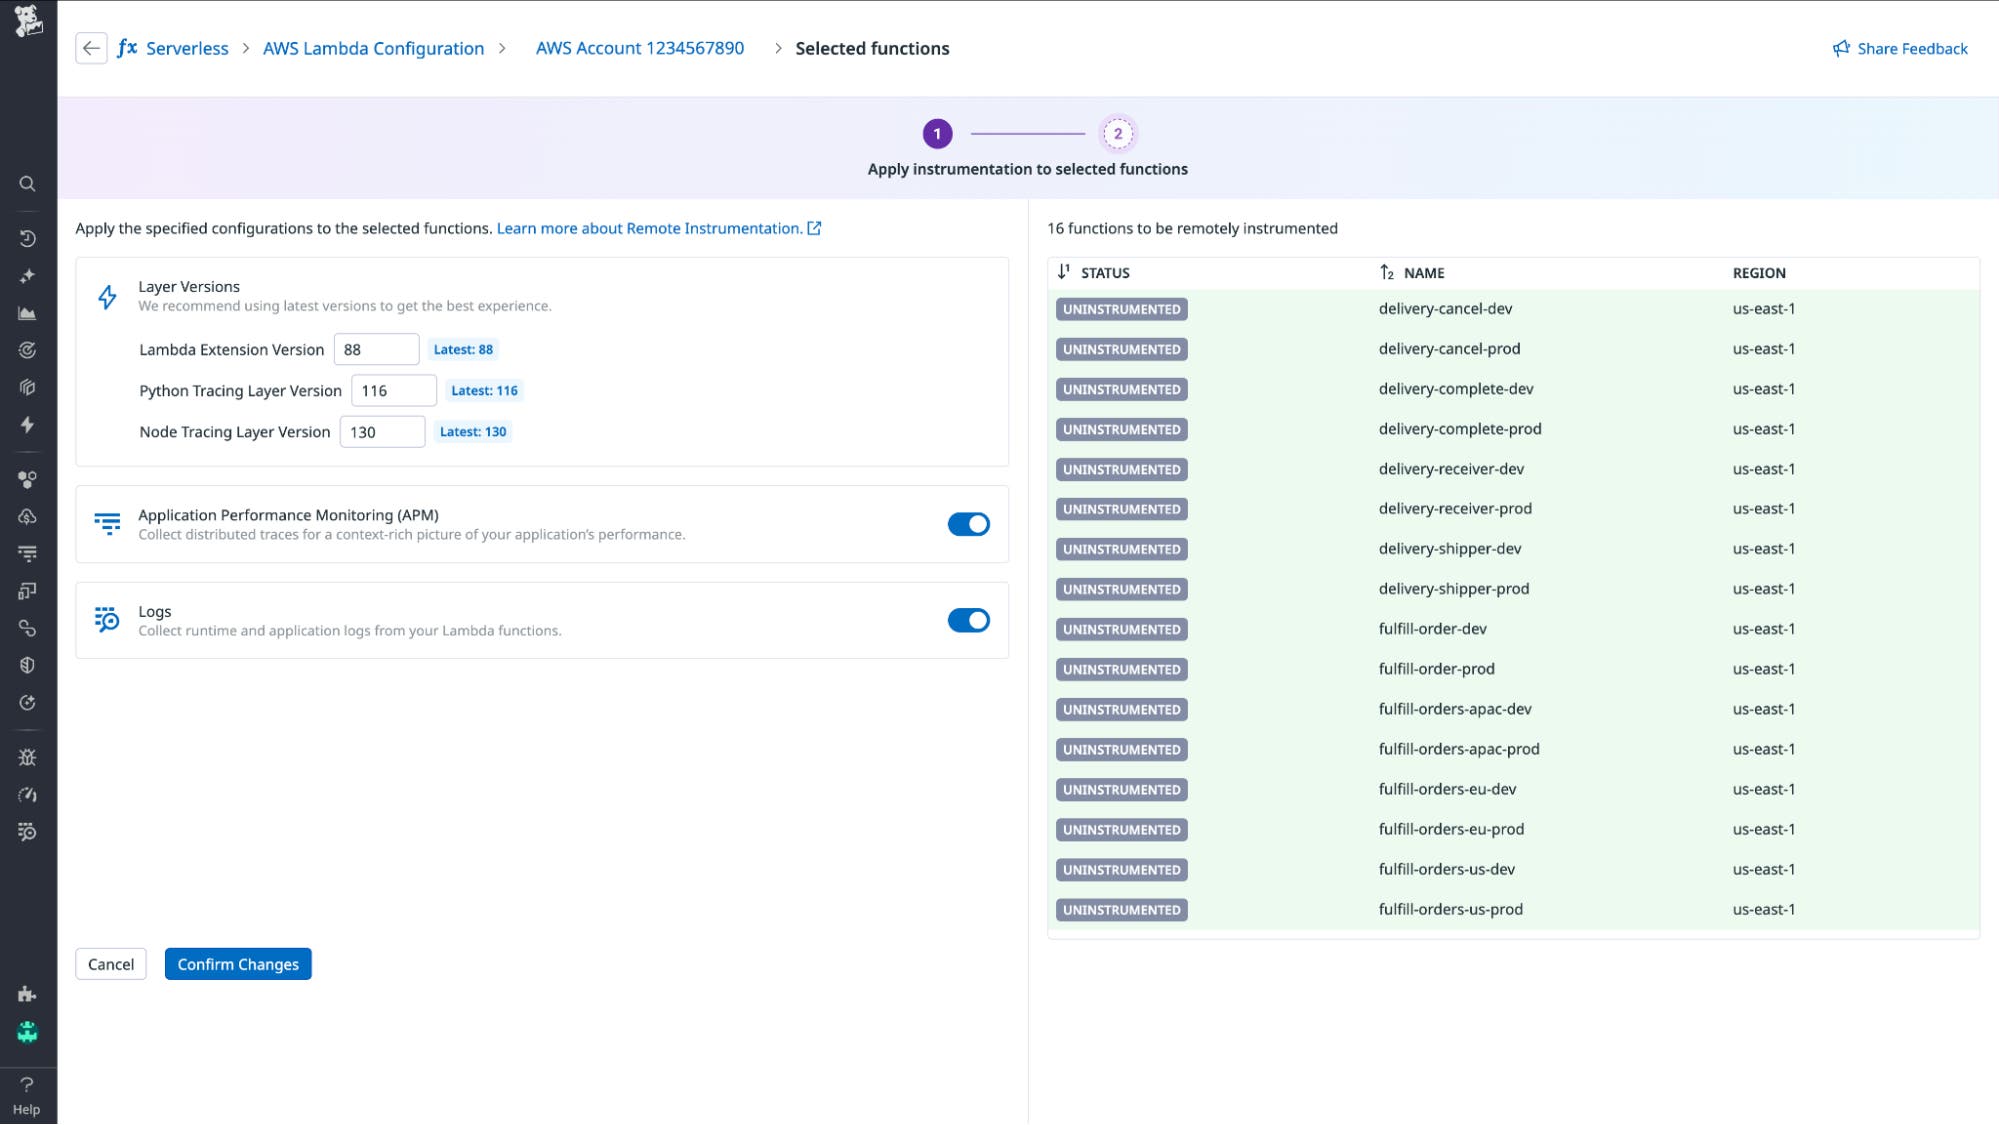
You can then return to the Instrumentation Settings page at any time to keep your configurations up to date. For example, you might want to update layers or adjust tracing and logging options during releases, incidents, or routine maintenance to ensure your Lambda functions continue to send complete and accurate telemetry to Datadog.
See results within minutes
After saving your configuration, the remote instrumenter Lambda applies your settings to the selected functions. Within a few minutes, their instrumentation status updates in Datadog, and telemetry from those functions begins to flow automatically.
New Lambda functions that match your configuration rules are instrumented as they’re created, to help keep your environment continuously monitored with no additional setup.
Learn more
With Datadog remote instrumentation for AWS Lambda, teams no longer have to choose between speed and visibility. Each function can stay monitored, traced, and ready for production troubleshooting by default, ensuring data is always available when issues arise.
Remote instrumentation for AWS Lambda is now generally available from the Serverless Monitoring page in Datadog. For more information on how to get started, check out our documentation. If you’re not already a Datadog customer, sign up for a free 14-day trial today.
