

Yair Cohen

Mallory Mooney
Running Kubernetes applications requires visibility into not only the overall performance of clusters but also the health of individual pods , deployments , and other resources that make up your environment. Datadog already integrates with your containerized environments and includes features like the Live Container view and the Container Map, enabling you to easily monitor Kubernetes and container runtime performance in real time for better visibility into clusters.
We’ve enhanced our existing functionality to provide a multidimensional look into your Kubernetes workloads from within our Live Containers view. Live Containers now offers curated views for your Kubernetes applications, so you can look at performance data in its appropriate context and surface critical information about every layer of your Kubernetes clusters. You can monitor the state of pods or deployments in a specific namespace or availability zone, view the resource specifications for a failed pod within a deployment, correlate node activity with related logs, and more.
Search and investigate any Kubernetes resource
Kubernetes environments consist of several object types that describe the resources available to run and operate workloads, and you need the ability to see into every object to troubleshoot issues efficiently. While Live Containers always provided information about individual containers, it now gives you real-time views into all your orchestration’s objects, with additional insights into their overall health. For instance, the Clusters view displays the state of your Kubernetes clusters, including their resource usage and the number of nodes and pods running on them. This overview can serve as a starting point for understanding how each object in your cluster is performing.

Live Containers also lets you use Datadog tags and Kubernetes labels to filter and group your Kubernetes resources, so that you can easily surface performance issues, regardless of the size of your environment. In the example below, we’re drilling down to the pods managed by a specific team, and further grouping them by application. With this more focused view, we can easily assess the state of our Kubernetes applications (e.g., how many pods are pending or have failed?) and address any issues before they become more serious.

Dive deeper into a Kubernetes resource for further investigation
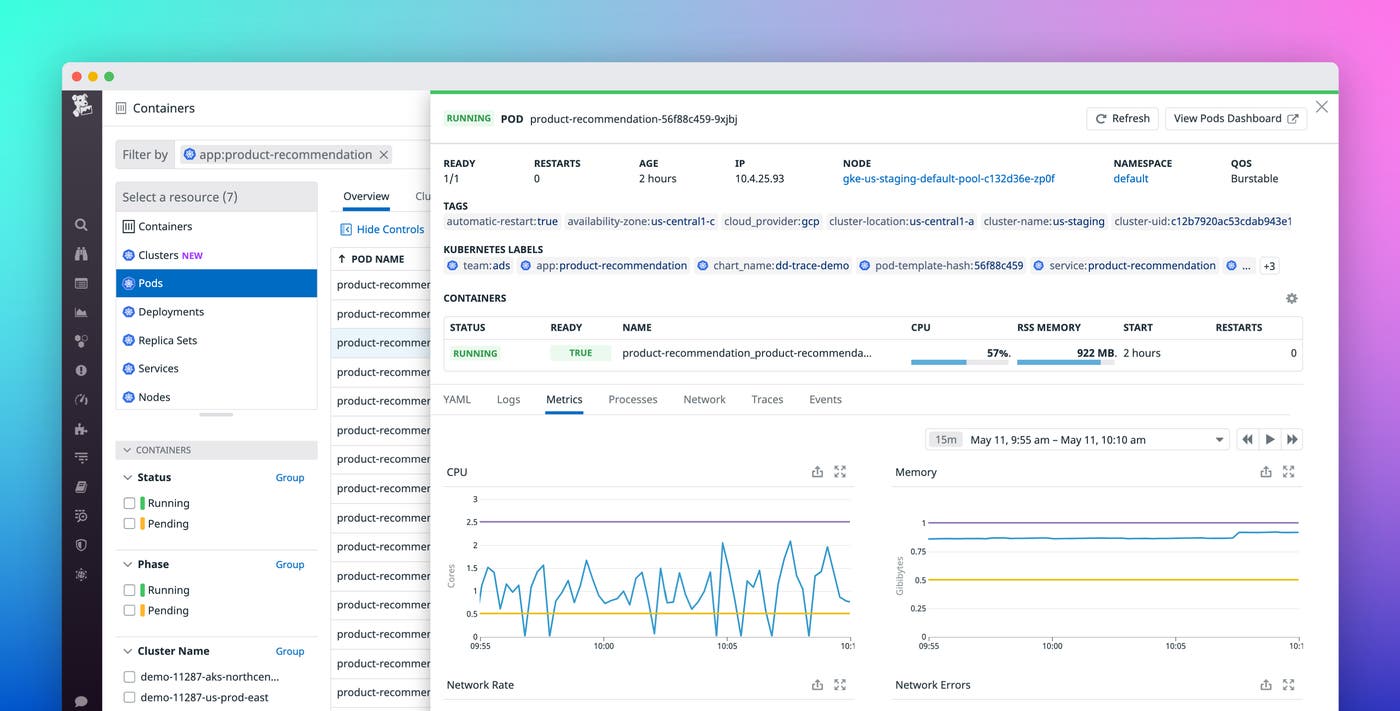
Live Containers has an easy-to-use interface that is tightly integrated with the rest of the Datadog platform, so you can get highly detailed context for each of your Kubernetes resources. For example, you can search for a specific deployment and use the context menu to drill down to the list of pods managed by this deployment. From this list, you can select an individual pod to view a breakdown of its constituent containers and monitor related events, running processes, traces, logs, network flows, and other important metrics—all in a single view. Each panel includes a searchable “YAML” tab, which shows state and configuration data similar to output from the kubectl describe command.

You can search for terms directly in this tab or select one of the primary YAML fields under the search bar to automatically jump to the Kubernetes object you need for reviewing the state of your resources. For instance, you can select the status field to see if a pod is running, pending, or has been terminated. This enables you to troubleshoot critical startup issues (e.g., a pod failing readiness probes) and easily identify costly, underutilized pods or nodes so you can adjust your deployments accordingly.
Visualize your Kubernetes clusters with the Cluster Map
In addition to providing deep visibility into individual resources, Datadog includes a Cluster Map to give you a 30,000-foot view of your entire Kubernetes environment, so you can review the state of all of your deployments and pods at a glance. For example, you can view all pods for a specific cluster, grouped by namespace. If there is an issue, such as the kubelet evicting too many pods, the Cluster Map automatically will highlight the problematic pods in light blue, as seen below.

If you notice that several pods are failing to spin up within a specific cluster, it could be a sign that the cluster needs more resources or that your deployment is misconfigured. You can click on any affected pod in the map to open its overview panel and troubleshoot further.
Monitor resource usage and more for every layer of your Kubernetes application
If you need to view more details about the state of your Kubernetes objects, you can use one of the Kubernetes Overview dashboards, where you’ll get a high-level overview of critical performance data such as the CPU and memory usage of your pods, changes in deployment replicas, and the condition of your nodes and services.

You can access these dashboards from your dashboard list, or you can easily pivot from an overview panel in Live Containers to a dedicated dashboard that’s automatically filtered with the appropriate tags, similar to host dashboards for individual containers. For example, if you notice that several pods are failing for a specific deployment, you can quickly jump to the pods dashboard to investigate the root cause.

Pods may fail if they use more memory or CPU than their defined limits—or if they have poorly-configured limits. You can use the pods dashboard to visualize CPU and memory usage and determine if there were unexpected spikes within a specific timeframe that lead to the failure.
Start monitoring your Kubernetes environments today
With Datadog, you can monitor every layer of your Kubernetes environment—from clusters down to individual pods. Check out our documentation for collecting cluster metrics to get started or learn how you can begin monitoring more of your Kubernetes resources today. And if you don’t already have a Datadog account, you can sign up for a free trial.


