Khayyam Guliyev

Duarte Nunes

Ming Chen

Justin Jaffray
As Datadog continues to scale, the volume, complexity, and cardinality of the metrics we ingest and store steadily grow by orders of magnitude. This growth pushes the boundaries of our core timeseries database—the internal system responsible for storing raw metric data and serving it to customer queries in real time. As with any system facing growing traffic, over time, we encounter new performance challenges, especially under high-cardinality workloads, increasingly complex queries, and bursty traffic patterns.
Designing a new storage engine is never a decision to take lightly. It’s a deeply complex undertaking with far-reaching implications for performance, reliability, and operational risk. So we always push the existing system as far as we can while building the next generation. But as data volumes and customer demands keep rising, even those optimizations only take us so far. We always need to reimagine our architecture—rethinking ingestion, storage, and query execution from the ground up to keep pace with our growth. What follows is a description of the 6th generation in a lineage that started 15 years ago.
The result is a new system—a real-time timeseries database purpose-built in Rust for high throughput and low latency. In this post, we’ll walk through how we designed it, the engineering decisions we made along the way, and how we achieved a 60x increase in ingestion performance and 5x faster queries at peak scale.
Overview of Datadog’s metrics platform
Datadog’s metrics platform consists of multiple subsystems—including ingestion and enrichment pipelines, real-time and long-term storage, and query and alerting services. We covered data flow and query semantics in a previous blog post. The diagram below outlines the high-level architecture; each subsystem is complex and comes with its own performance constraints and optimization trade-offs. In this post, we will focus on real-time storage—specifically, the timeseries storage engine.
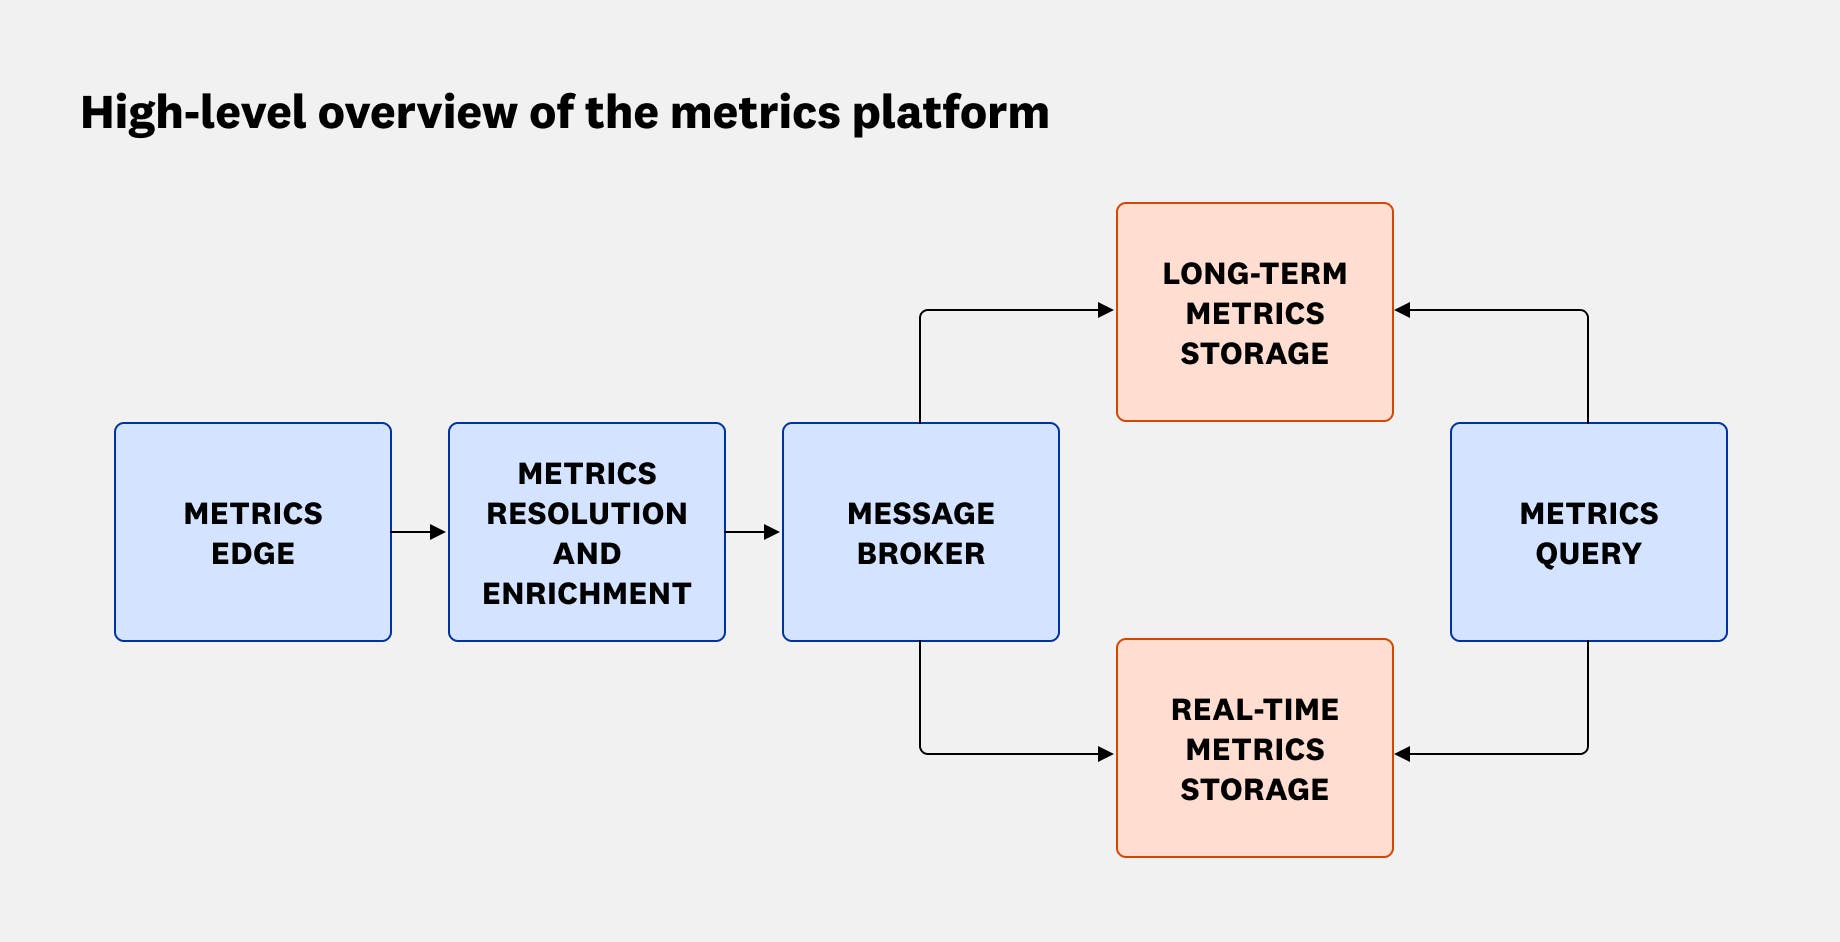
One key aspect of our timeseries storage engine’s design is that its real-time storage is split into two independently deployed services:
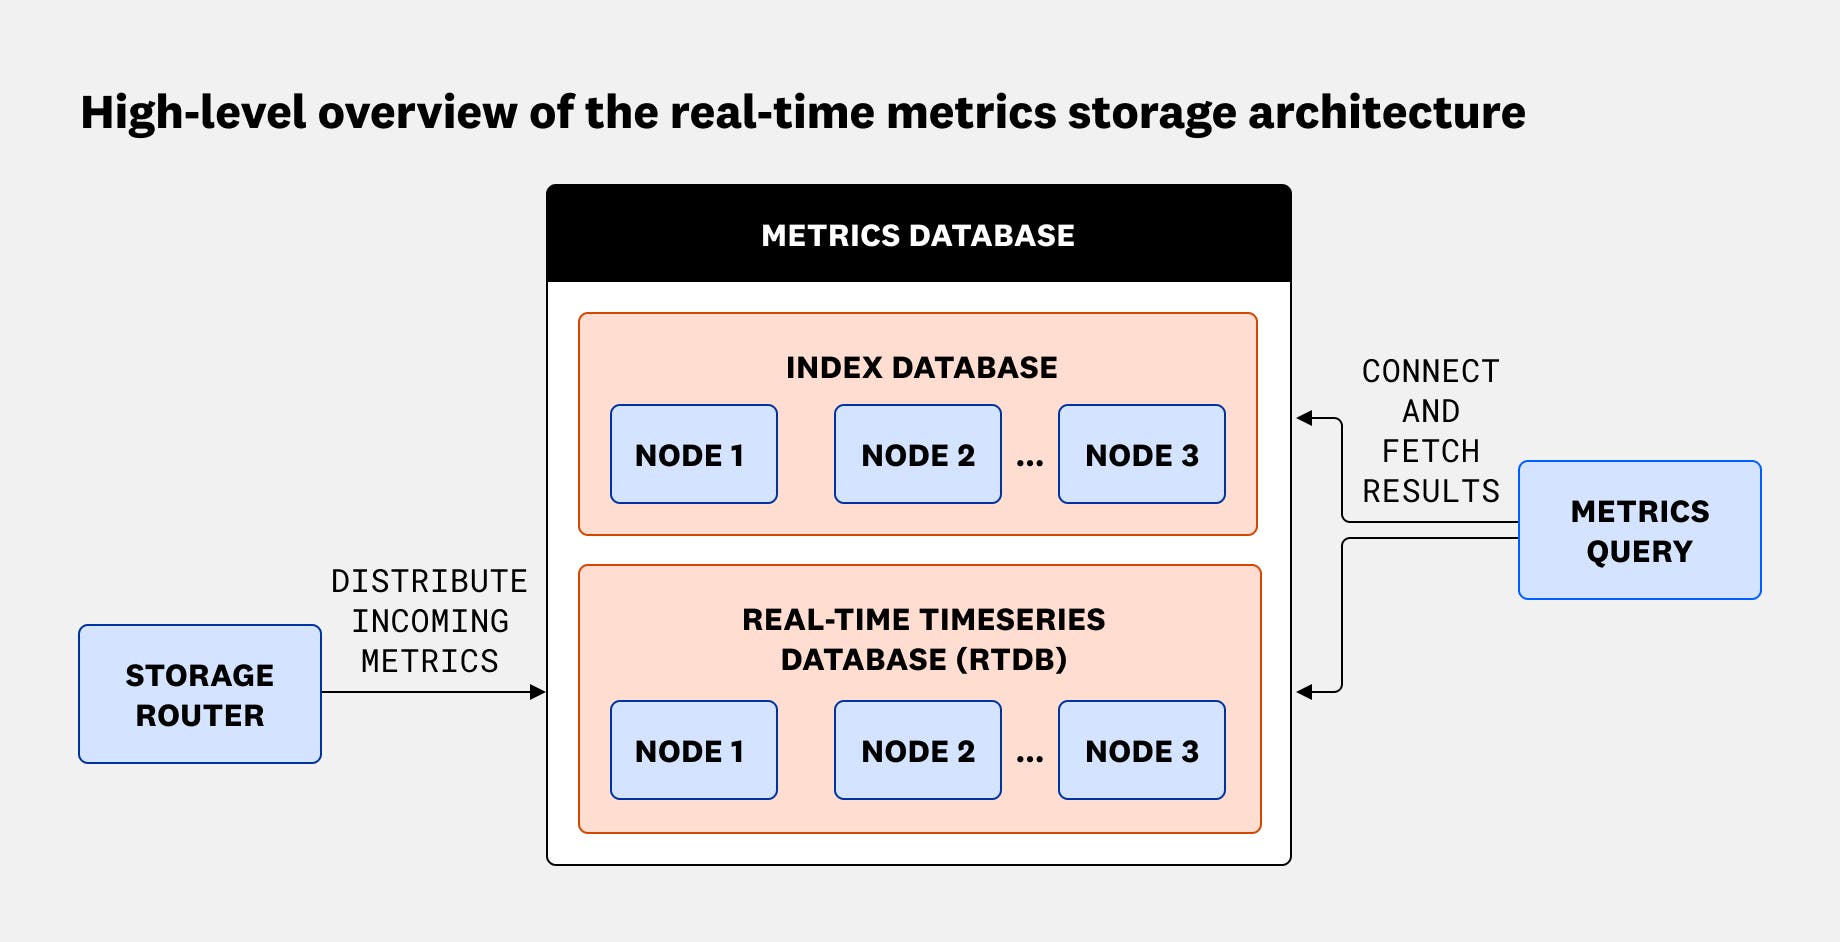
- RTDB: A real-time timeseries database that stores raw metric data as tuples of
<timeseries_id, timestamp, value>, aggregates, and serves the most recent metrics data - Index database: A database that manages the metric identifiers and their tags, storing them as tuples of
<timeseries_id, tags>
Upstream, the storage router distributes incoming metrics across RTDB nodes based on load. Downstream, the metrics query service uses the router’s information to connect to the appropriate RTDB nodes and indexing nodes, fetch results from each, and combine them. This architecture is illustrated in the following diagram:
When a query arrives at an RTDB node, it comes as a list of groups. Each group specifies a set of timeseries IDs to aggregate into a single output timeseries using the same time range and aggregation settings as the overall query. The RTDB node looks up all relevant timeseries for those keys, performs the requested group-by aggregations over the time range, and returns the results to the metrics query service.
As the following diagram shows, an RTDB node is a complex system made up of several key components working in concert:
- Intake subsystem for ingesting incoming data
- Storage engine for writing and reading data
- Snapshot module for data durability
- Query (GRPC) execution layer for retrieving data
- Throttlers for managing resource usage under load
These components operate under a shared control plane within the node, which orchestrates their interactions and provides management interfaces.
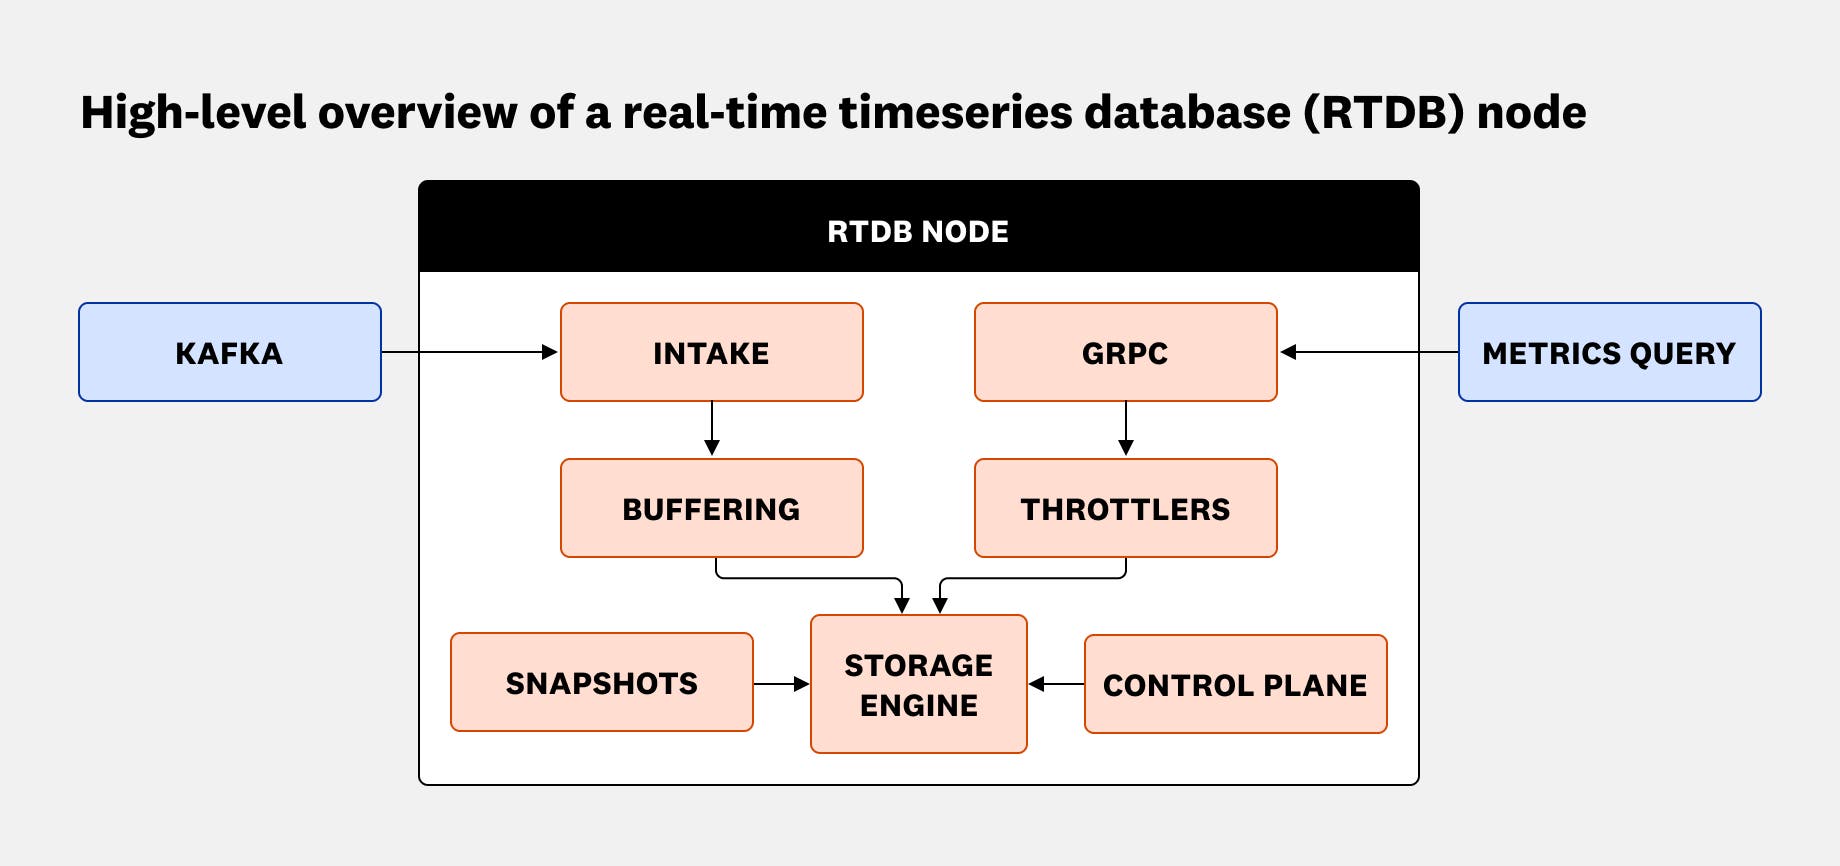
Next, we’ll walk through how our storage engine evolved and how these pieces came together in the current system.
How we built the 6th generation of our real-time metrics storage
Gen 1: Cassandra for fast writes, limited query flexibility
Our first-generation system was built on Cassandra, inspired by systems like OpenTSDB and others running on HBase, which was widely adopted at the time. It gave us strong write scalability and a familiar operational model, but it quickly became clear that the system couldn’t support the breadth or complexity of real-time queries we needed for alerting and analysis. It also struggled with returning large datasets efficiently.
These limitations led to our second generation, built on Redis.
Gen 2: Redis for fast reads and operational control
Redis brought a major step forward: it was fast, flexible, and easy to reason about, and it served us well for several years. But it came with engineering tradeoffs. We chose not to rely on Redis’s built-in clustering for reliability, so we had to manage many independent instances ourselves. Redis’s single-threaded nature also limited our ability to snapshot data for durability while serving live traffic.
We also encountered rare but severe failure modes, typically related to memory management and threading under load. Additionally, the constant (de)serialization and cross-boundary communication introduced cost and performance inefficiencies—and because Redis wasn’t optimized for memory layout, disk I/O, or CPU usage, these operations became increasingly expensive at scale.
Still, Redis gave us valuable operational visibility and shaped our understanding of what we’d need in a purpose-built system—one with tighter integration, full control over I/O, and better efficiency across the stack.
Gen 3: MDBM for efficient memory-mapped I/O
Our next storage engine was built on MDBM, a memory-mapped key–value store. This design leveraged the operating system’s page cache via mmap to load database pages on demand, effectively treating on-disk data as in-memory structures. This approach served us well early on by simplifying our storage interactions. However, as our usage grew more intense, it began to hit performance limitations for both reads and writes.
Published research has shown that relying on memory-mapped I/O in database systems can introduce subtle performance and correctness issues. In fact, many systems that initially used mmap eventually switched to managing I/O explicitly after encountering these challenges. Our experience was similar: although MDBM’s simplicity was a strength, its performance did not scale to meet our largest workloads.
Gen 4: A Go-based B+ tree for scalable performance
To meet our largest workload demands, we replaced MDBM with a custom-built B+ tree storage engine written in Go. This was our first step toward a thread-per-core execution model, which Go’s scheduler supported reasonably well. The shift brought major performance improvements in both throughput and latency, and gave us a foundation we could optimize more aggressively as our needs evolved.
Gen 5: Introducing distribution metrics and RocksDB
In parallel, we introduced the DDSketch data type to support distribution metrics, allowing customers to estimate percentiles accurately. However, our Go-based engine was optimized for scalar floats and not easily extendable to this new data type. To support sketches efficiently, we integrated RocksDB as the storage engine for DDSketch data, leveraging its flexibility and high performance.
Why we needed a unified engine
Over time, we found ourselves running two parallel timeseries databases: one for scalar metrics, and another for distribution metrics. While both systems worked well individually, they brought extra complexity, duplicated effort, and divergent performance characteristics. By then, we had gained enough operational experience with both systems to define a clearer set of requirements—and the confidence to unify them into a single, more capable platform.
Gen 6: A unified Rust-based engine for throughput, simplicity, and scale
To consolidate these systems, we built a new timeseries database from scratch in Rust. The language gave us low-level control and performance without sacrificing safety, and we had already seen strong results with Rust in other parts of our infrastructure.
A secondary goal was modularity: we wanted to structure the new system in reusable components that other teams could use across Datadog.
At its core, our new RTDB employs a log-structured merge tree (LSM tree) architecture. LSM trees are a natural fit for write-heavy workloads like ours—they buffer writes in memory and periodically flush sorted files to disk.
We also embraced early sharding, not just for storage, but across the entire system. Each unit of data—identified by a timeseries key—is assigned to a shard, which is a self-contained unit responsible for a portion of the keyspace. We use a simple hashing scheme—for example, taking a portion of the key’s bits—to consistently map keys to shards. This design impacts everything:
- Ingestion pipelines are sharded: We ingest and process data in parallel per partition.
- Caches are sharded: Each shard manages its own cache of hot data.
- Storage files: Each shard writes to its own files.
- Query processing is sharded: Each shard can execute queries for its subset of timeseries in parallel, then partial results are aggregated.
Why sharding across layers matters
Sharding at this level ensures even load distribution across all CPU cores, keeping both ingestion and query traffic balanced and leading to more consistent performance under heavy load. High-cardinality data naturally spreads out, avoiding hot spots. Within each shard, simpler concurrency models eliminate cross-thread synchronization, reducing complexity and potential bottlenecks.
Each shard operates almost like a single-tenant system. An interesting side effect of this design is that query patterns influence parallelism. Broad queries spanning many timeseries utilize all shards and improve throughput, while narrow queries target only a few shards. Thanks to even distribution, contention remains minimal even in worst-case scenarios.
Designing for high-throughput ingestion
In our deployment, we run storage shards on dedicated CPU cores. For example, on a 32-core machine, we might dedicate 24 cores to storage shards, reserving the remaining cores for other tasks like data intake and query coordination.
As shown in the following diagram, RTDB’s intake pipeline is implemented with asynchronous Rust tasks using Tokio. We spawn N intake workers (one per Kafka partition) and M storage shards (typically one per core). Each intake worker continually reads a stream of incoming data and routes those metrics to the appropriate storage shard using message-passing.
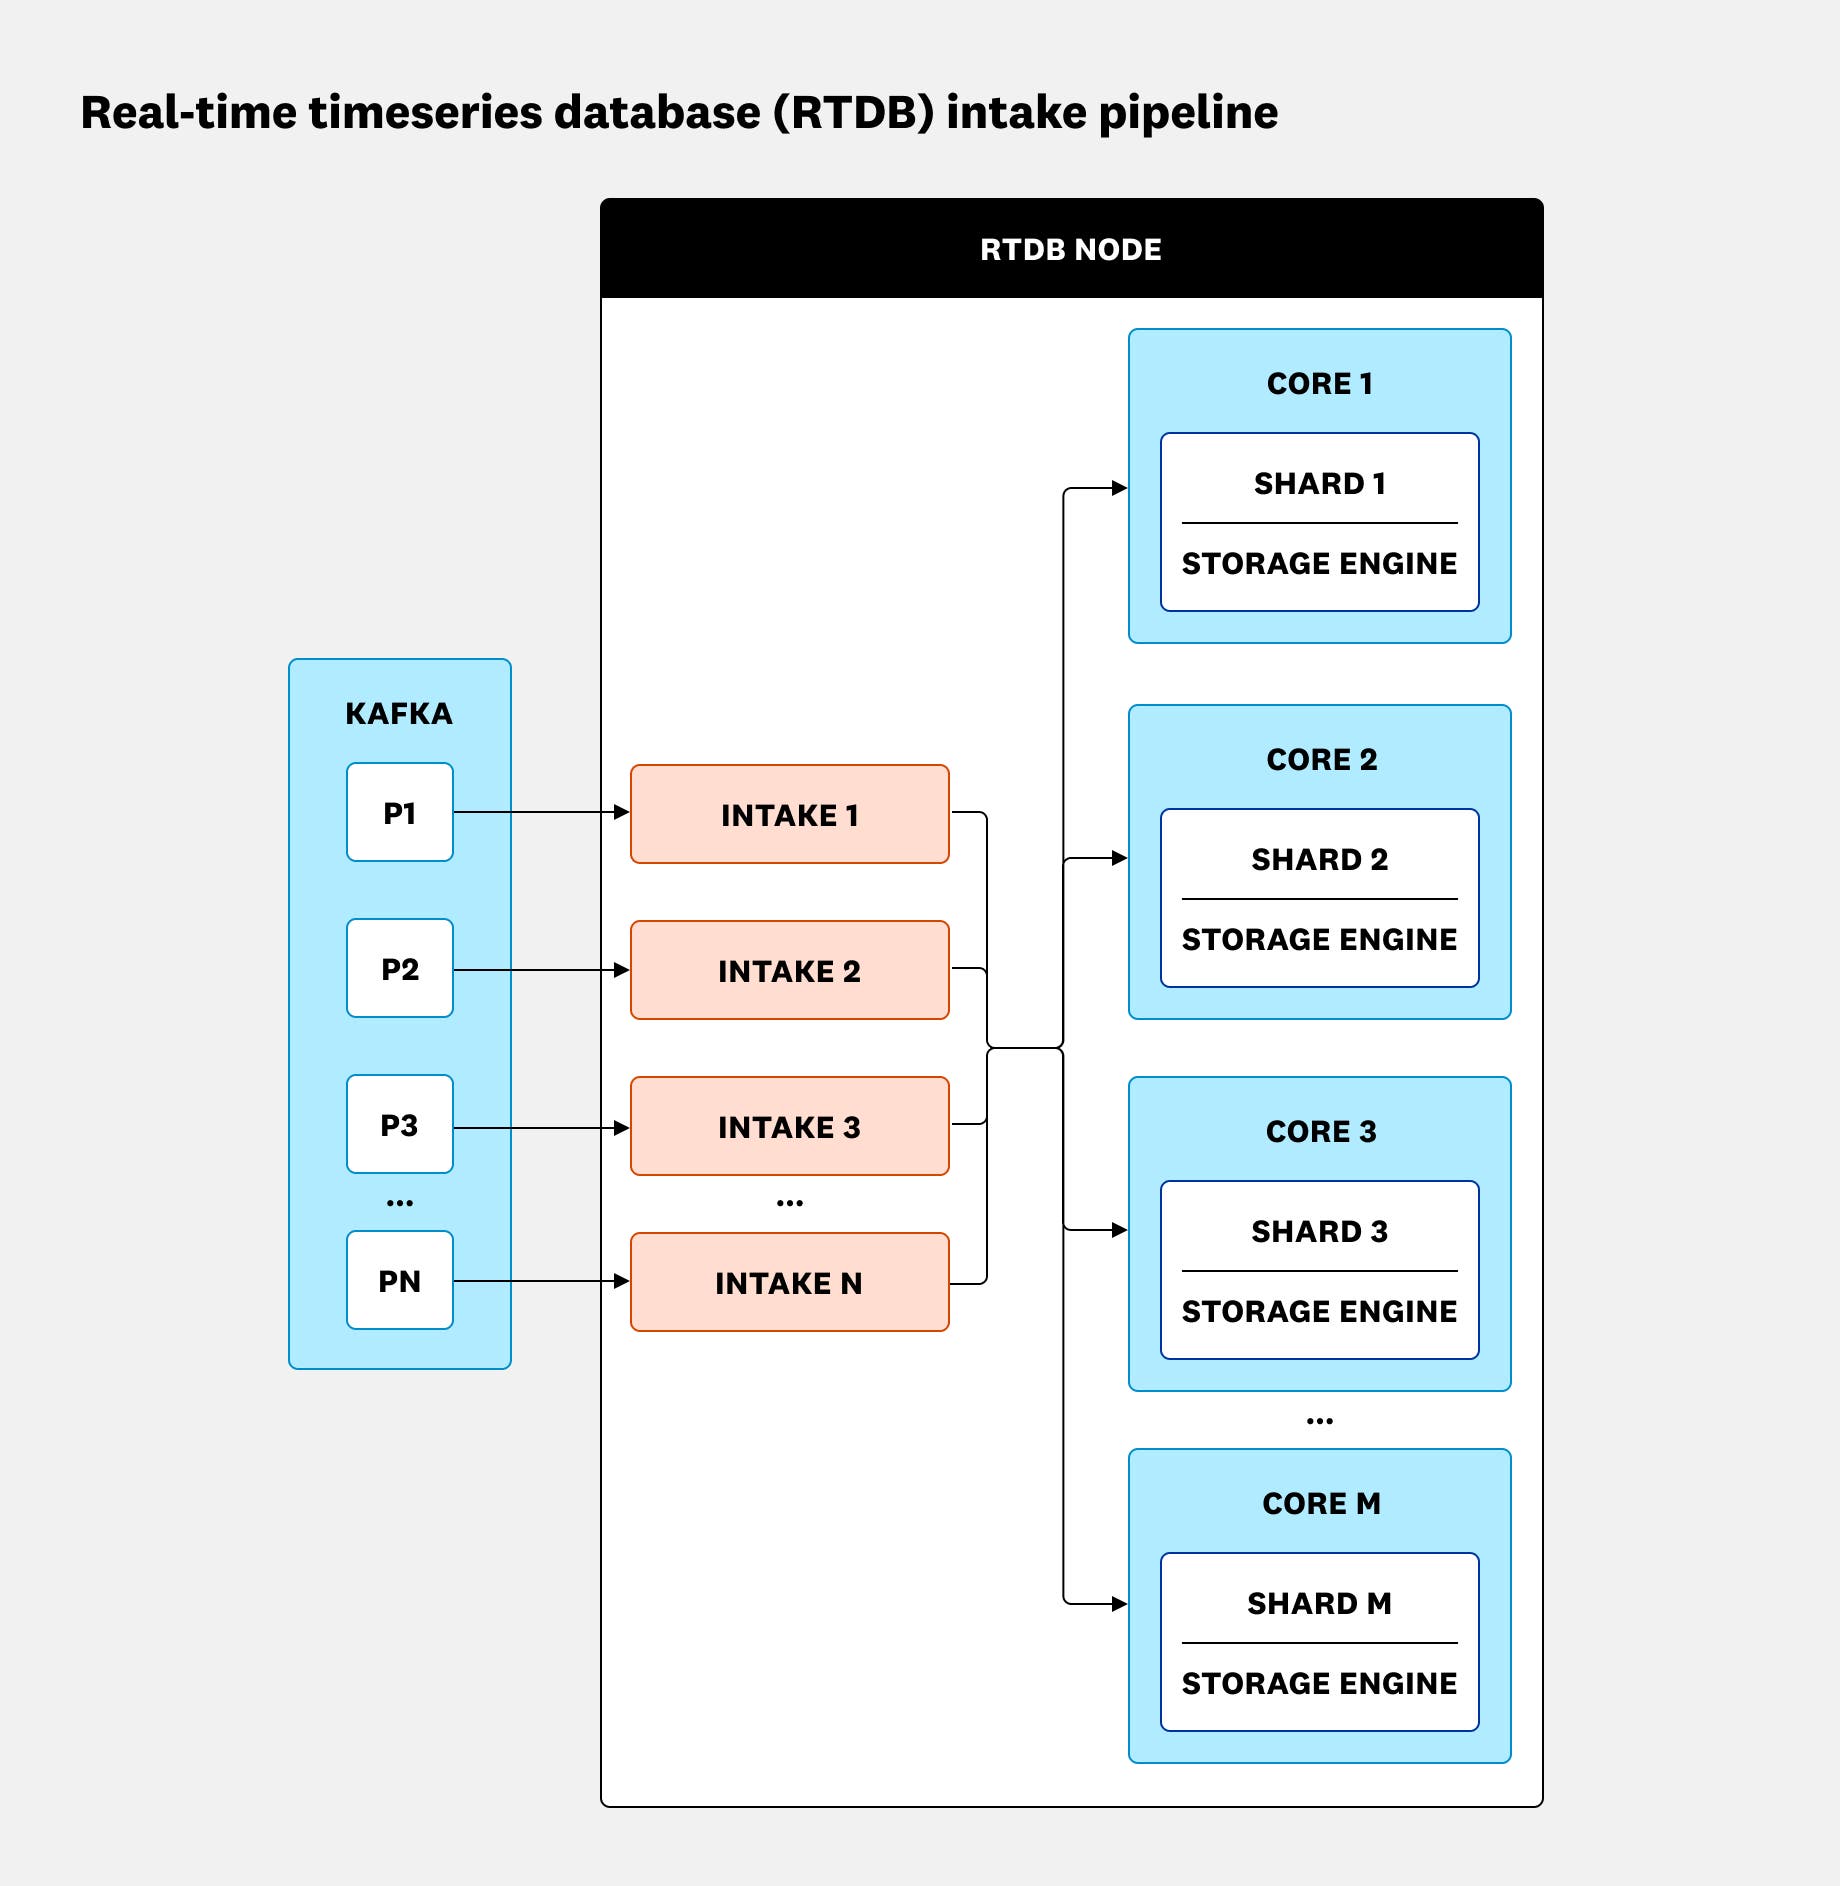
Communication between intake and storage tasks happens over a set of MPSC (multi-producer, single-consumer) channels—we use tachyonix—one channel per storage shard. Every intake task can send to every storage task’s channel, but once the data is sent, the shard owns it.
In our typical configuration, the number of storage shards is larger than the number of intake workers. That’s because shards are chosen based on hardware parallelism (for example, one per CPU core), whereas intake workers depend on the number of Kafka partitions we consume.
This shard-per-core, async worker model is fundamental to RTDB. It gives us partitioned concurrency: each core handles a portion of the data independently. There is no need for locks or atomic operations on the critical path of writing data. As a result, we avoid a lot of complexity around concurrency control.
We rely on cooperative scheduling to ensure fairness. If a storage task runs too long, it yields periodically so others can run, which prevents any single task from starving the rest. This approach also enables simpler logic in other parts of the system, as we’ll see in the storage engine internals.
Throttling under heavy load
Even with perfect sharding, a traffic surge or expensive query can overload a node. To keep the system stable, RTDB employs both permit-based and scheduling-based throttlers.
Permit-based throttling
Permit-based throttlers act as gatekeepers by immediately rejecting or slowing down work that would jeopardize stability. We track several conditions, such as:
- Ingestion lag (if a node falls too far behind)
- Memory usage
- Too many concurrent queries
If any threshold is crossed, we shed or reject load accordingly.
Cost-based query throttling
We also implemented a cost-based query throttler, which is a scheduling-based mechanism. Instead of outright rejecting queries, the cost throttler queues incoming queries and schedules their execution based on priority and estimated cost (for example, size of data to scan). This system uses the CoDel (Controlled Delay) algorithm to manage latency, switching between FIFO (first-in, first-out) and LIFO (last-in, first-out) scheduling depending on the current load and queueing delays.
This dynamic scheduling ensures that high-priority or quick queries still get through and expensive queries don’t hog all the resources.
Snapshots for durable storage
Another important component is the snapshot system, which provides backup and restore capabilities for RTDB. Snapshots periodically capture a point-in-time copy of the database’s state. We use snapshots for operational backups and for fast recovery in case a node dies. If a node needs to be restored or cloned, we can take the latest snapshot and load it onto a fresh instance, rather than replaying an entire backlog of metrics from scratch. This system is crucial for data durability and quick disaster recovery—it lets us recover large volumes of timeseries data within minutes, which is essential at the scale we operate.
Introducing Monocle: a high-performance timeseries storage engine
At the heart of the new timeseries database is Monocle, our custom storage engine built in Rust. Monocle was designed as a standalone library that could be used by multiple systems.
Under the hood, Monocle uses an LSM-tree architecture and follows a worker-per-shard design: each storage worker (shard) manages its own LSM-tree instance, ingests data, serves queries, and handles background tasks such as compactions. Each storage worker runs on a single-threaded Tokio scheduler.
Recent writes are buffered in an in-memory structure (the memtable), while frequently accessed data is served from an in-memory cache. On disk, data is stored in a custom file format similar to static sorted tables, organized and indexed for efficient time-based lookups. A background compaction process merges and reorganizes these files over time to keep read performance and storage space optimized.
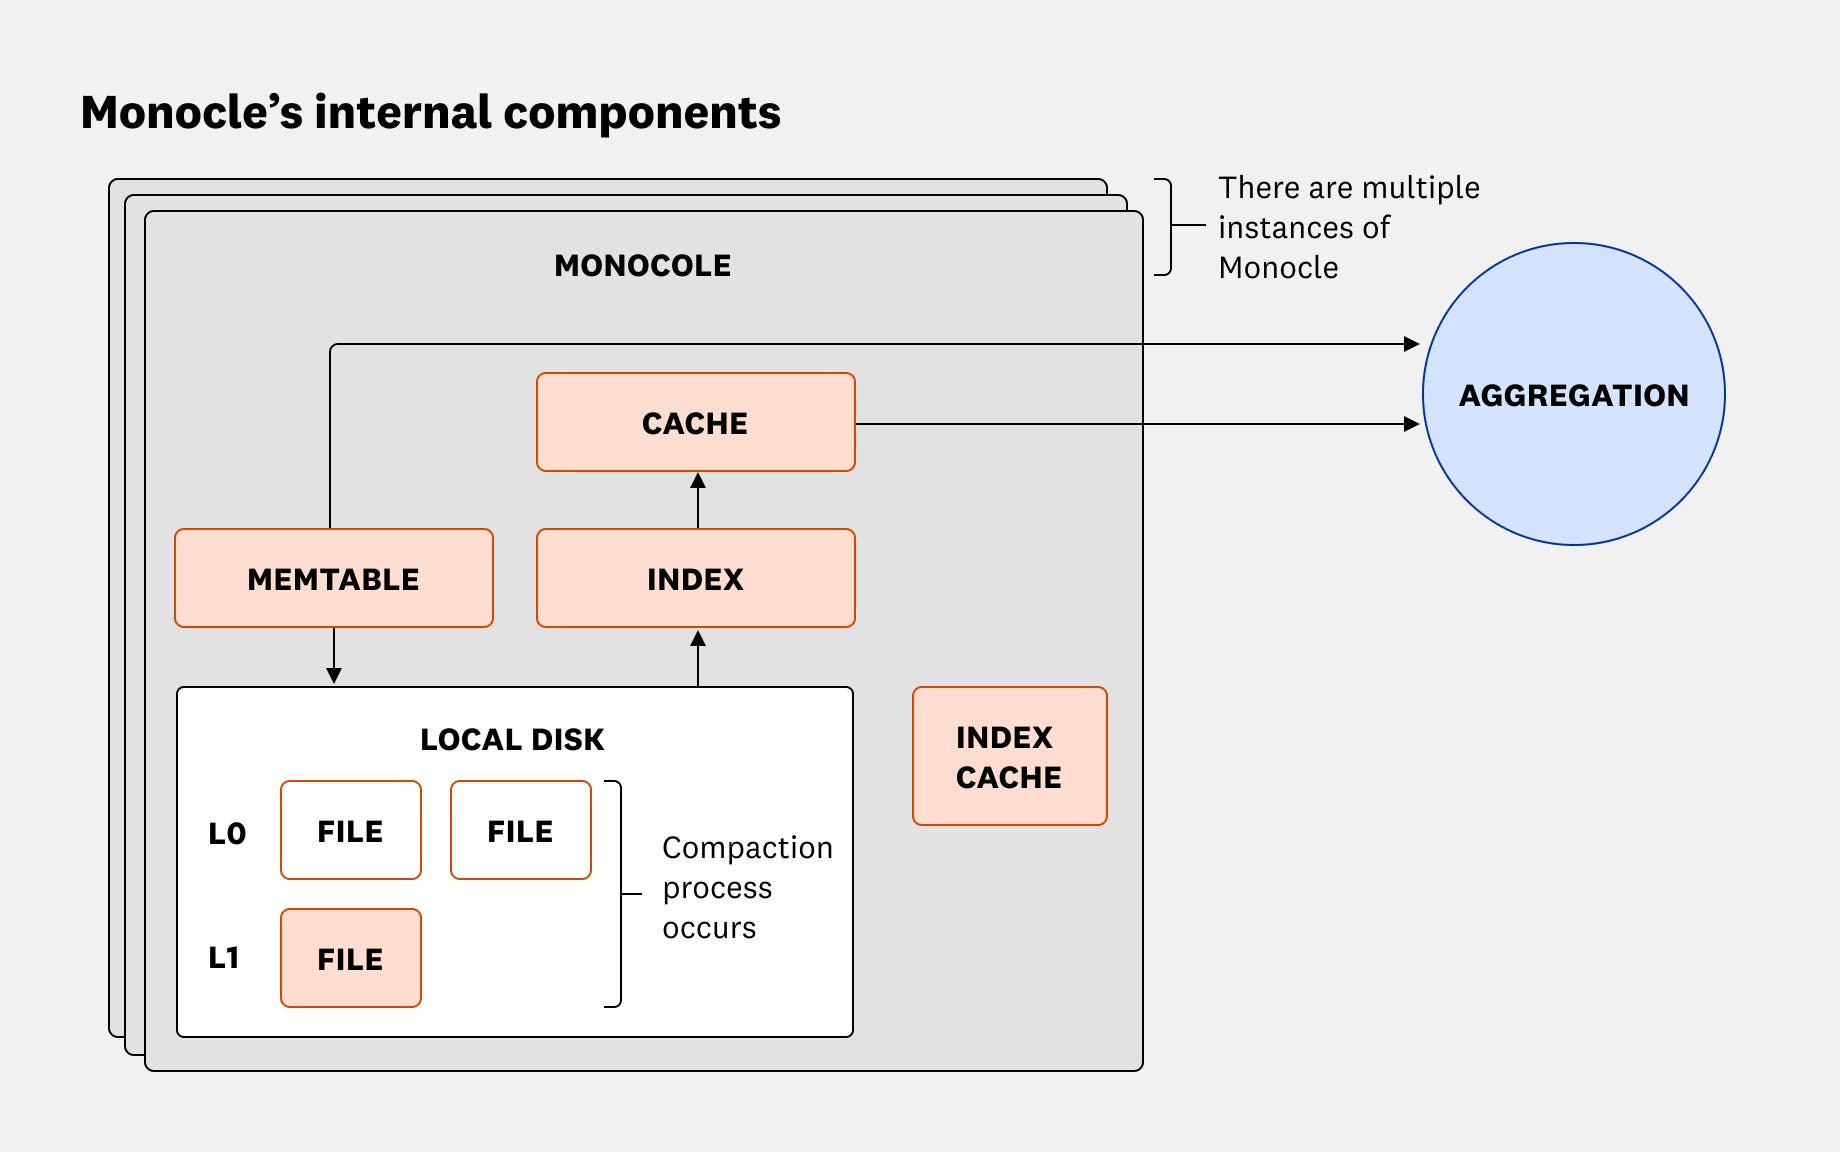
Monocle supports not just simple scalar metrics, but also distribution data types like DDSketch, and even more complex objects such as HyperLogLog counters.
Now, let’s zoom in on a few interesting aspects of Monocle’s design: the memtable, the series cache, and the compaction strategy.
How we simplified the write path with memtables
In a typical LSM—including RocksDB—incoming writes go into a memtable, an in-memory buffer. The memtable is usually an ordered structure that supports new writes and reads. When the memtable fills up or ages out, it is made read-only and asynchronously flushed to disk. Once the flush is complete, that memtable’s memory is reclaimed, and new writes go into a fresh memtable.
In our system, we simplified the write path by avoiding cross-thread contention entirely. Each worker thread manages its own private memtable—no other thread writes to it. This shard-per-thread model eliminates the need for synchronization—there are no locks, no atomics, and no pointer-heavy data structures to manage.
When a memtable fills up, the owning thread seals and flushes it to disk independently. This cooperative scheduling ensures that flushes don’t monopolize CPU resources, and other shards continue operating unaffected. Because only one thread ever touches a given memtable, we get strong ordering guarantees and no risk of concurrent reads on partial writes.
We also extensively compress the generated LSM-tree files to reduce storage requirements. Our initial design was inspired by Gorilla, Facebook’s in-memory timeseries database. Later, we adopted a SIMD-based (single instruction, multiple data) codec, which reduced file sizes and drastically improved compression and decompression performance.
Reducing query latency with unified series cache
Another challenge in timeseries storage is that data for a single timeseries can end up spread across many files. Reading a time range might require touching multiple files, which incurs a lot of I/O and CPU overhead to merge the results. To mitigate this, we implemented a unified series cache that sits above the storage engine’s files (as shown in the following diagram).
Traditionally, systems might rely on OS page cache or a block cache at the file level. However, a naive per-file cache can’t understand higher-level patterns—such as two adjacent files might both contain points for the same timeseries—and may lead to redundant data being pulled into memory. It also complicates eviction—useful data might get removed simply because it’s spread across multiple files, with no coordination between them.
Our series cache takes a more holistic approach by caching data per timeseries. We organize cached points for each timeseries in an intrusive linked list data structure. An intrusive linked list is a type of linked list where the nodes are embedded directly within the objects being stored, rather than wrapping those objects in separate list node structures. Each such node stores all the points—plus some metadata—for that series within that time slice.
The design is based on two key observations: most queries target recent data, and most stored data is never queried at all. So we want our cache to prioritize freshness and relevance. We segment by time so that we can evict old segments of a series independently, and we use an LRU (least recently used) policy within each time window to keep the most recently accessed data in memory. In practice, this means recent hours of data are likely cached for many active series, but older data will be cached only if it’s actively being queried.
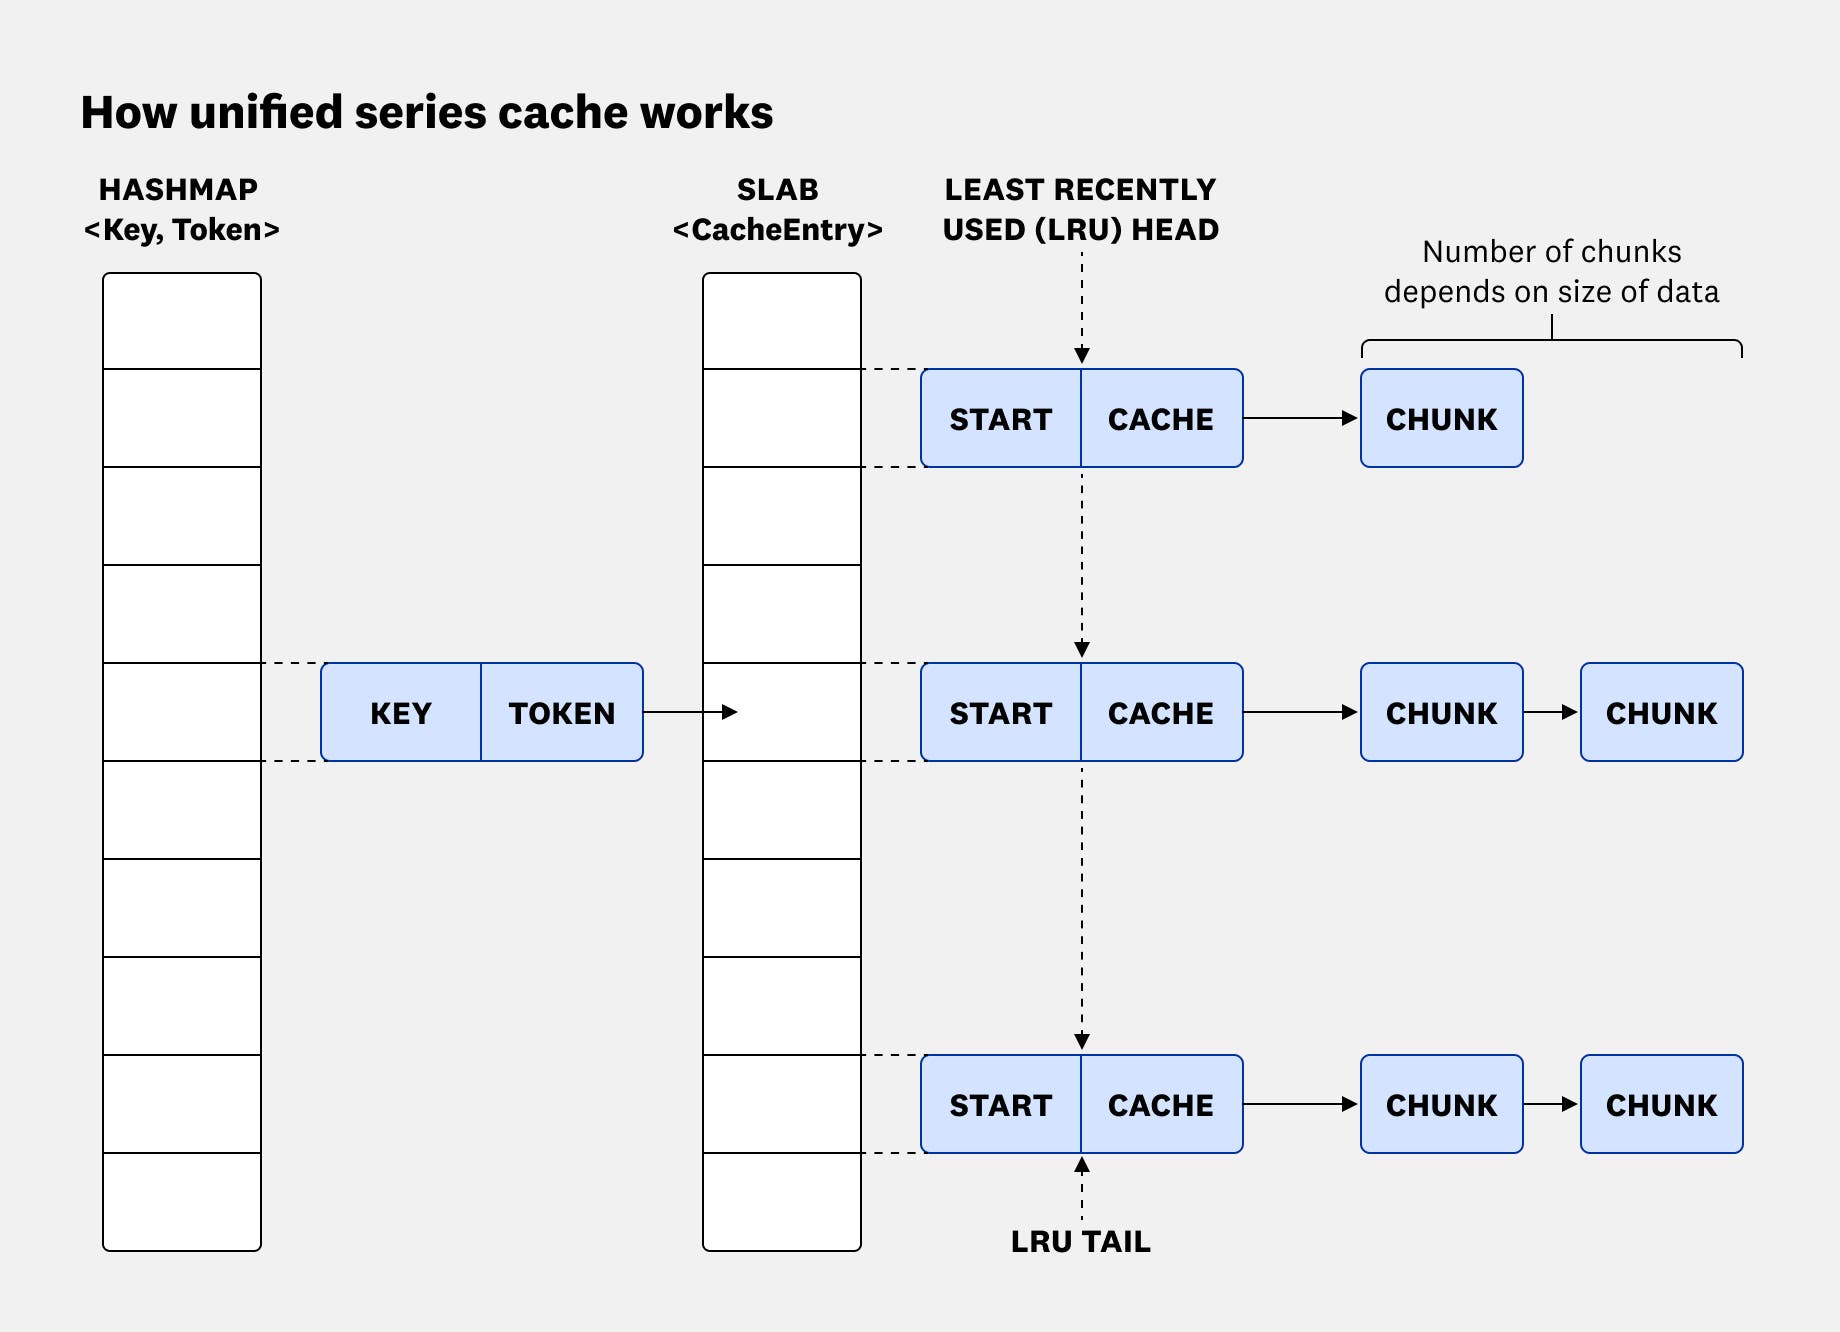
The series cache is populated in two ways.
- On-demand: When a query reads a time range, any data it pulls from disk is inserted into the cache.
- Proactively: When the memtable flushes new data, we immediately populate those fresh data points into the cache—only for timeseries that are already cached.
This approach is especially beneficial for workloads that frequently access recent data. This way, recent points are available in memory without needing an initial query miss. We also carefully coordinate cache updates during a flush to avoid conflicts with concurrent reads—ensuring we neither double-insert nor overwrite data in the cache.
When serving a query, if the requested data is in the cache, we return it from memory. If some portion is not cached, we go to disk for that part. Our query engine uses a batched streaming interface to merge cached data with disk data smoothly. It can iterate over the time range, pulling data from the cache and from on-disk files as needed, without loading everything into memory at once. If multiple queries request the same data at the same time, our system will synchronize so that only one thread loads the missing data from disk—others wait and reuse the result.
This series cache design has significantly reduced query latency and I/O load. By caching whole timeseries segments, we avoid a lot of repetitive merging work and disk reads that were present in the old design. It also lays the groundwork for future enhancements, such as compressing cached data in memory to improve efficiency or adapting the caching policy based on query patterns—for example, keeping cache hot for certain high-priority metrics. The unified cache gives us a central place to implement such strategies going forward.
Improving performance with tiered compaction
As with most LSM-tree-based databases, RTDB must continually compact on-disk files to stay performant. Compaction merges multiple files, discards overwritten or deleted data, and prevents the file count from growing unbounded. Proper compaction improves read performance and space efficiency.
Most systems—like RocksDB—use leveled compaction, where each level contains files with non-overlapping key ranges. This means that any read will have to consult O(# levels). Leveled compaction keeps read amplification low—each key will only reside in at most one file per level—but it incurs many frequent merge operations to maintain those non-overlapping invariants.
We took a different approach: tiered compaction. In this model, we allow some overlapping of key ranges within a tier. Each tier can accumulate a few files. When the number of files in a tier exceeds the threshold, all files in that tier are merged and the result is pushed down into the next tier. This way, we don’t constantly merge files as soon as they overlap—we merge in batches, less often.
Tiered compaction significantly reduces write amplification and CPU overhead for heavy write loads, because we perform fewer total compaction operations compared to a leveled scheme. It favors write throughput at the cost of potentially increased read amplification, since at query time, you might have to check multiple overlapping files. For a detailed analysis of the compaction design space, read Constructing and Analyzing the LSM Compaction Design Space.
To address the read side of that trade-off, RTDB leverages the time-oriented nature of metrics:
- We store each file’s minimum and maximum timestamps in memory, allowing us to skip irrelevant files during queries.
- We use in-memory probabilistic filters (like Bloom filters) on each file to quickly test whether a file might contain a series key.
These techniques reduce the number of files we have to open and read for any given query.
This compaction design fits our usage patterns well: most queries hit recent data, and our writes are roughly uniform across many series. As a result, having some overlapping historical files isn’t a big issue—we gain faster flushes and simpler compaction logic.
In practice, each shard ends up with a handful of files per tier, which get merged only occasionally. And thanks to time-based pruning and filters, queries rarely pay a performance penalty for the overlaps. By leaning into the time-locality of metrics data, RTDB turns what could have been a generic trade-off into a performance advantage for our workload.
Reducing aggregation overhead with a shared radix-tree buffer
When an RTDB node receives a query, it often has to aggregate data from many timeseries into one or more outputs. Each query defines groups of timeseries IDs that are combined (over the query’s time range and aggregation settings) to produce a single output timeseries per group. Executing these group-by aggregations efficiently at Datadog’s scale requires fast processing and careful memory usage. Our original RTDB design attempted to meet this demand by giving each worker thread its own aggregation buffer, thereby avoiding any cross-thread synchronization.
However, this per-worker buffer approach breaks down for distribution metrics like DDSketch, which can use up to 65,536 bins (64-bit counters) per timeseries. Duplicating those bins across many workers quickly becomes impractical. For example, if 30 workers each aggregated 100 timeseries—each series spanning 24 hours with one DDSketch per minute—the old design would consume roughly 2,100 GiB of memory in total, which is clearly infeasible.
To overcome these issues, we built a single, shared aggregation buffer guided by a few key principles:
- Thread-safe shared buffer: All workers now aggregate into one shared buffer, which we made thread-safe with minimal locking. Because each timeseries contains many points, different threads rarely need to update the exact same points in the same series simultaneously. We leverage this pattern by grouping eight consecutive points into a cache line-aligned block protected by a single mutex. This fine-grained locking confines contention to within each small block and allows parallel updates with little synchronization overhead.
- Inline small DDSketch bins: Production data showed that roughly 75% of DDSketch instances have four or fewer bins. We optimize for this common case by storing up to four bin counts directly inside the sketch’s summary structure. This avoids a heap allocation for the majority of sketches, making aggregation of small sketches faster and more memory-efficient.
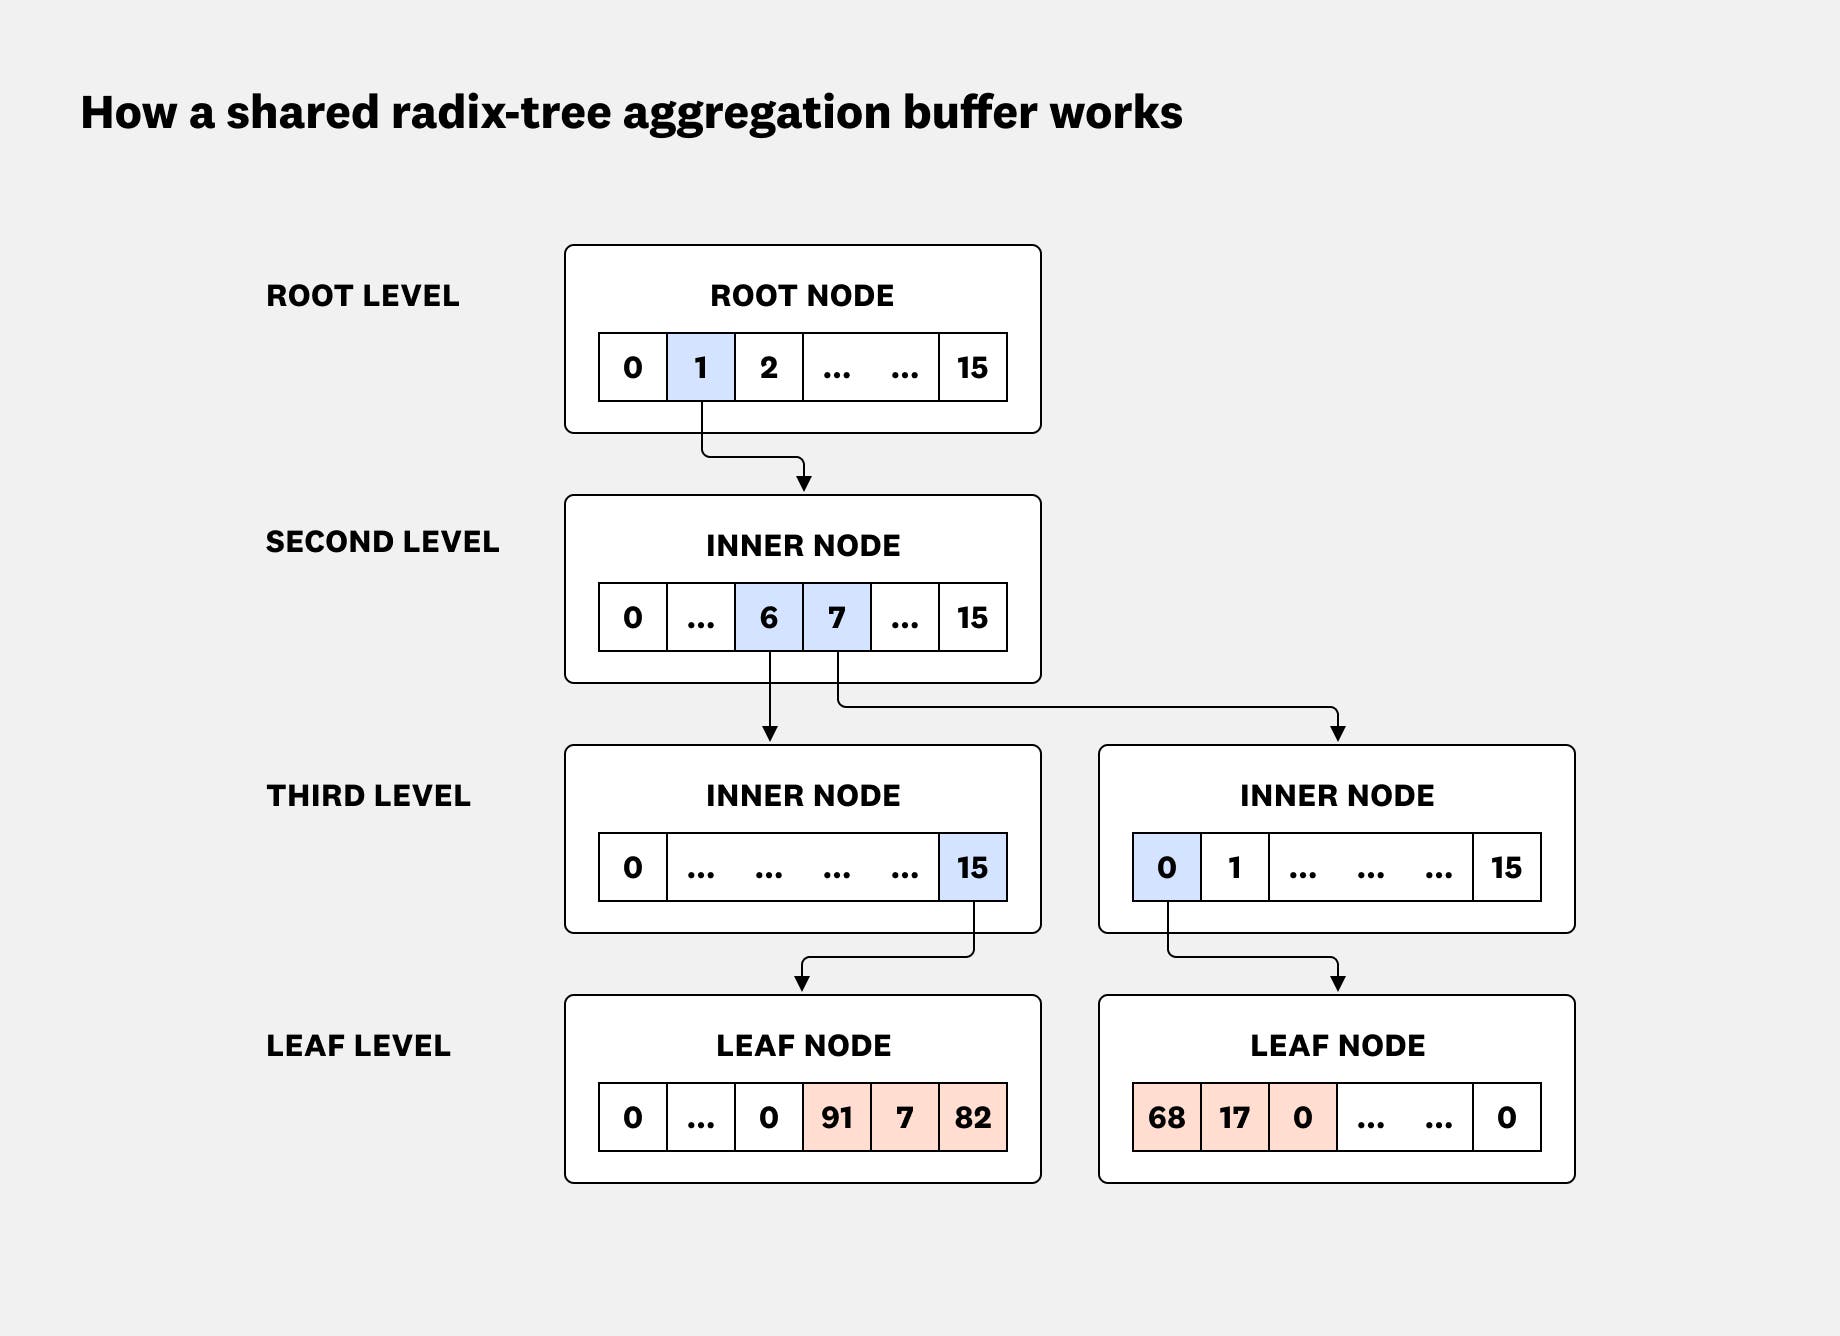
- Radix-tree aggregation buffer: Storing up to 65,536 bins per sketch presented a trade-off between speed and space. One option was a fixed array of 65,536 counters, which offers constant-time access, but wastes huge amounts of memory. The other option was to keep a list of only the non-empty bins (pairs of bin index and count), which uses memory proportional to the number of bins, but incurs overhead from dynamic allocations and lookups. Our analysis revealed that bin usage is typically sparse and clustered in certain ranges. Based on this, we implemented a four-level radix tree (shown in the following diagram)—inspired by the Linux kernel’s virtual memory map—with a fanout of 16 at each level. This structure provides near-array lookup speed while allocating memory only for bins that actually exist, achieving both high performance and efficient memory use.
- Squeeze bins into
u32s: DDSketch bin counts are 64-bit integers (u64), but in practice most counts never approach the 32-bit limit. We conserve memory by storing counts asu32values in the aggregation buffer and promoting them to 64-bit only if they overflow theu32range. Rust’s built-in overflow checks make it straightforward to detect when an upgrade to a larger counter is needed.
As a result, the shared radix-tree buffer cuts aggregation memory usage by orders of magnitude and boosts throughput by about 70%.
What changed in production: performance and rollout
After extensive testing, we rolled out RTDB for distribution metrics in production. The results were immediate:
- 2x more cost-efficient
- 5x faster for high-cardinality queries
- 60x faster ingestion
What used to be extreme query outliers taking minutes are now routine, returning results in seconds. The real-time ingestion pipeline can now absorb traffic spikes with significantly more headroom.
We performed a careful migration by running the new RTDB alongside the legacy storage engine to verify correctness and performance. During the migration, an upstream service incident caused a massive traffic surge to be directed at the databases. The old engine struggled to keep up, but RTDB was able to absorb the entire surge and serve all queries without any lag. This gave us confidence not only in RTDB’s raw performance, but also in its resilience under sudden load spikes.
A system built for reuse
Another big win from the Rust rewrite and our modular design is broader adoption of components across Datadog. We designed Monocle and its supporting components as reusable modules. As a result, the intake pipeline has already been repurposed in another metrics ingestion service and the snapshot module is now shared by multiple data storage systems internally.
That kind of reuse validates the approach: build a robust component once and use it in many contexts. It reduces duplicated effort, improves consistency, and increases reliability company-wide.
Looking ahead: smarter routing and integrated indexing
The story doesn’t end here. As Datadog has grown, so have the demands on our metrics infrastructure. Data volumes and metric cardinality are increasing massively, as are the scale of our customers and the complexity of their queries.
One area we’re actively improving is query load balancing. Today, we use a system inspired by Google’s Slicer to distribute metrics across storage nodes. It works well in steady state, but still relies on some static shard assignments. We’re now moving toward a more dynamic load-balancing system for query, which will allow the metrics routing to adapt automatically to sudden spikes or changes. This will further improve system resilience under bursty, high-volume traffic.
We’re also rethinking the separation between indexing and timeseries storage in our metrics platform. Since the beginning, we separated the concerns of what to store (timeseries values) and how to find it (the index of metric names and tags). This was the right tradeoff at the time—handling high-cardinality timeseries data from a single database is hard. The critical questions have always been: what do you index, and what do you leave unindexed to keep the system scalable?
We’re now revisiting that choice. New techniques and more efficient data structures have emerged, and we’re asking: Can we unify these systems? A unified approach could simplify the architecture and improve maintainability.
Building our timeseries database in Rust and rearchitecting it for a high-cardinality scale has paid off in reliability, performance, and maintainability. Equally important, we built the system in a modular way that benefits other teams and use cases.
Our journey shows that, with careful design and a clear understanding of your workload, you can get the best of both worlds: fast writes and fast reads, rich features and simplicity. We’re excited for the next steps—making the platform even more adaptive and unified as our customers scale and evolve. Stay tuned as we continue evolving Datadog’s metrics platform.
If this type of work intrigues you, consider applying to work for our engineering team. We’re hiring!
Acknowledgements
This post wouldn’t exist without the collective expertise and collaboration of our engineering teams at Datadog. While the listed authors crafted the final draft, many others played crucial roles in shaping the technical direction, contributing to code, and driving the implementation.
We would also like to recognize the contributions of engineers over the years whose foundational work made this possible, including: Alexandra Bueno, Christian Damianidis, Clement Tsang, Colin Nichols, David Kwon, Eli Hunter, Evan Bender, Hippolyte Barraud, Jason Moiron, Jun Yuan, Kol Crooks, Laxmi Sravya Rudraraju, Mathias Thomas, Matt Perpick, Nicole Danuwidjaja, Pawel Knap, Ram Kaul, Shang Wang, Shijin Kong, and Xiangyu Liu.
