Sami Tabet
At Datadog, we process more than 100 trillion events and billions of queries every day—across logs, traces, network data, and more. To support that scale, we built Husky, our third-generation event store. We detailed its architecture in a series of posts on exactly-once ingestion and multi-tenancy and massively parallel compaction.
But all of that engineering—efficient storage, compaction, reliability under bursty traffic—was in service of a single goal: interactive querying at scale.
Storing the data is just the beginning. The real challenge is making that data queriable—quickly, cheaply, and reliably—even when:
- There’s no fixed schema or column types
- Data shape and volume vary across tenants
- Queries span millions of files in object store (called fragments) and petabytes of data
In this post, we’ll explore how Husky’s query engine tackles these problems head-on, and how its architecture enables interactive performance, even under extreme workloads.
Husky refresher
Before we dive into Husky’s query internals, let’s take a moment to clarify the kind of data we store and the kinds of queries we need to support.
Husky stores what we call events. Each event has a timestamp that represents when it occurred. For a log, that’s typically the time it was emitted. For a network event, it might be the moment the connection state (such as bytes received or transmitted) was sampled.
In addition to timestamps, events carry attributes. For a log, attributes might include the emitting service, the logger name, the host IP, or custom fields extracted through log pipelines. For a network event, attributes include metadata about the source and destination, as well as statistics like the count of retransmits or transmitted bytes.
The important thing to note is: event shape varies significantly. Different use cases—logs vs. network data, for example—produce very different schemas. And even within the same use case, different tenants can have wildly different logging behavior: one might send a small number of massive logs, another might send a massive number of tiny ones.
On the query side, we support a wide range of patterns, but most queries fall into two main categories:
- “Needle-in-a-haystack” searches: Highly selective filters that try to isolate a specific event—such as a suspicious IP connection, a database error message, or a trace by request ID
- “Analytics-style” searches: Broad filters that generate aggregated views—such as a timeseries of service latency over the past week, a breakdown of sales by region, or a distribution of error types across hosts
Of course, there are other patterns—dumping a list of raw events, more complex queries involving table joins, and so on—but the two above represent the majority of the workloads we optimize for.
With that context, let’s look at how Husky’s query engine handles these workloads, and the optimizations that make it possible to do so at scale.
Overview of Husky’s query path
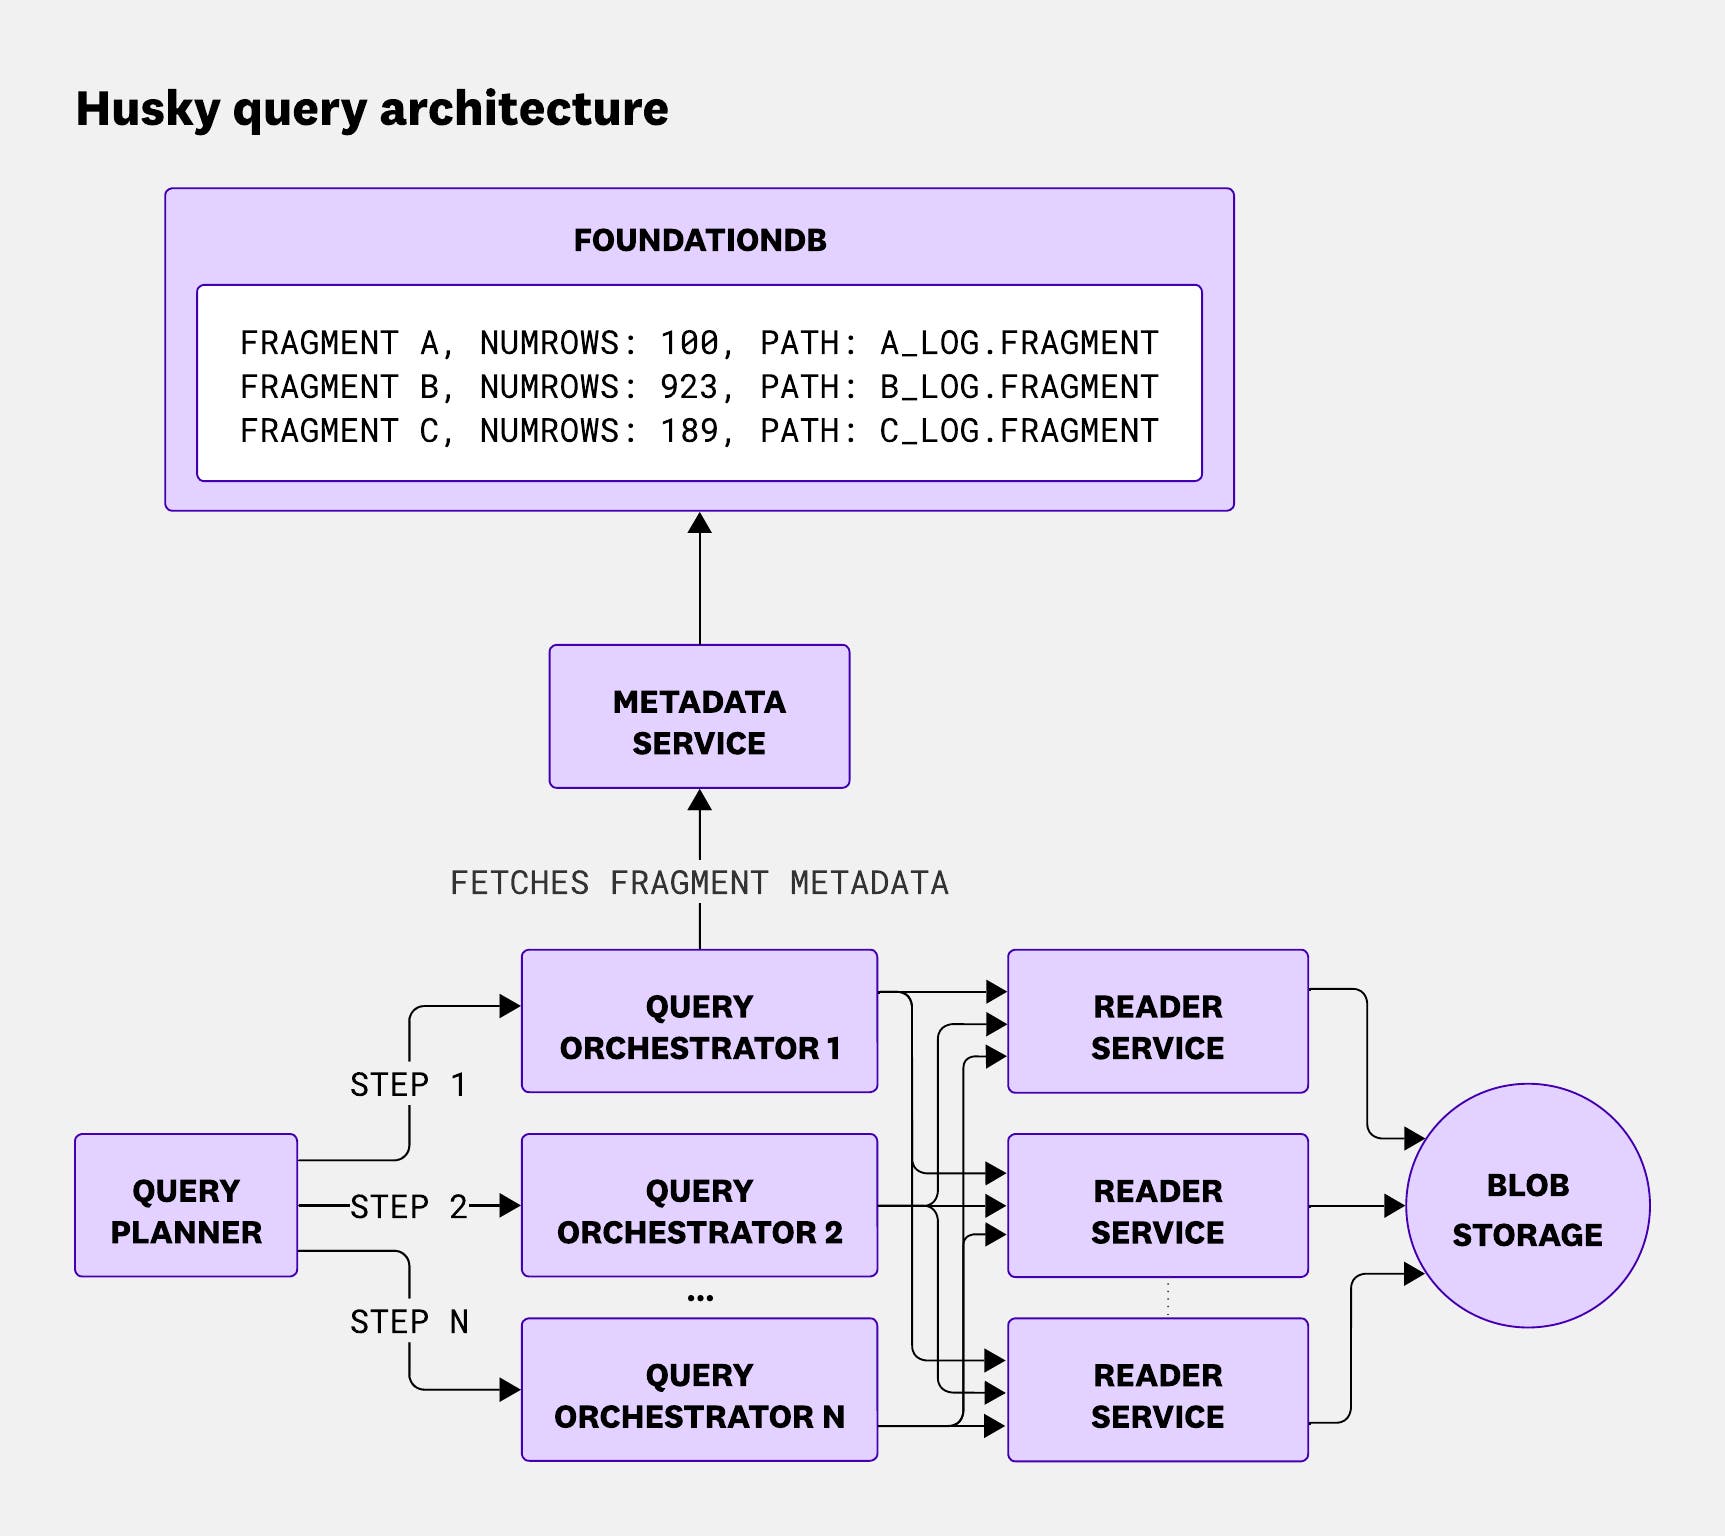
Husky’s query path is divided into four main services: the query planner, query orchestrator, metadata service, and reader service. All of them are multi-tenant and deployed across multiple regions, different deployments, and different data centers to ensure reliability.
Query planner
The query planner is the central entry point for all event-store queries. It handles everything from context resolution—like facets, index configurations, and flex-logs settings—to validation, throttling, query planning, sub-query result aggregation, and integration with other Datadog data stores (different from Husky) via connectors.
During planning, it applies query optimizations and uses statistics to divide the query into multiple time-based steps, which are then scheduled to the orchestrators. Once those steps are executed, the planner merges the results into a final response.
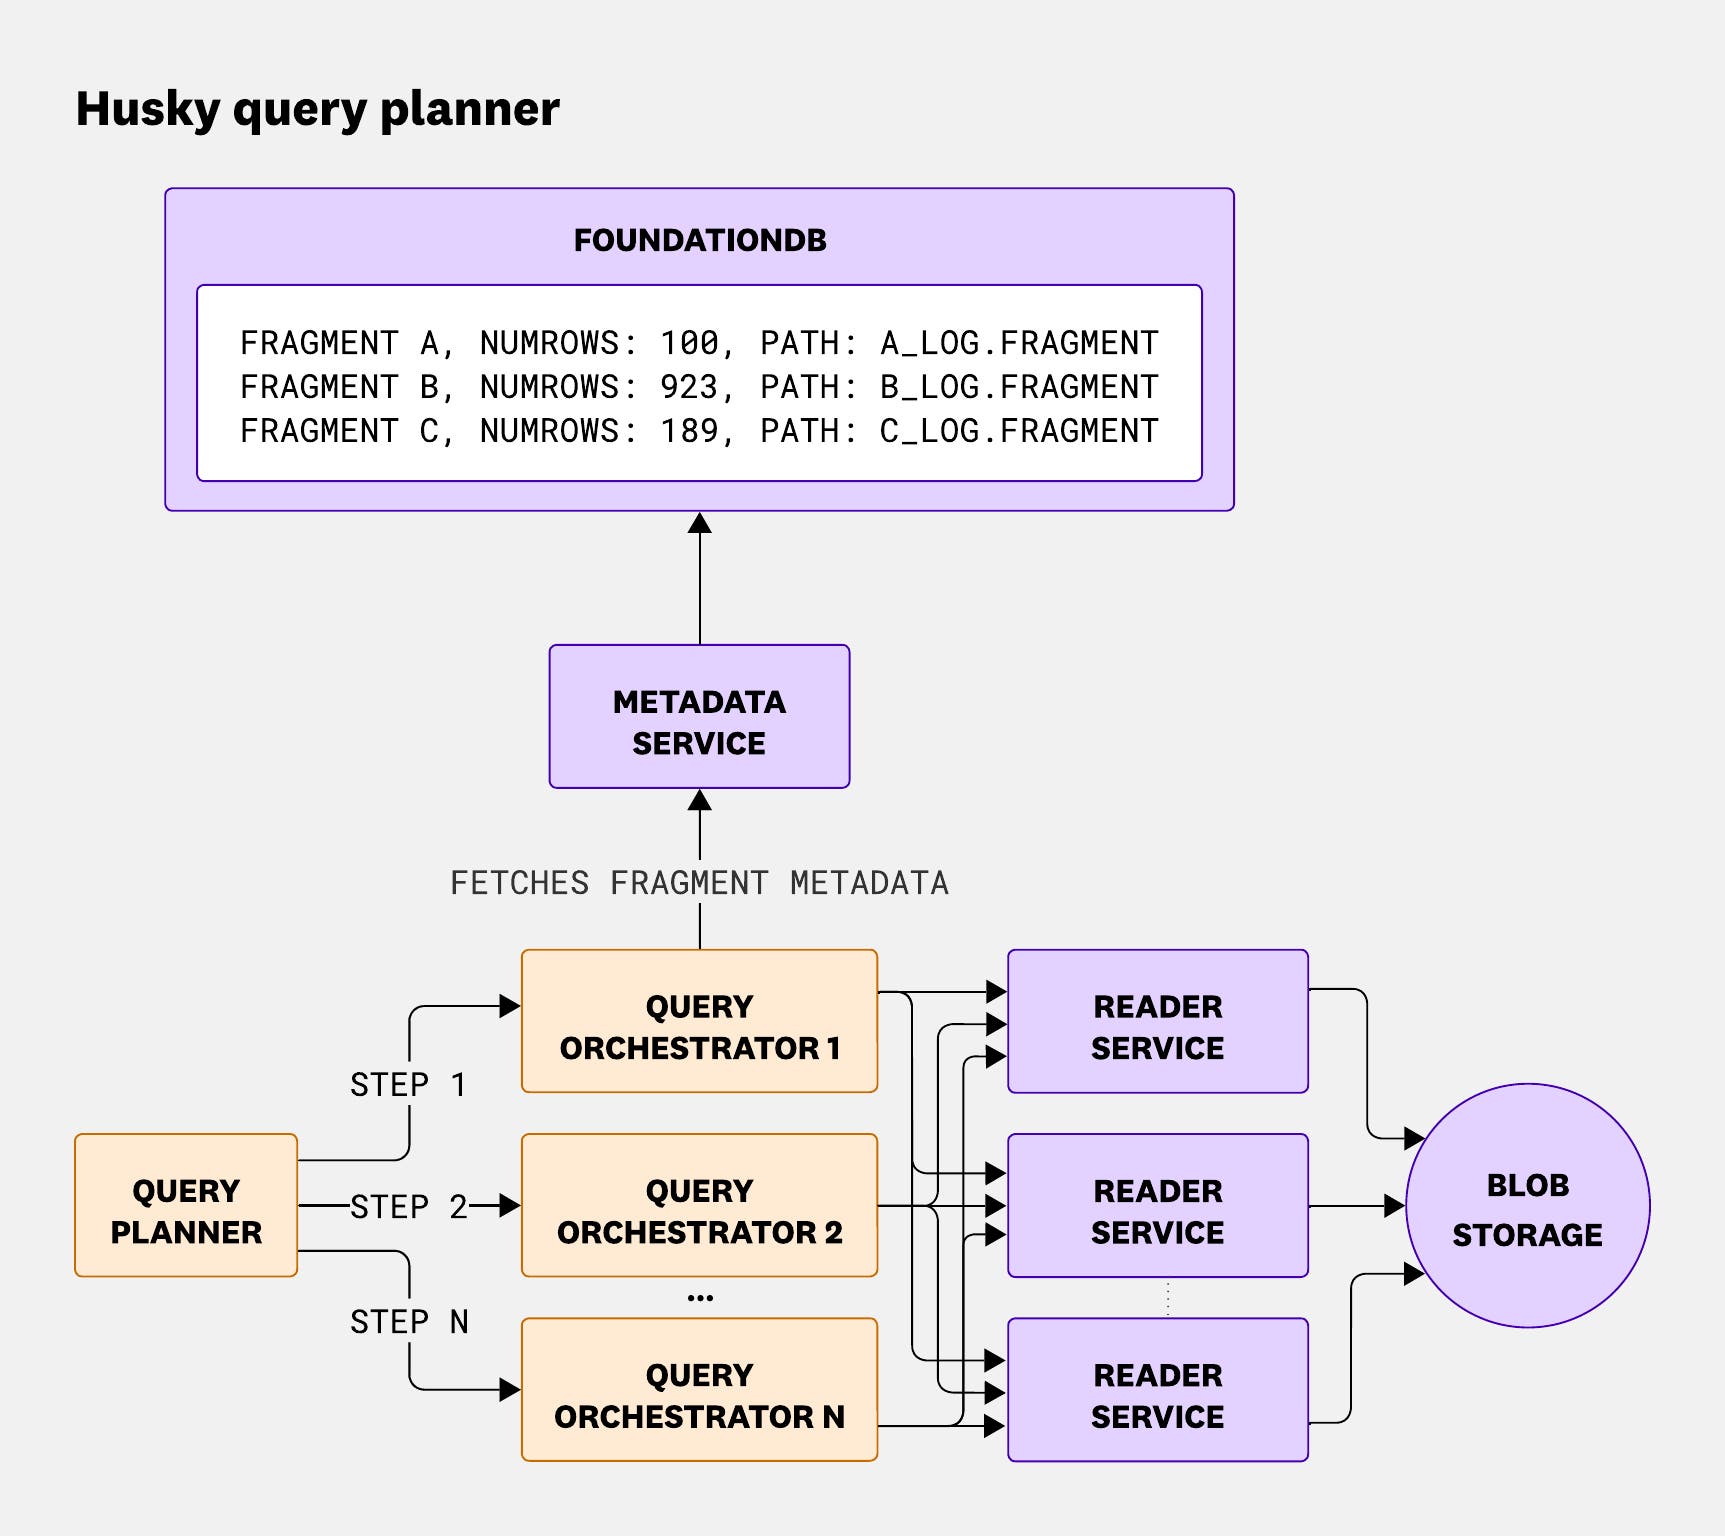
The query planner plays a crucial role in the query life cycle, ensuring efficient and secure data access and processing.
Query orchestrator
The query orchestrator acts as the gateway to the Husky data store and is responsible for three core functions: metadata fetching, fragment dispatching, and aggregation coordination.
First, it fetches fragment metadata from the metadata service—information that’s critical for query execution. This metadata includes file paths, fragment versions, row counts, timestamp boundaries, and zone maps used for query matching.
Next, it dispatches the relevant fragments to reader nodes. Thanks to zone-map pruning, this step can dramatically reduce the amount of work downstream—by up to 60% for structured events and around 30% on average.
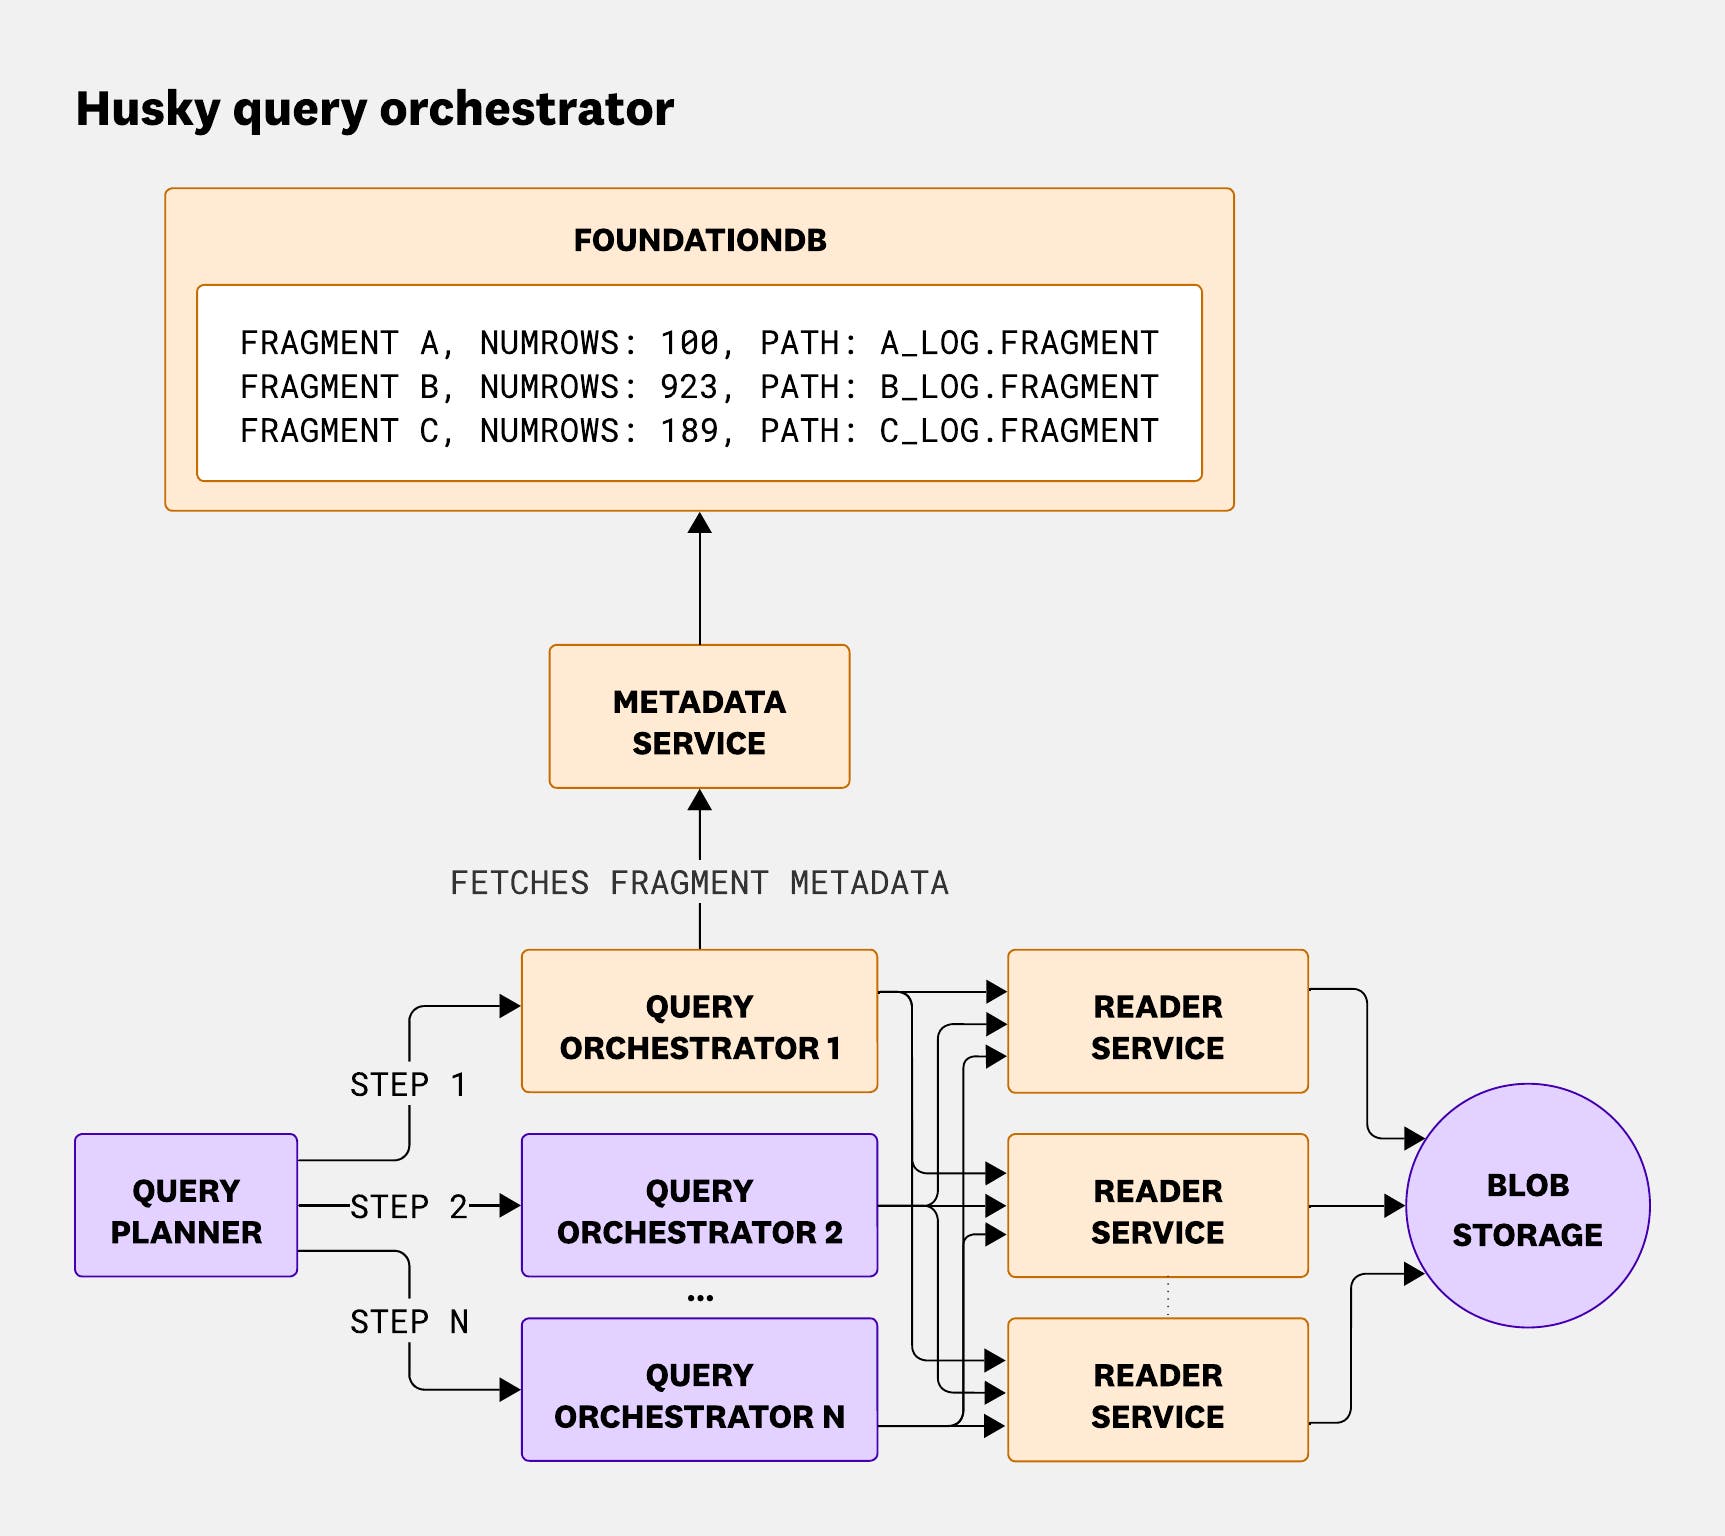
Once all fragments have been queried, the query orchestrator aggregates results from all queried fragments. This step can be more computationally intensive than the planning phase, depending on how much data comes back and how it needs to be combined.
Metadata service
The metadata service is a lightweight frontend to access our FoundationDB clusters. As explained in our blog post on compaction with Husky, atomicity is critical to preventing duplicate data from being displayed to users querying events during compaction.
The main purpose of this service is to abstract FoundationDB internals and separate them from the rest of the query path, while still preserving atomicity—even though FoundationDB enforces a hard five-second limit on transactions.
Reader service
Finally, the reader service receives a query along with a list of fragments and is responsible for returning a response as quickly as possible.
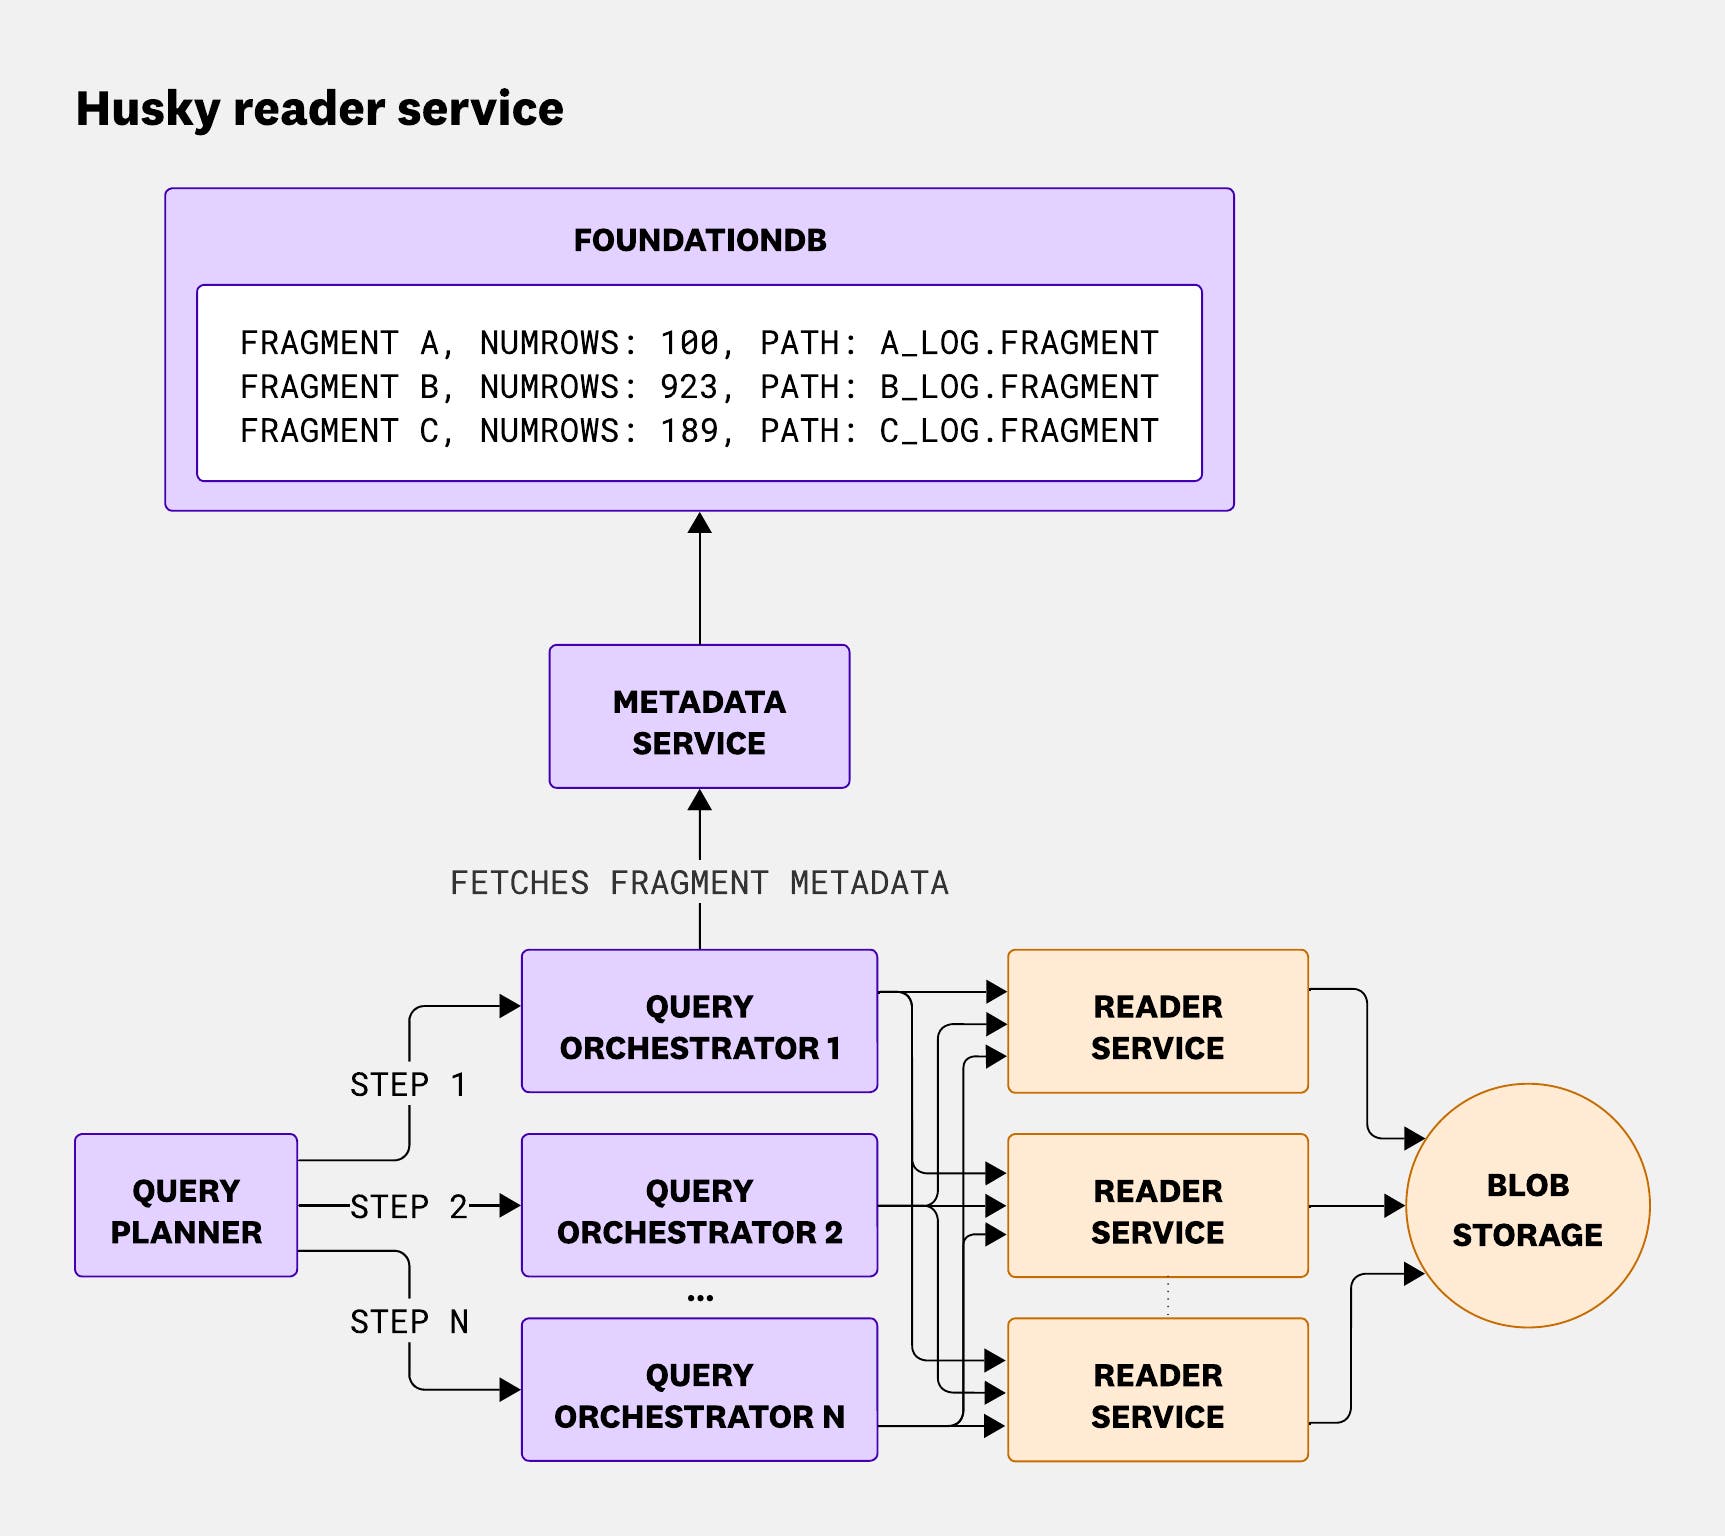
In the rest of this section, we’ll dive into some of the optimizations we’ve built into the reader to make querying feel interactive—even when scanning through 100 trillion events stored in a blob store and serving trillions of queries a day.
Optimizations in the reader service
We often hear: The fastest query is the one you don’t have to run. That turns out to be the common thread across many of the optimizations we’ve built into the reader service. The less data we scan, and the fewer fragments we touch, the faster and cheaper everything gets.
To make that possible, we’ve invested in several layers of optimization inside the reader. The first—and most fundamental—is how we physically organize data inside each fragment.
Row groups
The reader service is responsible for executing queries directly on fragment data. But that comes with its own set of challenges. Fragments can be large—sometimes millions of rows—which means that running naively, fully in-memory, could cause elevated memory pressure or even outright failures for some queries.
On top of that, fragments are stored in blob storage, which is both slow (at the scale of interactive queries) and expensive. We store millions of fragments per day, and issuing multiple GETs on each one for every query isn’t viable if we want the system to be performant and cost-efficient.
So, we want to fetch as little data as possible while still being able to answer the query.
To solve the first part of the problem, we take advantage of how fragments are physically laid out in what we call row groups, as shown in the following diagram:
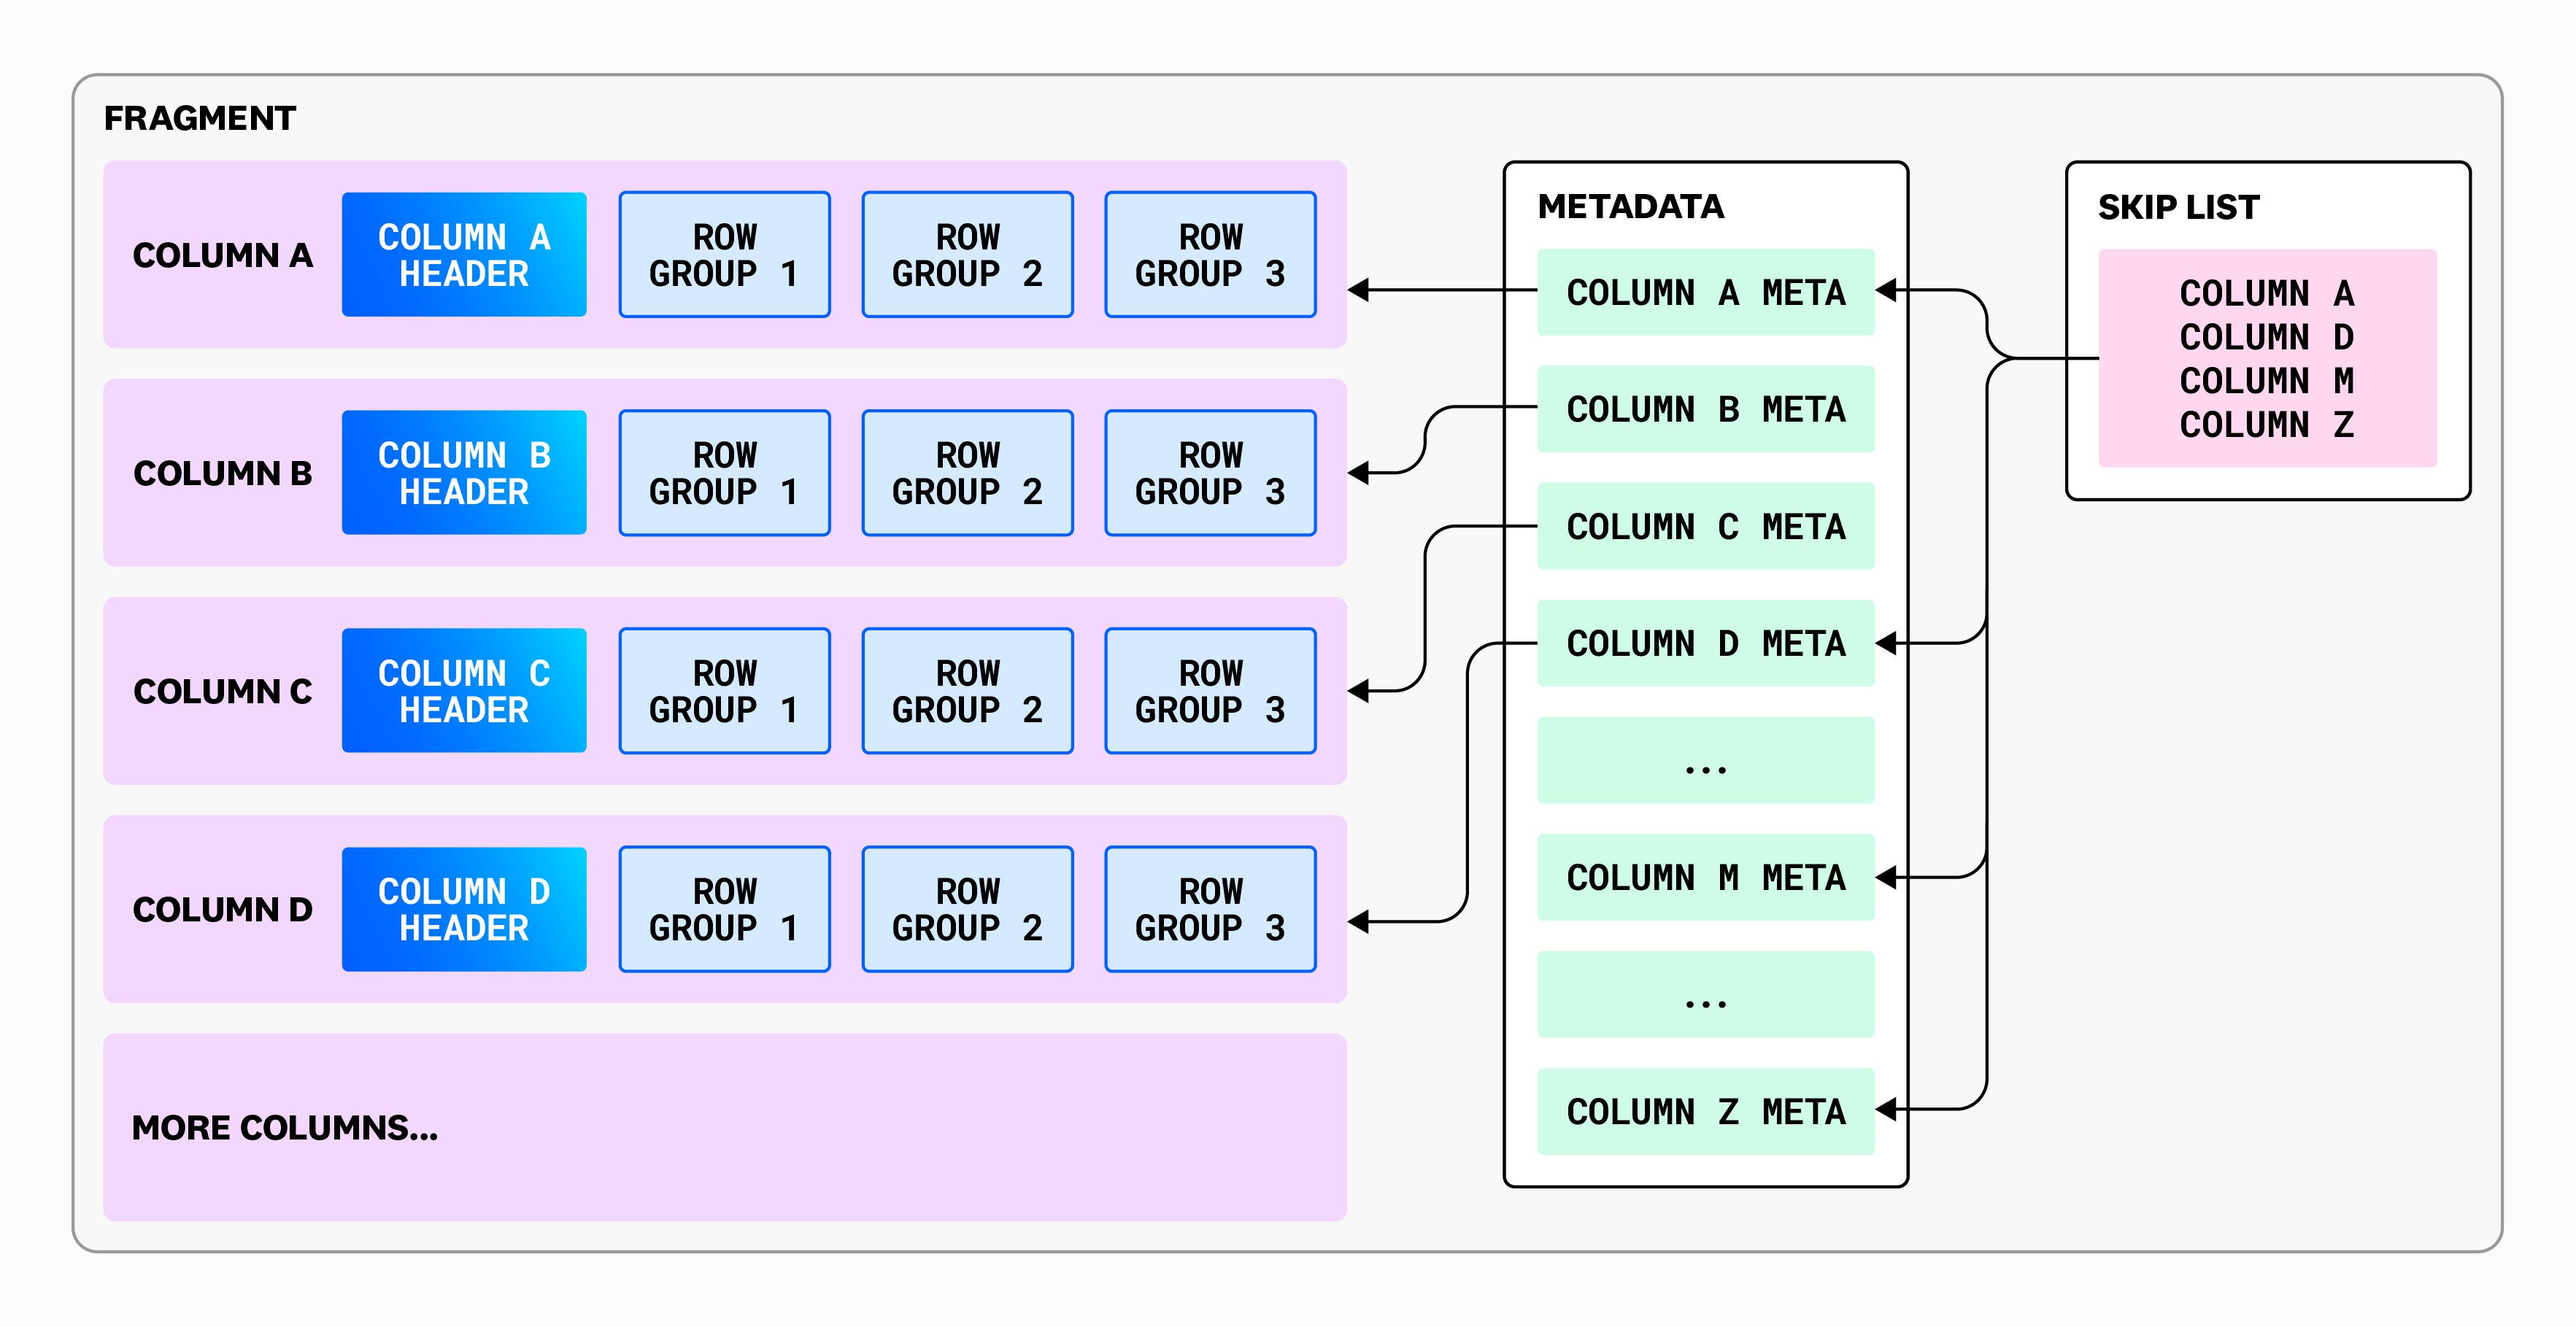
To understand why the row group layout matters for query efficiency in the reader service, it helps to look at how queries are actually executed. The reader uses an iterator-based execution model (inspired by Volcano), where each query is broken down into a set of operators. Each operator supports three basic actions:
open: For initialization tasks, like allocating necessary resourcesnext: To yield the next batch of resultsclose: To finish the execution
Operators can be chained together using just these three primitives to build more complex queries. That might sound a bit abstract—so let’s walk through a simple example.
This is the query that we will be considering:
SELECT max(timestamp), upper(service) as upperWHERE service IS NOT nullGROUP BY upperORDER BY max(timestamp) DESC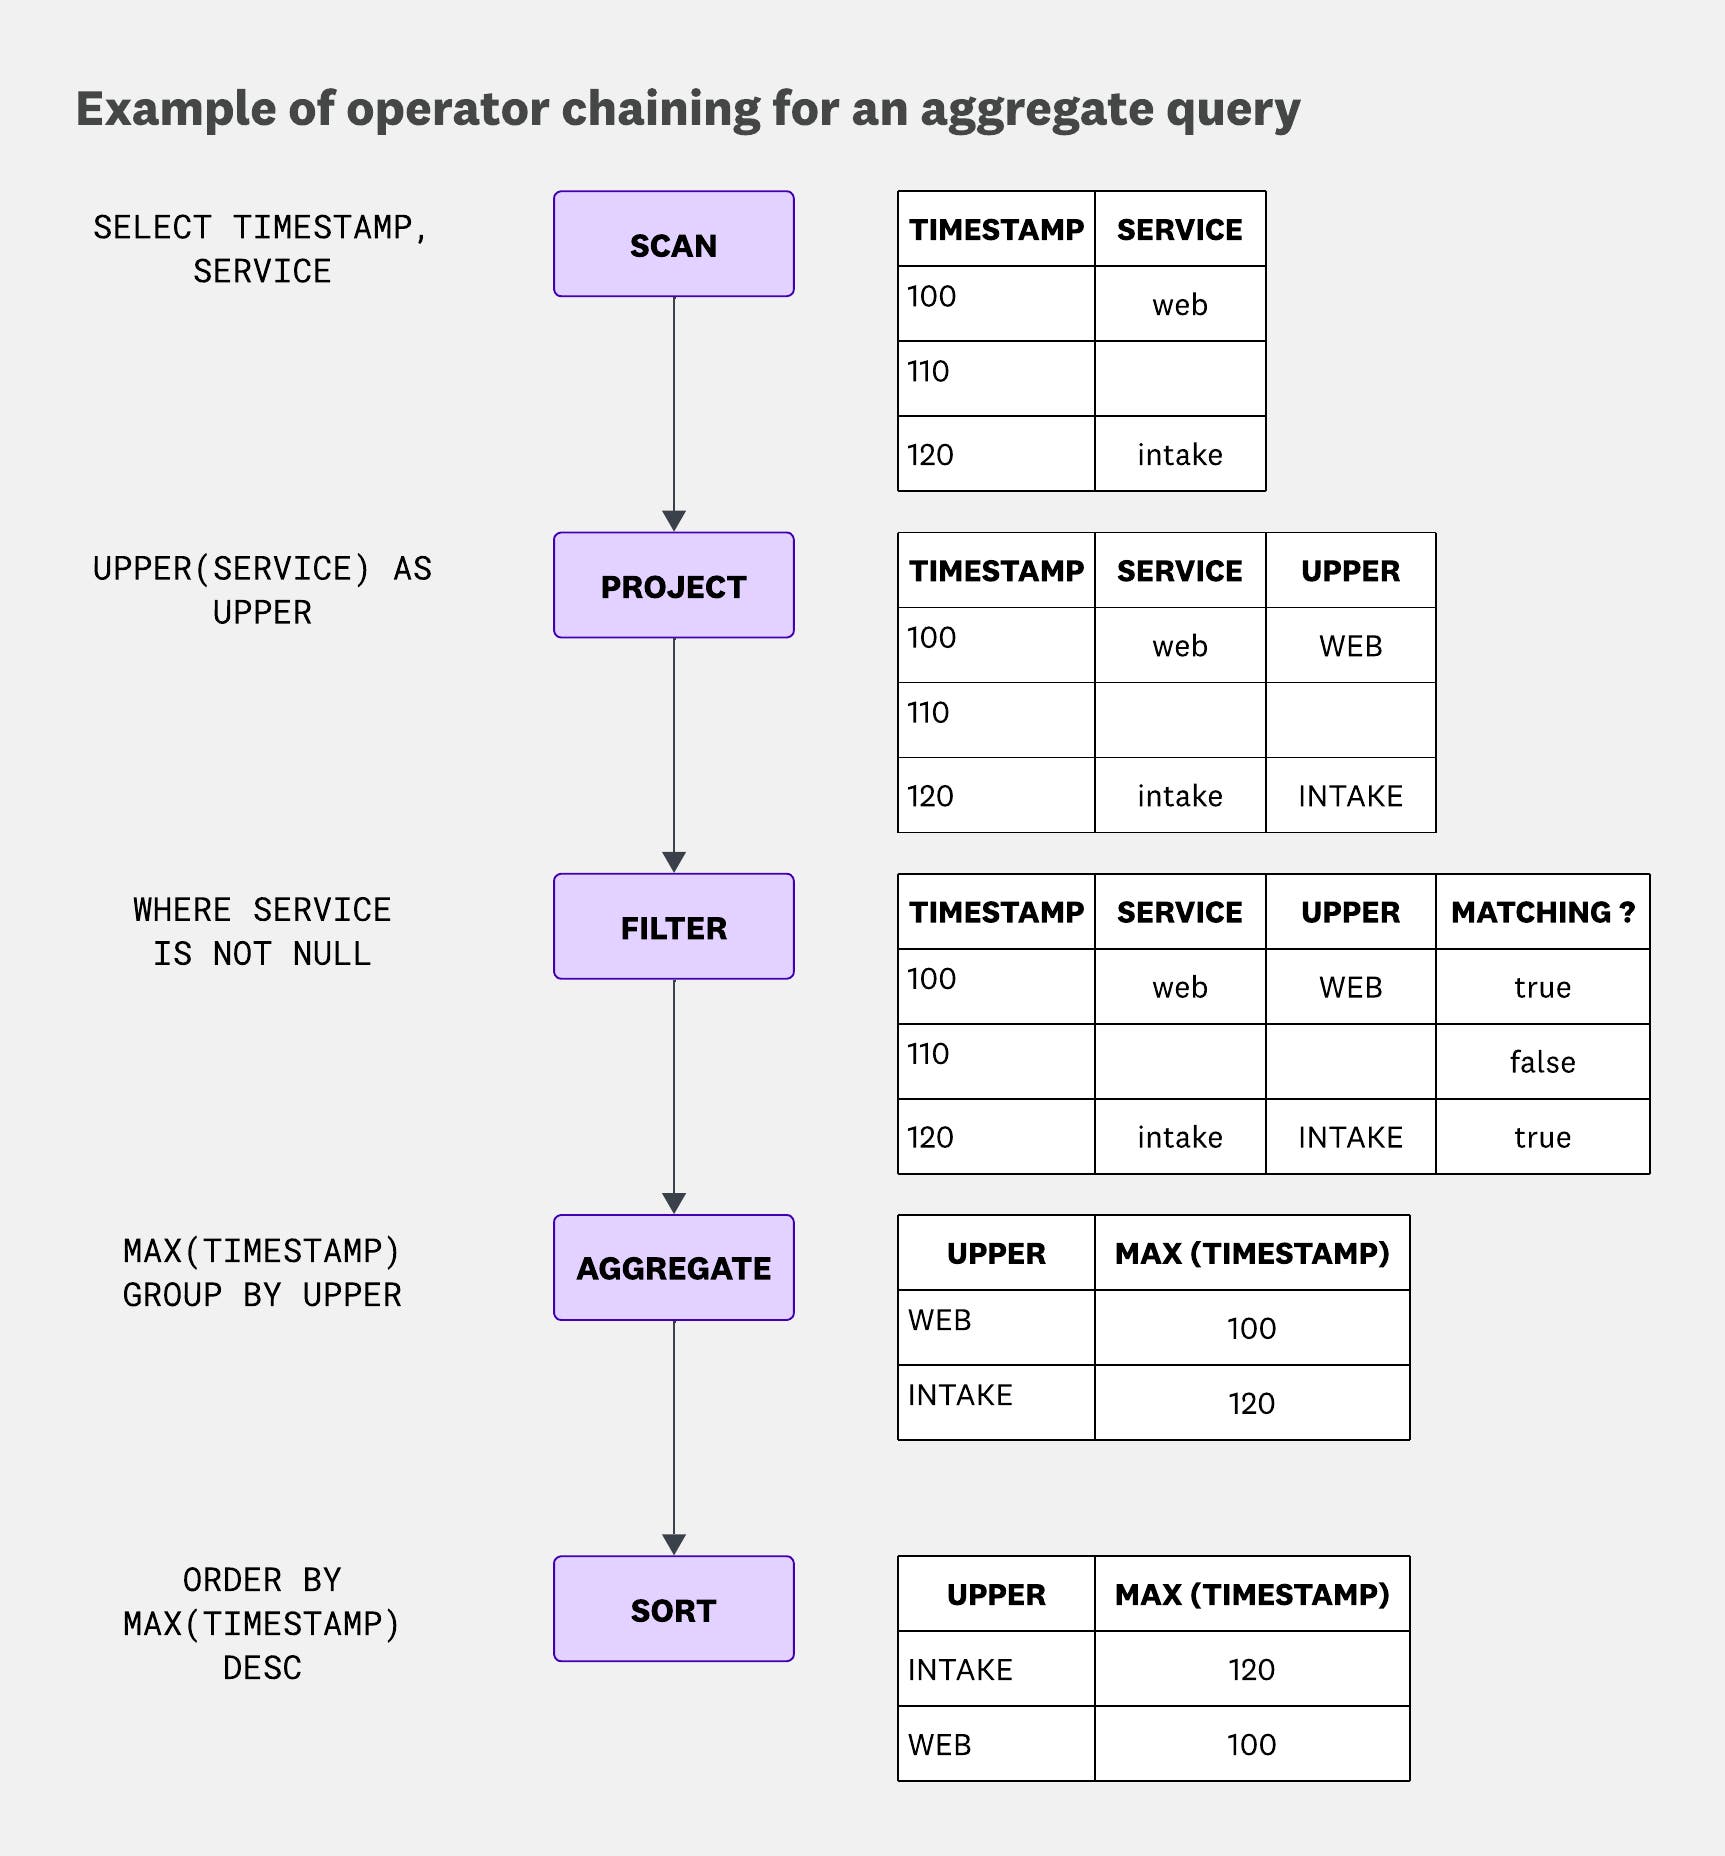
This example shows how operators are chained together during query execution. Each operator is nested within another operator and simply calls next on it. The only outlier is the aggregate operator, which has to consume its entire input by repeatedly calling next until it’s exhausted.
While it’s not shown in the example, this model enables a few useful behaviors:
- Parallel execution, by running multiple “pipelines” in parallel
- Operator reordering, since the only contract between operators is to yield results—nothing prevents us from, say, filtering before projecting, or even after aggregating, as long as the query semantics are preserved
In our case, whenever the scan operator is called to yield the next results, it will read the next row group from the fragment along with the scanned columns. But there’s a small quirk: it doesn’t immediately read or decode the data. Instead, it returns a lazy reference to the row group. Nothing is actually read or decoded until the data is accessed.
This lazy behavior is especially beneficial in two situations:
- Efficient filtering: Row group metadata, such as min/max values for each column, allows the system to quickly eliminate entire row groups during filtering.
- Optimized multi-filter evaluation: When a query includes multiple filters, a cost-based optimizer evaluates the cheapest predicates first. If those filters rule out all matching rows, the system can skip decoding the unaccessed columns in that row group, saving compute and I/O.
Those two scenarios are shown in the following diagram, considering the query:
SELECT COUNT(*)WHERE service = "intake" AND duration > 10 AND datacenter LIKE '%prod%'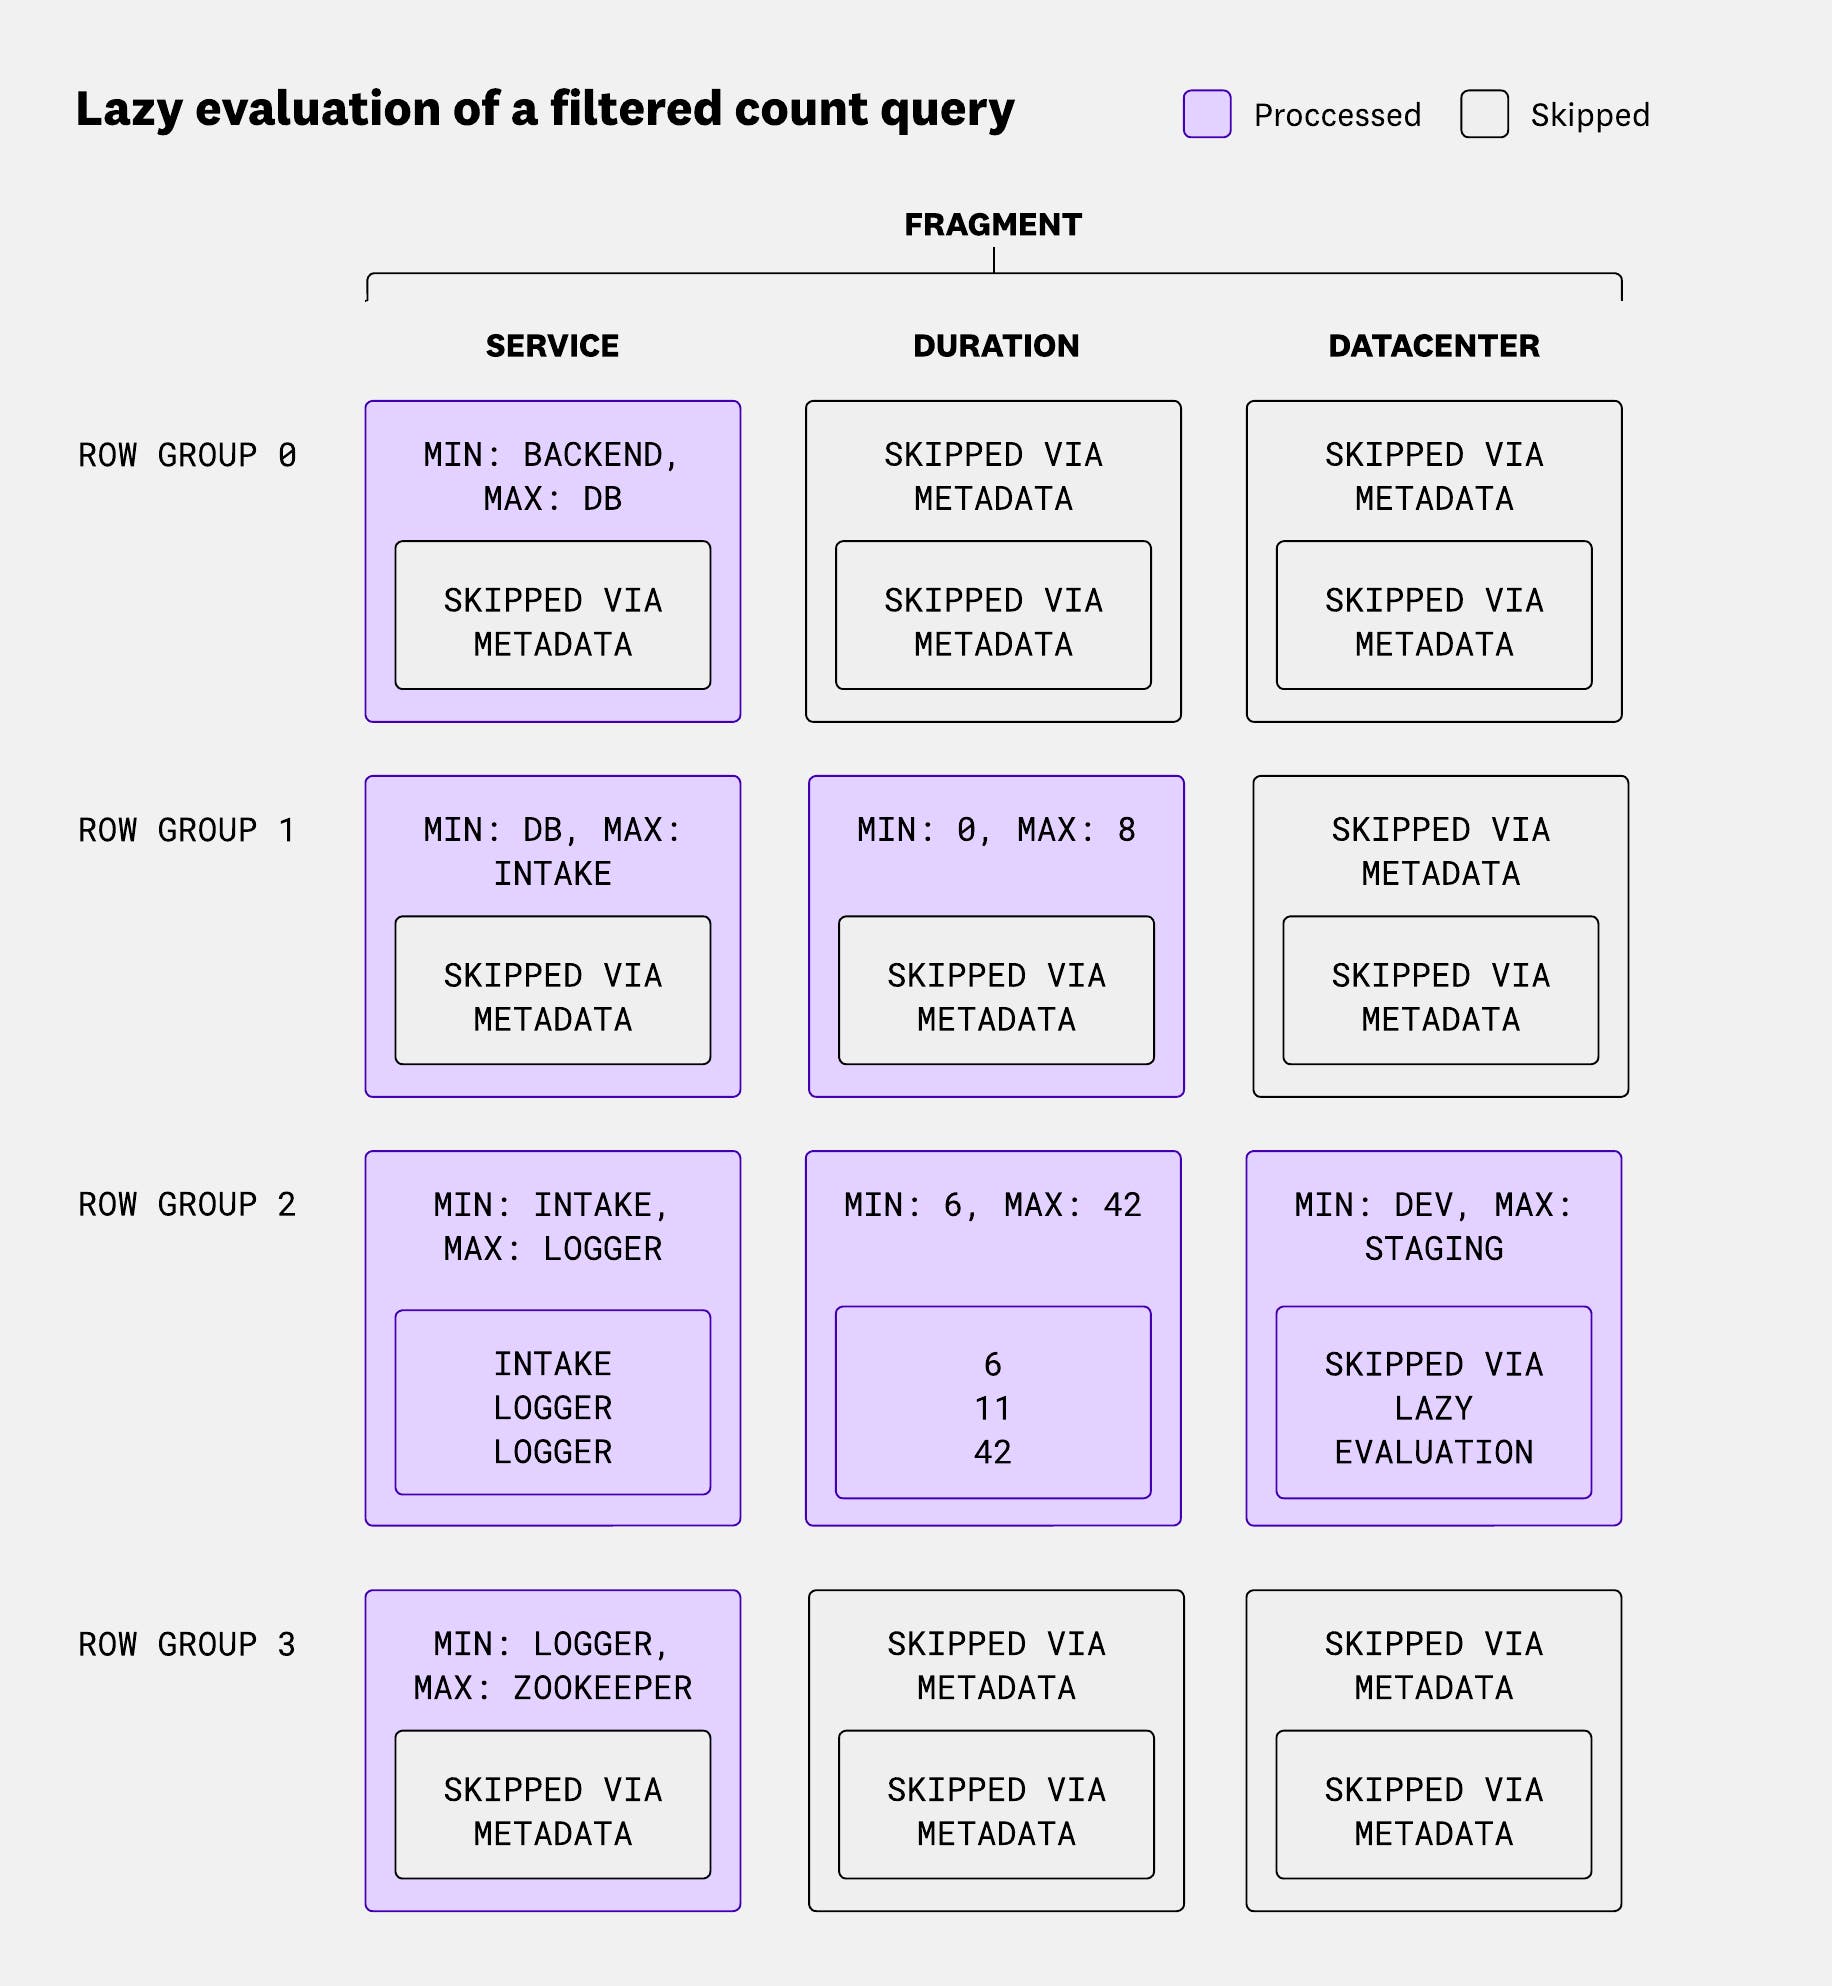
The diagram above shows how the reader evaluates each row group in sequence:
- Row group 0: Checks service metadata and determines no rows will match. There’s a filter on
service = "intake"while the min isbackendand the max isdb. - Row group 1: Evaluates service metadata (inconclusive), then duration metadata, which rules out matches. The filter on
duration > 10cannot match rows where duration is in[0, 10]. - Row group 2: Evaluates service, duration, and data center metadata. Only after decoding service values does one row appear to match, but duration eliminates it.
- Row group 3: Evaluates service metadata and determines no rows will match.
On top of that, keeping row groups small—just a few hundred rows—helps ensure that the data fits within CPU caches. And because operators are simple, the compiler can apply vectorized instructions for common operations over lists of values.
Text search
Husky also provides text search capabilities, which is mainly used by Datadog’s Log Management product. Text search allows users to look for terms, sequences of terms, or even wildcards across multiple fields within their events—whereas a regular attribute search such as key:value would only match values within a specific attribute.
This is especially useful when users are searching for something like an IP address, an error message, or a request ID—but aren’t sure where in their logs it might appear: in the message, in the tags, or buried in a deeply nested attribute.
There are two flavors of text search in Husky:
- Standard text search looks only in common textual attributes—like the log message, title, or its
error.stacktrace. For example, a search likelogin errorwould match events containing both “login” and “error” in those fields. - Full text search (FTS) looks across all attributes in the event. A search like
*:login *:errorwill search across every field, not just the usual text ones.
Text search queries in Husky are served via additional files that we call segments, which are attached to fragments. Each segment stores:
- Posting lists of the terms present in the events, which are used to answer term search queries—for example,
login erroror*:login *:error. - N-grams for the terms, which are used to answer wildcard queries such as
request*. N-grams alone are not enough to answer these queries, but they help narrow down the search space by quickly filtering out events that won’t match.
Each term—whether a full word or an n-gram—maps to two posting lists (stored as bitsets): one for standard text fields (like message) and one for all other fields. These support full text search.
Given the following rows:
| Row index | Message | Service |
|---|---|---|
| 0 | Error during startup | error-tracking |
| 1 | Login error for user | gateway |
| 2 | Hello from husky ! | query-planner |
| 3 | Login was successful | gateway |
| 4 | query from user dog | query-planner |
| 5 | reader worker is unavailable | query-orchestrator |
We would generate the posting lists:
| Term | Standard text fields | All other fields |
|---|---|---|
| dog | 4 | |
| during | 0 | |
| error | 0, 1 | 0 |
| for | 1 | |
| from | 2, 4 | |
| gateway | 1, 3 | |
| hello | 2 | |
| husky | 2 | |
| is | 5 | |
| login | 1, 3 | |
| orchestrator | 5 | |
| planner | 2, 4 | |
| query | 4 | 2, 4, 5 |
| reader | 5 | |
| startup | 0 | |
| successful | 3 | |
| tracking | 0 | |
| unavailable | 5 | |
| user | 1, 4 | |
| was | 3 | |
| worker | 5 |
The following table shows examples of 4-grams extracted from standard and non-standard text fields. Because we store hashed n-grams rather than raw ones, the segment size remains bounded, even though the number of potential n-grams can grow significantly with longer or more varied input terms.
| Term | Standard text fields | All other fields |
|---|---|---|
| acki | 0 | |
| aila | 5 | |
| anne | 2, 4 | |
| artu | 0 | |
| atew | 1, 3 | |
| avai | 5 | |
| cces | 3 | |
| cess | 3 | |
| ches | 5 | |
| ckin | 0 | |
| duri | 0 | |
| eade | 5 | |
| erro | 0, 1 | 0 |
| essf | 3 | |
| estr | 5 | |
| gate | 1, 3 | |
| hell | 2 | |
| hest | 5 | |
| husk | 2 | |
| ilab | 5 | |
| labl | 5 | |
| lann | 2, 4 | |
| logi | 1, 3 | |
| nava | 5 | |
| orch | 5 | |
| orke | 5 | |
| plan | 2, 4 | |
| quer | 4 | 2, 4, 5 |
| rack | 0 | |
| rato | 5 | |
| rche | 5 | |
| read | 5 | |
| ssfu | 3 | |
| star | 0 | |
| stra | 5 | |
| succ | 3 | |
| tart | 0 | |
| tewa | 1, 3 | |
| trac | 0 | |
| trat | 5 | |
| ucce | 3 | |
| unav | 5 | |
| urin | 0 | |
| vail | 5 | |
| work | 5 |
To limit the size of segments, we don’t store posting lists per raw n-grams. Instead, we hash the n-grams and store posting lists by hash. We also cap the maximum number n-grams we store per segment using a configurable knob.
The downside of hashing n-grams is the possibility of false positives—but that’s fine in this case, since n-grams are only used to speed up wildcard queries, not to guarantee exact matches.
These bitsets are then used at query time to rewrite predicates. Continuing the previous fragment example, a query such as (login AND error) OR unavailable would be rewritten as:
(row in [1, 3] AND row in [0, 1]) OR row in [5]- Reduced into
row in [1] OR row in [5] - Reduced into
row in [1, 5]
Caches
Husky relies heavily on caching to keep queries fast and cost-effective. While the system uses many different caches, we will focus on the three most impactful ones: result cache, blob range cache, and predicate cache.
When talking about caching, it’s hard not to bring up the well-known adage in computer science: There are only two hard things in computer science: cache invalidation, naming things, and off-by-one errors.
Husky leans on the immutability of its underlying data for efficient caching, avoiding the challenges typically associated with cache invalidation. Although updates, deletions, and background compactions happen (a topic for another time), the data referenced during a query doesn’t change and results remain consistent. Each piece of fragment metadata points to a static dataset—so if the metadata is unchanged, the data behind it is, too. This eliminates cache invalidation complexities and ensures data freshness.
Immutability is also key to our shadowing system, which compares historical data with real-time ingestion to detect regressions in new versions. Because the historical data snapshot is immutable, any discrepancies between the shadowed and live results indicate an issue in either the old or the new version.
Result cache
The reader service uses a straightforward cache that stores the results of prior queries at the fragment level. It lives in memory but is also persisted to disk, so results survive across service restarts.
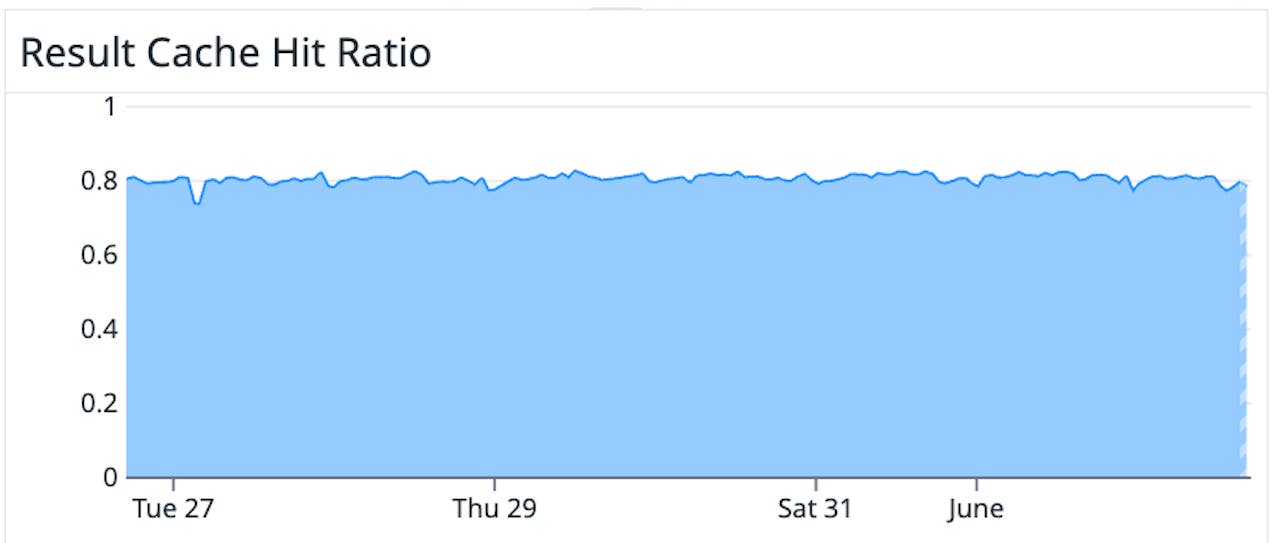
Despite its simplicity, the results cache hits about 80% of the time. This result isn’t surprising given Datadog’s query patterns:
- Automatic refreshes from the UI: time is slightly shifted but there’s overlap with the previously queried time range
- Repeated monitor queries
- Dashboard widgets that frequently share similar filters, leading to identical fragment-level queries
Blob range cache
The reader blob range cache operates at the blob-storage level, caching chunks of data retrieved from the storage service. We use RocksDB for storing the data of this cache.
Every time we try to fetch data from blob storage, we run a simple heuristic to decide whether the result is cacheable. The most common reasons to skip caching are size constraints and disk throttling. If we detect that disk I/O is maxed out and latency starts to degrade, we bypass the cache and fall back to network I/O—hitting the blob store directly.
This cache also uses a logic similar to the singleflight library. Since only a subset of the columns is typically queried, it’s common for a node to see multiple concurrent queries for the same data. Rather than issuing separate I/O calls for each one, the cache deduplicates the calls into a single read—reducing disk pressure even further.
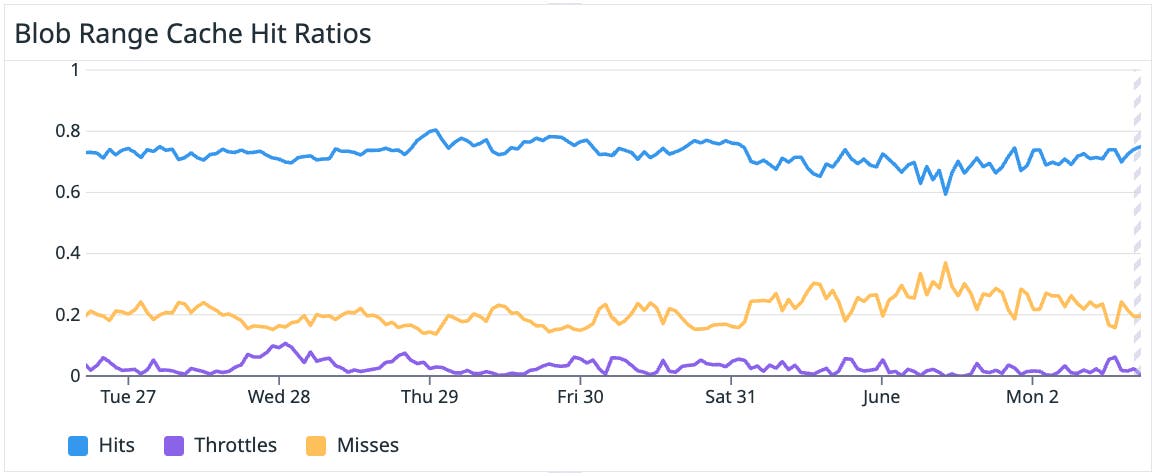
The blob range cache has a hit ratio of around 70%.
Predicate cache
This cache came out of an observation about how people search events in Datadog: they tend to progressively refine their queries by adding more and more filters. A user might start with a broad filter like service:foo, then narrow it down with env:prod, and then add status:error. Certain filters—like those tied to dashboard template variables or Role-Based Access Control (RBAC) settings—also appear repeatedly in different queries.
Caching these individual predicates can be challenging because of how much they vary. So instead of trying to cache everything, we focus on the ones that are expensive to compute and most likely to appear again.
The predicate cache runs per fragment, per reader node. It measures the cost of evaluating each predicate over time, then periodically picks the top N% of the most expensive ones to cache. For each selected predicate, it stores a bitset of the matching rows in the current fragment.
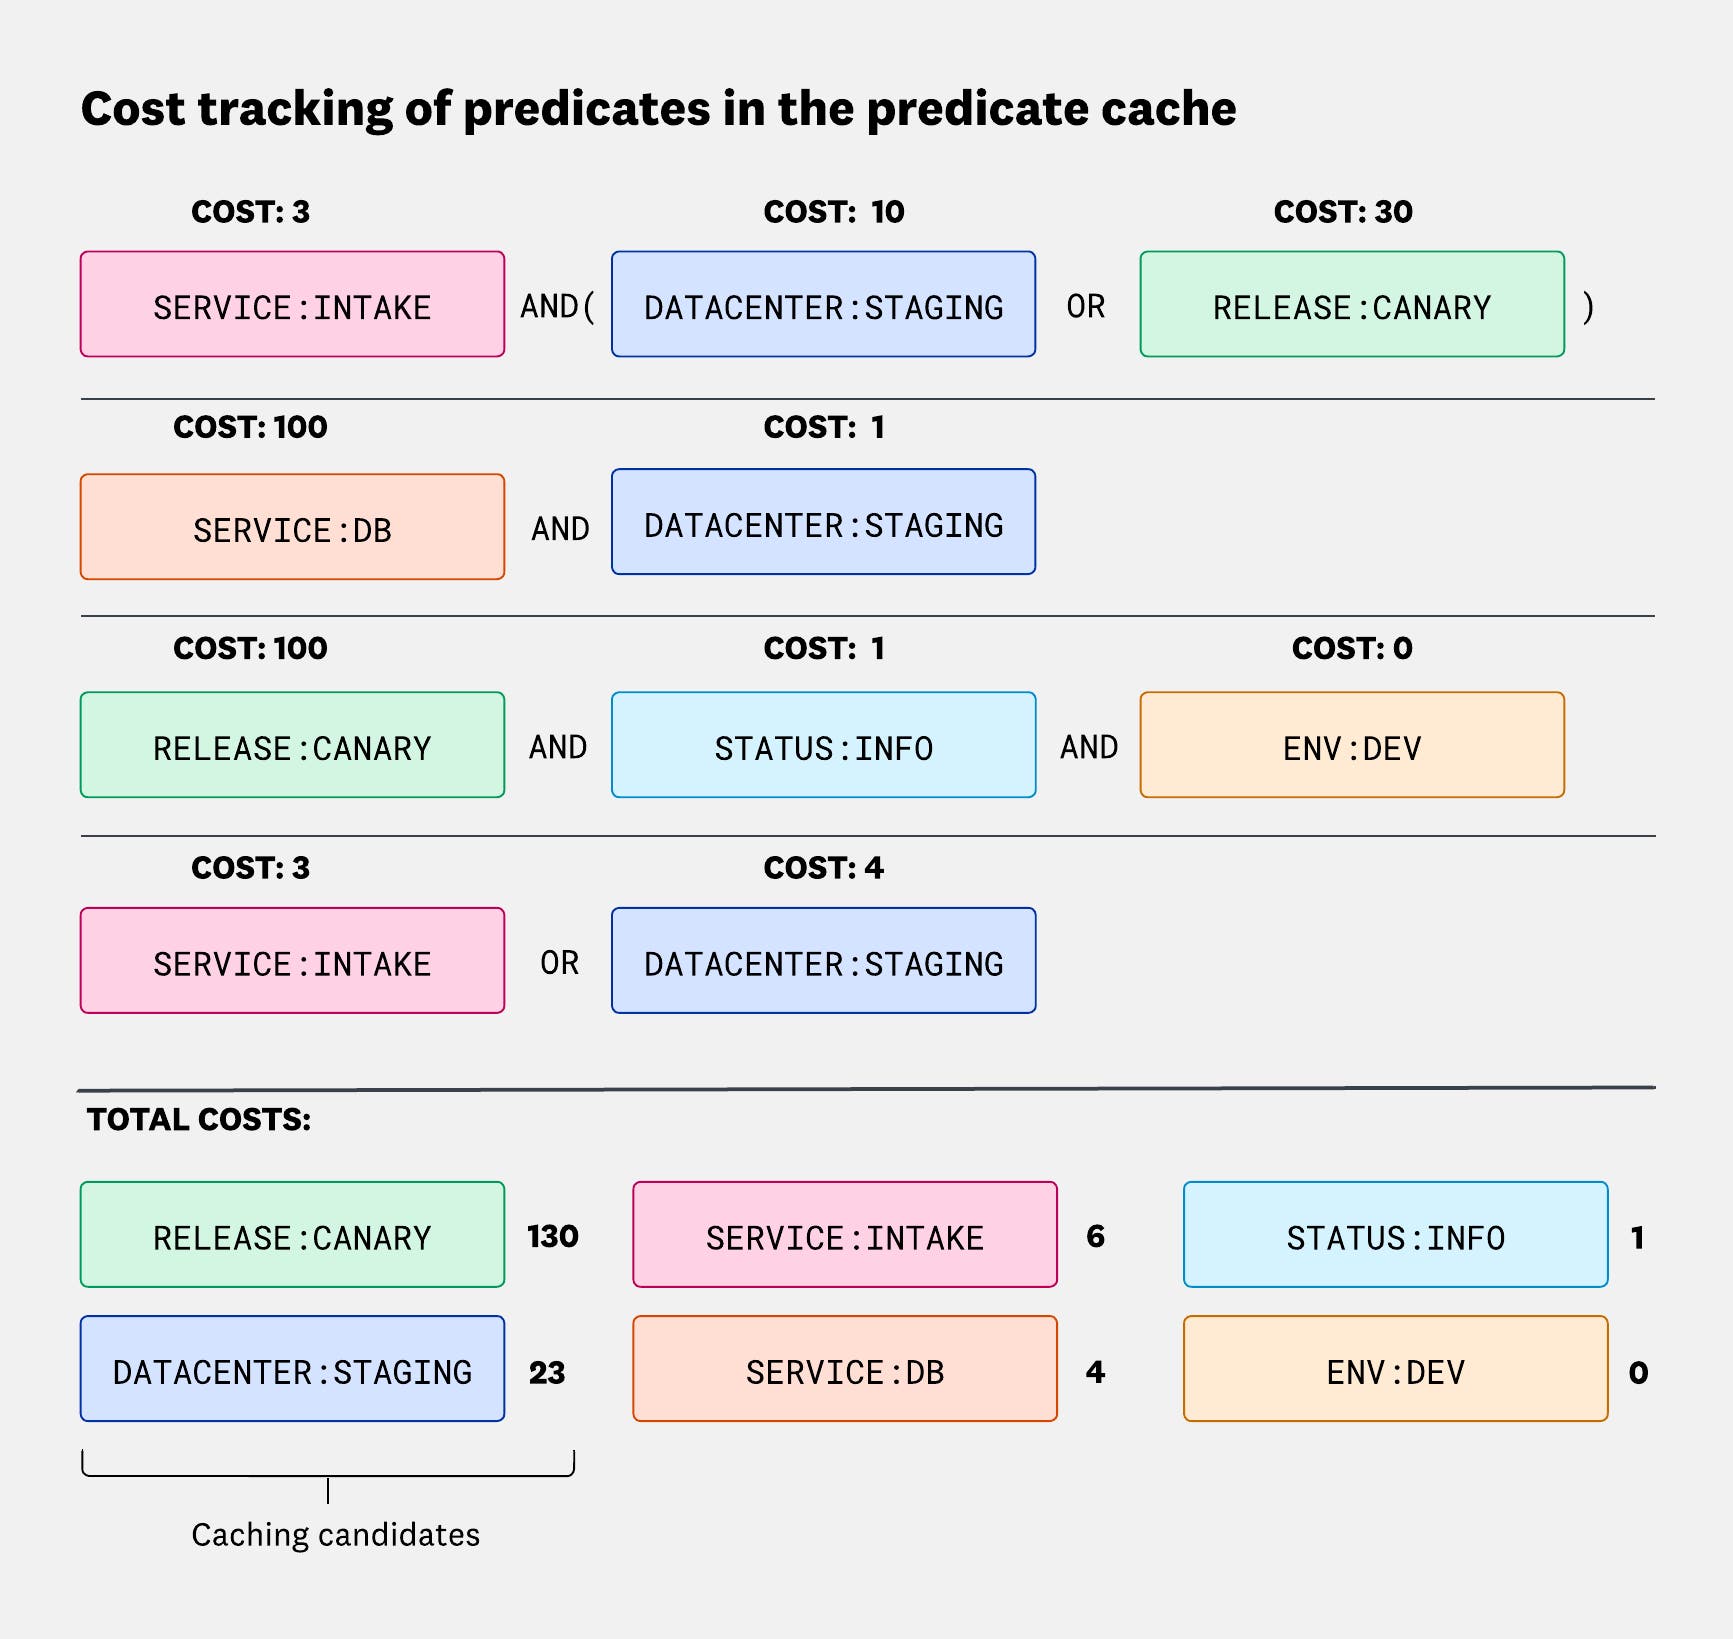
Predicate cost isn’t fixed—it depends entirely on execution cost. As we saw with the lazy evaluation through row group headers, a single predicate might be evaluated on just one row group in one query, but on 10 row groups in another. So the cost assigned to that predicate will be higher in the second case.
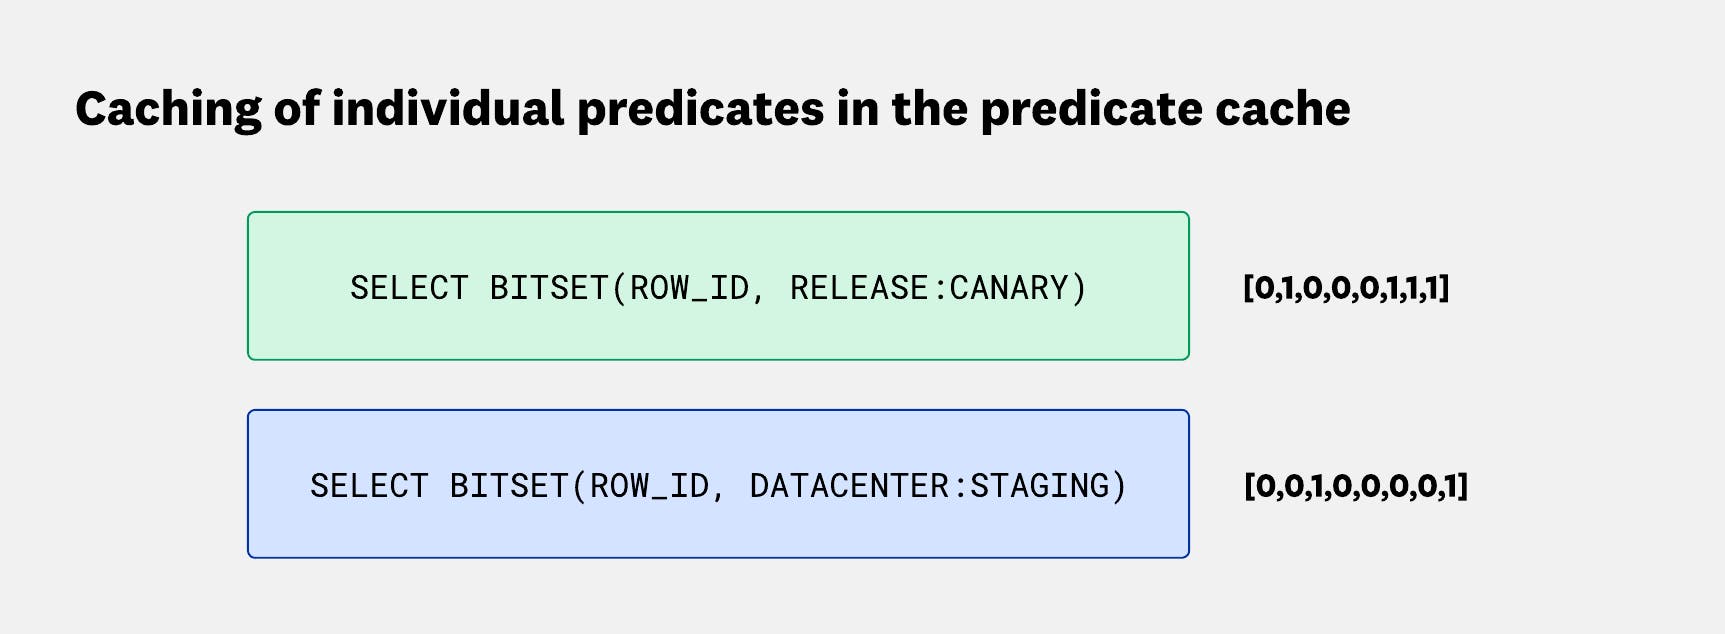
When a new query is received, the reader replaces predicates such as service:foo with the corresponding bitset. This speeds up execution by skipping filter evaluation, and if the column was only required for the filter, the reader doesn’t even need to fetch the column in question.
![Diagram showing how the predicate cache replaces query predicates with bitsets. For example, datacenter:staging* AND env:dev becomes row in [0,0,1,0,0,0,0,1] AND env:dev. A more complex query, (datacenter:staging* OR release:*canary) AND status:info, is rewritten as a combination of row-level bitsets, which can then be collapsed into a single bitset before applying the status:info predicate. Diagram showing how the predicate cache replaces query predicates with bitsets. For example, datacenter:staging* AND env:dev becomes row in [0,0,1,0,0,0,0,1] AND env:dev. A more complex query, (datacenter:staging* OR release:*canary) AND status:info, is rewritten as a combination of row-level bitsets, which can then be collapsed into a single bitset before applying the status:info predicate.](https://blog.dd-static.net/img/blog/engineering/husky-query-architecture/husky-query-architecture-f12-v4.png?auto=compress%2Cformat&cs=origin&lossless=true&fit=max&q=75&dpr=1)
This combines with the query reduction we get from segment resolution when answering text search queries, as described previously. Bitsets from the predicate cache and the segment index can be combined to further reduce what needs to be scanned.
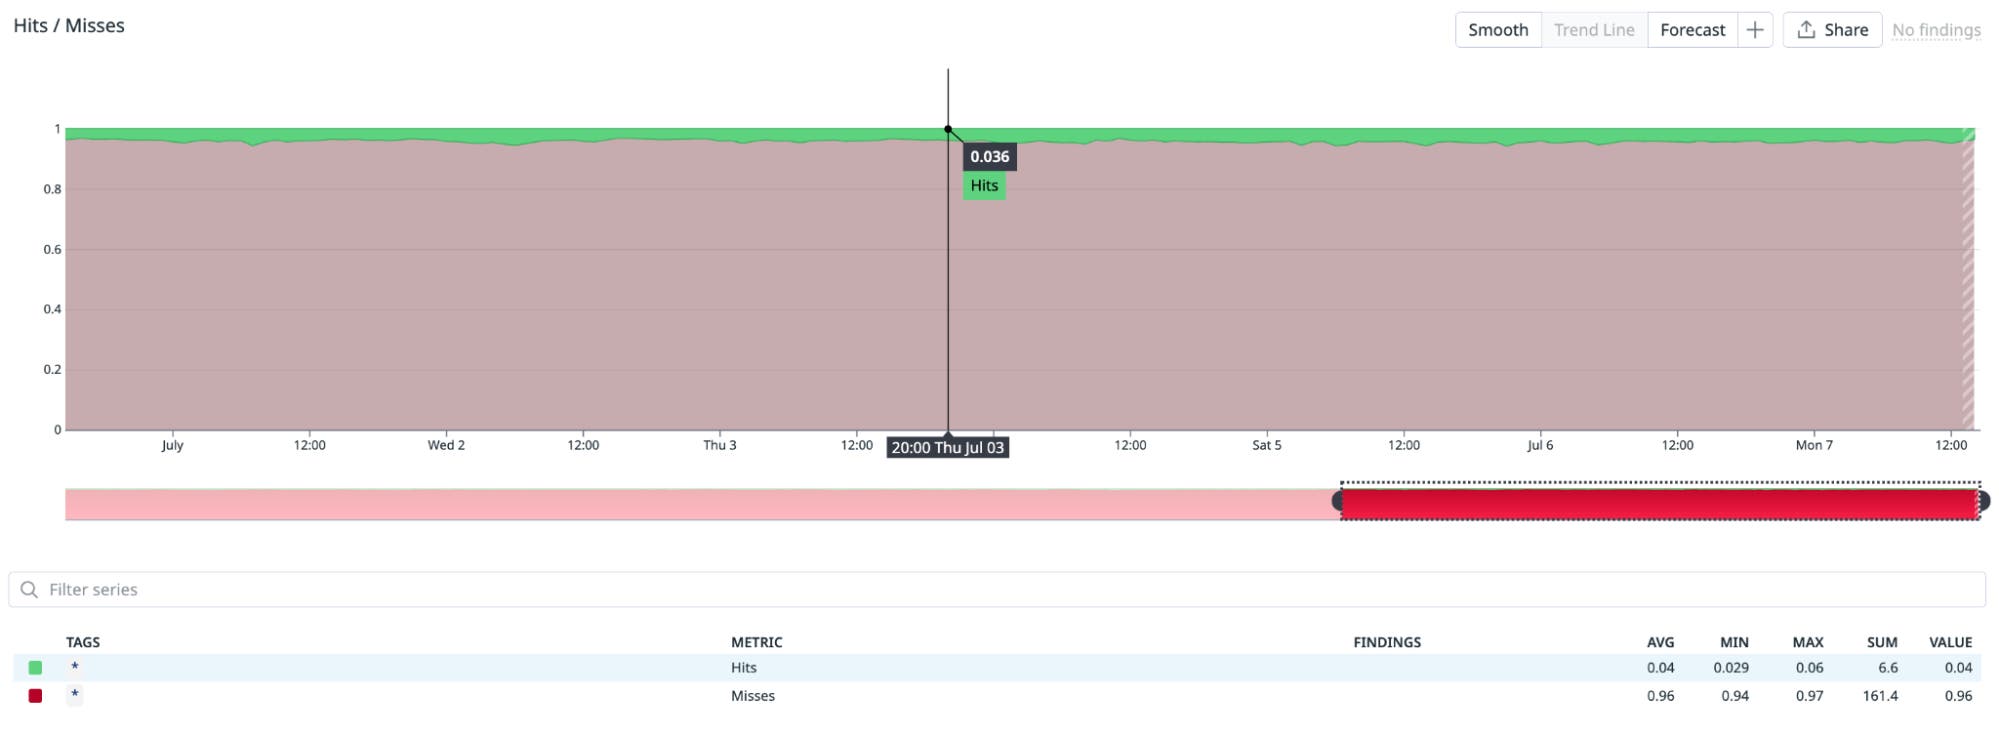
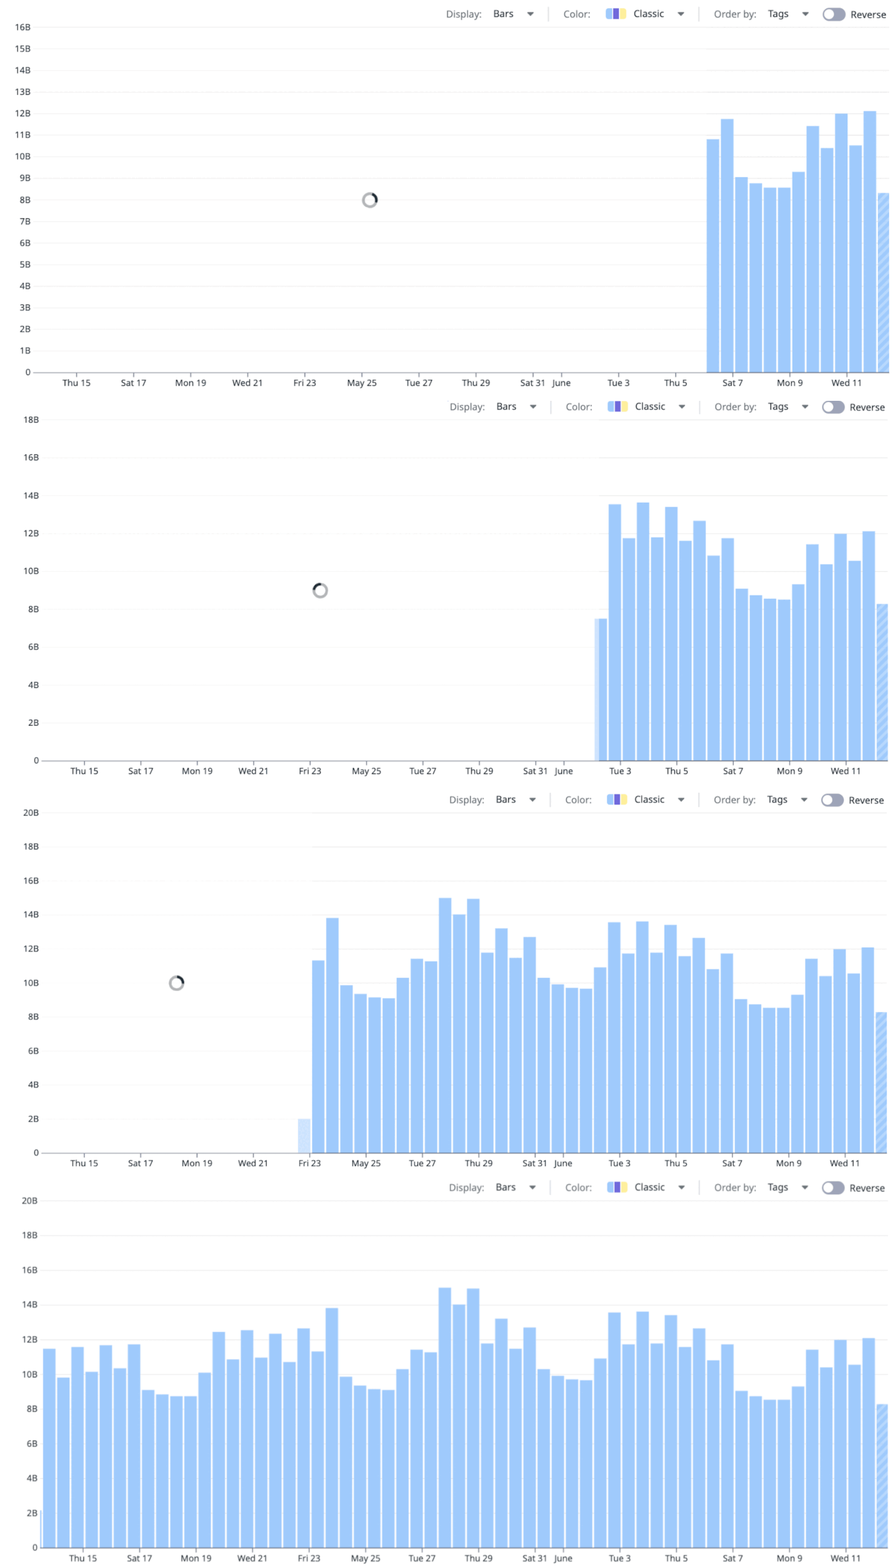
What might be surprising is that this cache has a very low hit ratio—around 3%—as shown in the following screenshot:
But its efficiency—defined as the amount of work saved when we hit the cache, divided by the time spent building the cache entry—is surprisingly high: around 11. You can see that in the screenshot below:

That means on average, each cached predicate ends up saving 10 times more CPU work than it costs to cache it.
All of these optimizations—row groups, text search, caching—stack up to one big outcome: most queries don’t actually need to read much data. Here’s how that looks in practice.
Pruning
If we look at the number of fragment queries that are pruned by the mechanisms we have discussed so far, we see that only a small fraction of queries actually need to perform real CPU work—and even fewer need to fetch data from blob storage:
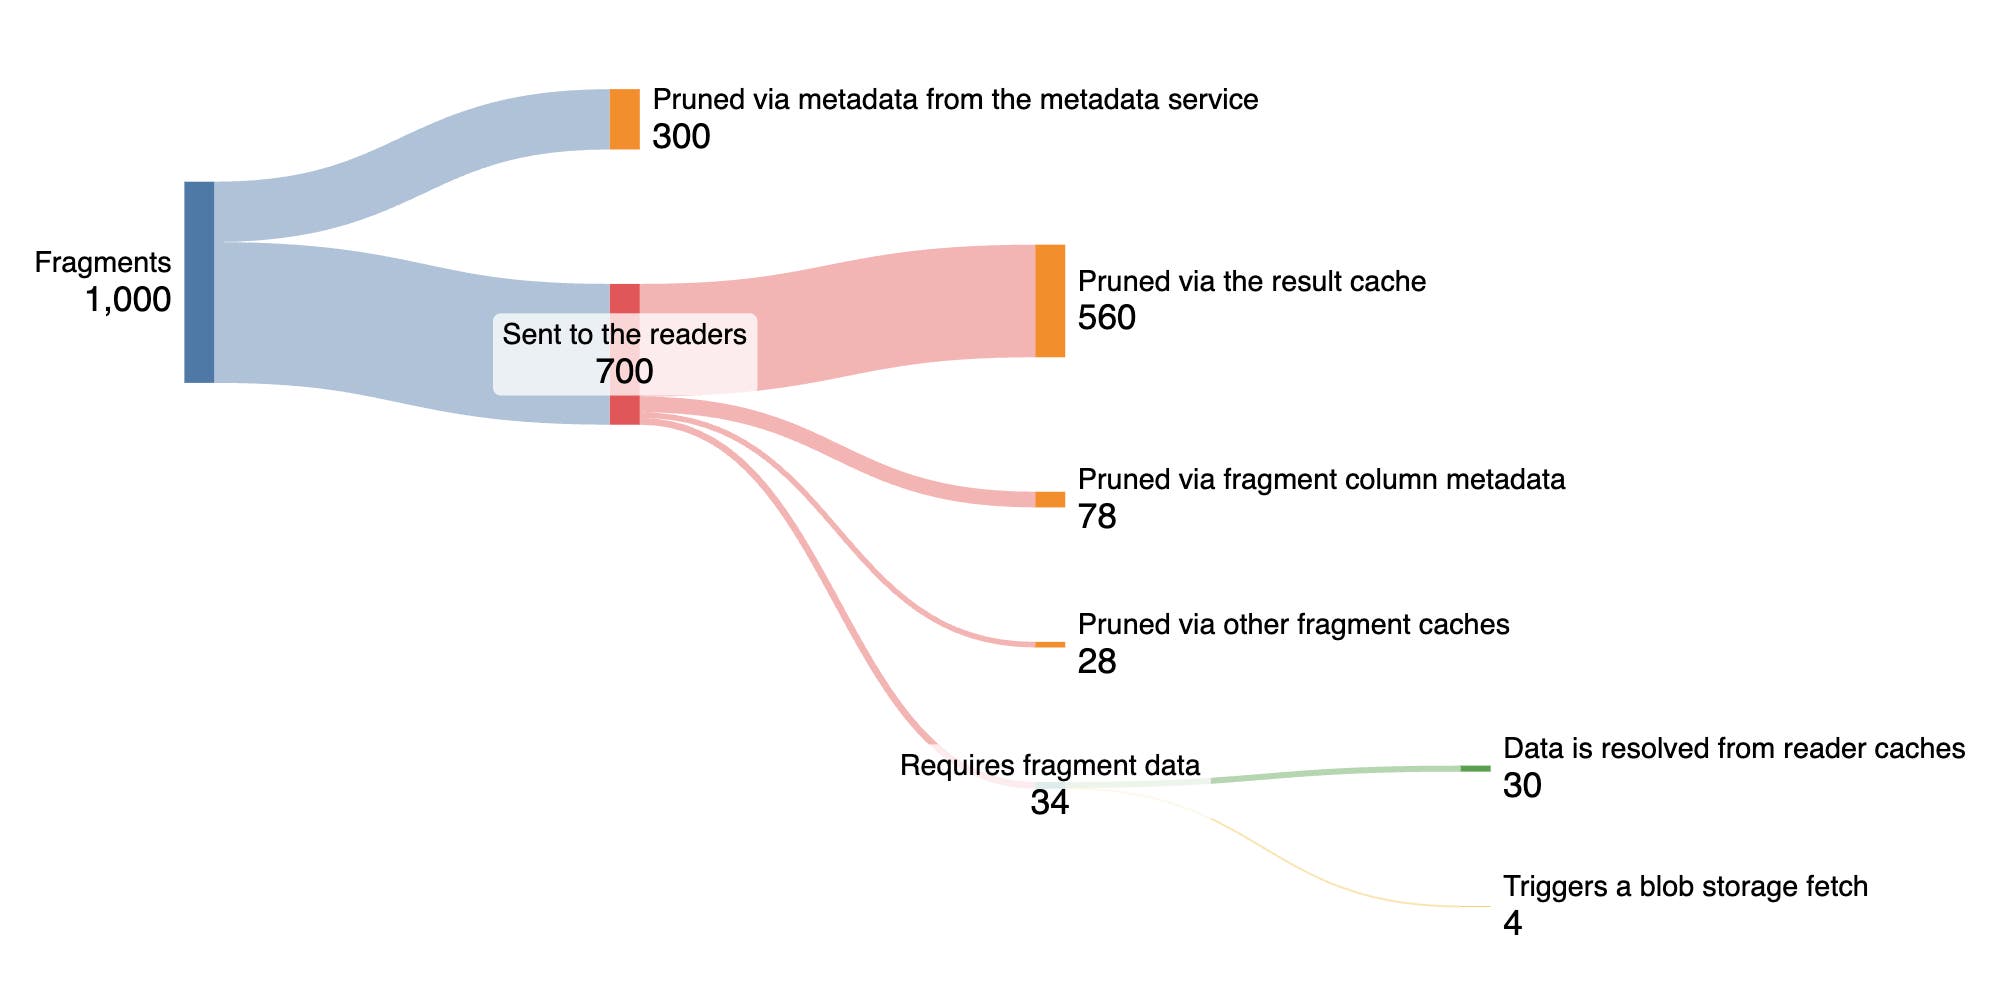
Out of 1,000 sample queries:
- 300 are pruned at the metadata service level, using pruning regexes generated during locality compaction.
- 700 are dispatched to reader nodes. Of those:
- 560 are pruned by the result cache through a simple in-memory lookup.
- 78 are pruned using fragment column metadata, which tells us:
- What columns exist in the fragment—so if a query asks for
@requestId:abcbut the fragment doesn’t include@requestId, we can return an empty result immediately. - Value-level metadata, such as the min/max values or the explicit value lists, if they’re small enough.
- What columns exist in the fragment—so if a query asks for
- 28 are pruned via other fragment-level caches, such as:
- Posting lists from text search segments.
- The predicate cache, if the user’s query can be fully reduced to
NO_MATCHor toMATCH_ALLforSELECT COUNT(*)queries.
- 34 queries require reading actual fragment data:
- 30 only read data from the reader’s local cache (only incurring disk I/O for the part that is stored on disk).
- 4 trigger a real blob storage read.
So in total, only 3.4% of queries end up scanning real data, and just 0.4% of them need to hit blob storage.
This doesn’t even account for time filtering. Because fragments are partitioned by time in the metadata service, we can quickly narrow the search to only those that intersect with the query’s time range.
Interactive performance at massive scale
Ensuring query isolation and routing consistency
The bulk of the work queries need to perform is done in the reader service, so having good isolation there is important—both to avoid poison-pill queries and to protect against noisy neighbors. In an ideal scenario, each tenant would get its own dedicated resources, but that would lead to a lot of wasted resources. Most reader workers would be idle all the time. Instead, we want to maximize resource reuse by colocating tenants.
It’s also important to have consistent routing between the query orchestrator and the reader. As we saw in the caching section, many of our caches live at the reader level and they’re local to each node. So the stickier the routing, the better the cache hit rate, the lower the cost, and the faster the queries.
The routing strategy we aim for needs to balance three properties:
- Affinity: Requests for a given fragment should always be routed to the same node. This ensures we benefit from the reader-level caches. This should also remain stable across reader service scaling events.
- Load balancing: Query load should be spread evenly across reader nodes for cost reasons, to avoid having some idle while others are crunching through data.
- Tenant isolation: Expensive queries from one tenant should not be able to degrade performance for everyone else.
A naive approach would be to route queries in a simple round-robin across all reader workers. That would get us proper load balancing—but not consistency or tenant isolation.
A more sophisticated approach is consistent hashing, which brings both load balancing and affinity. However, tenant isolation still falls short: since routing is based on fragment ID, each tenant would have access to all the workers.
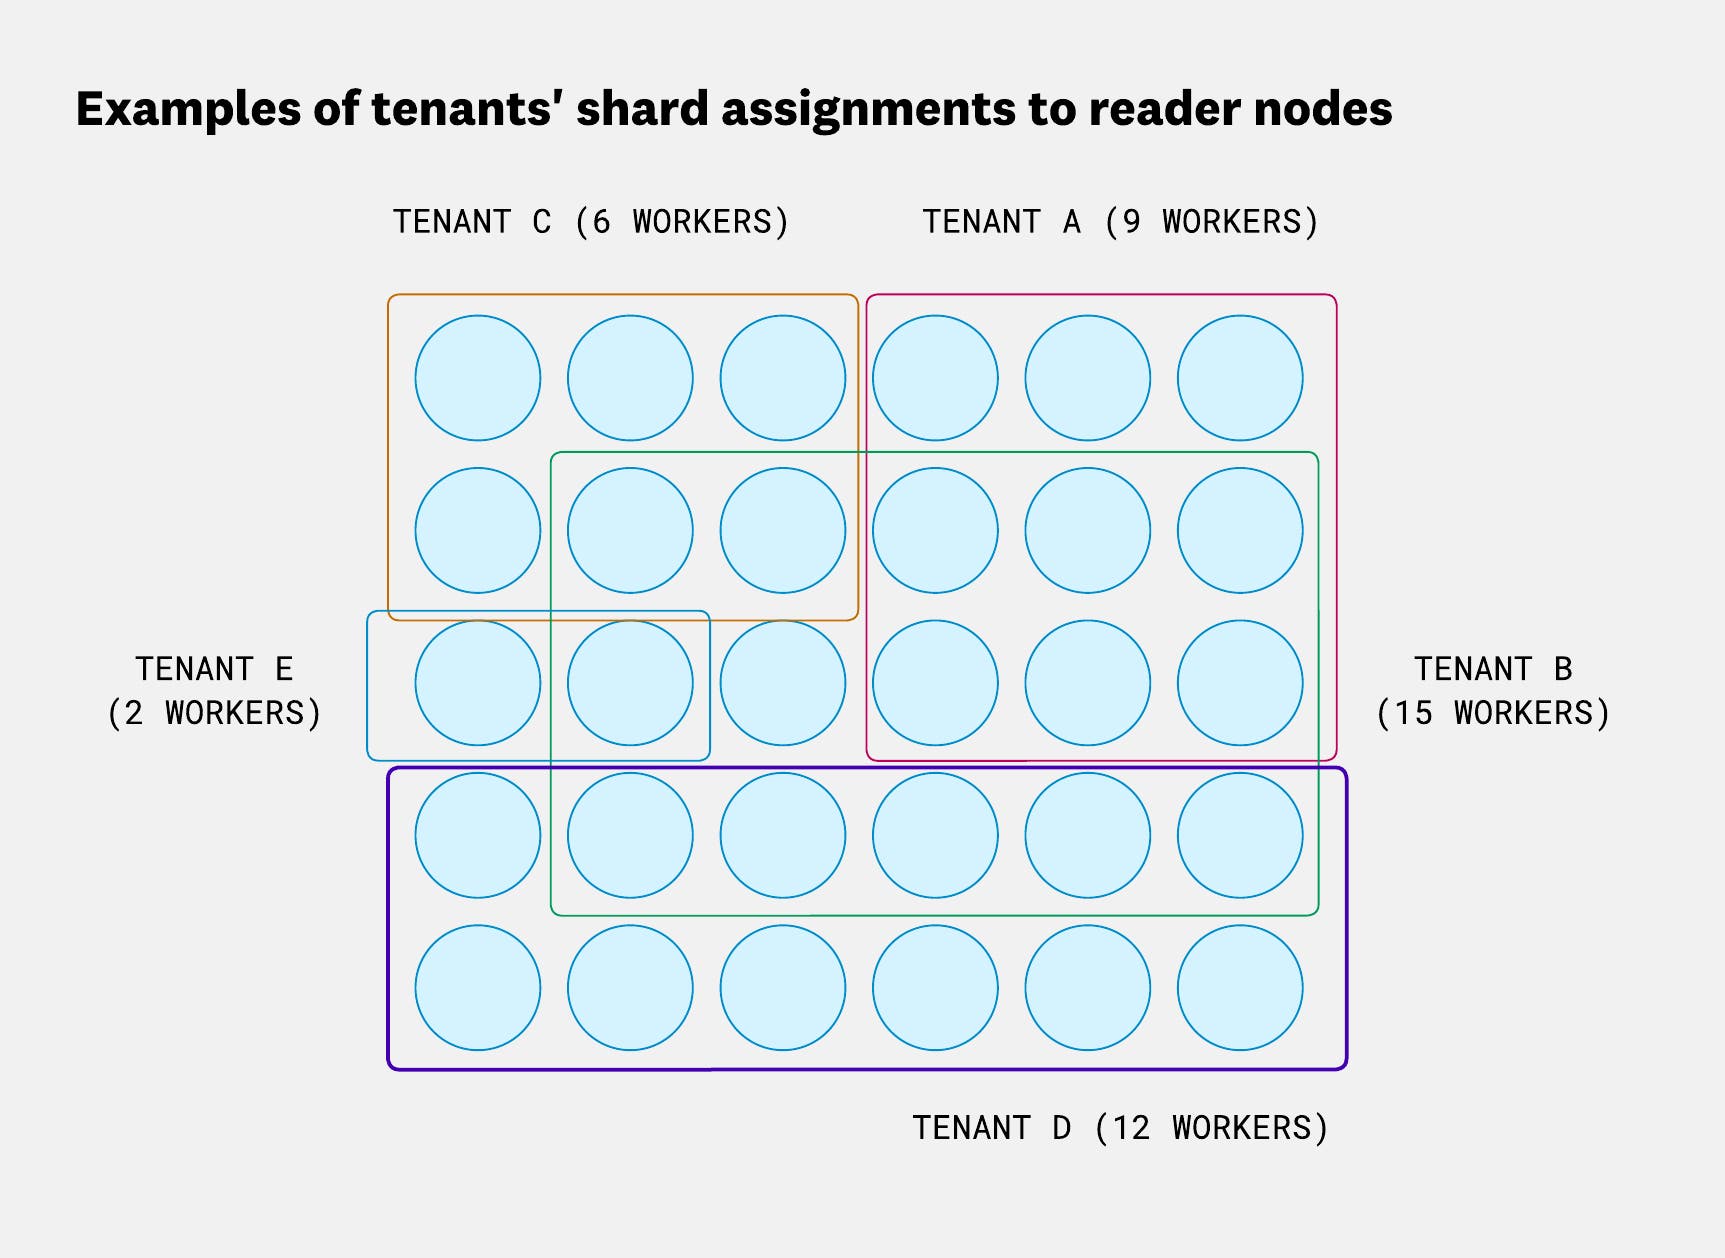
To achieve affinity, load balancing, and tenant isolation, we use a mechanism called shuffle sharding. Shuffle sharding isn’t a new idea (AWS explains it well). Instead of routing by fragment ID across all workers, we assign a subset of nodes (a “shard”) to each tenant, and consistently route queries to that shard based on fragment ID.
In the AWS example, shard size is fixed and uniform across tenants. However, in our case, we don’t want all the tenants to have access to the same amount of workers. So in Husky, each tenant has a configurable shard size, which controls how many workers are assigned to their shard. That size is inferred from their usage patterns.
Note that our reader pools are typically large:
- Horizontally, to fit many tenants with minimal shard overlap
- Vertically, with ample storage and disk to make caching effective
This content hashing scheme also helps in another important area: load soaking for new nodes. As we saw in the caching section, caching is a cornerstone of Husky’s design—without it, query performance and cost would degrade quickly. A new node entering the sharding ring usually starts with an empty cache and isn’t as performant as other nodes. To account for this, we artificially lower its share in the sharding ring by adjusting the number of virtual nodes representing the physical node. This knob allows us to gradually ramp up traffic to new nodes—without hammering them with expensive queries while their cache is still cold, and without significantly impacting the latency for tenants routed to them.
We use the same share-adjustment strategy to account for the fact that not all nodes are equal—some have better or more processors than others. We want to take that into account when routing queries so we maintain good load balancing across the reader pool.
Finally, we also track the load of each reader in each query orchestrator. This load signal helps us avoid sending queries to nodes that are already overloaded—unless they can answer from cache without performing any work.
If a fragment was supposed to be routed to an overloaded node, a consistently chosen secondary node is used instead, as long as that node isn’t also loaded.
We track load using two mechanisms:
- Each reader response includes its latest load measurement.
- A background routine runs on each query orchestrator to discover new reader workers and their load states.
This process is fully distributed and stateless across all query orchestrator instances.
Streaming partial results for interactive queries
To give users the feel of live, interactive queries, Husky supports streaming partial results.
This is why, in Datadog dashboards, data loads progressively—allowing users to refine their queries faster than if they had to wait for the full results of each query to be collected first:
This interactivity comes from a few mechanisms.
Each query has a job-like interface that allows it to report progress. The frontend—or any other query consumer—can poll this status and get updated results as the query runs. These partial results don’t need to be aggregated with the previous ones; they’re guaranteed to include everything fetched so far.
We also stream results between services instead of making blocking calls. That’s important because a single user-facing query can trigger multiple service calls—often one for each fragment. In Husky, a fragment is a file that contains part of a tenant’s events. However, due to most of the data being cached, the latency distribution of those fragment calls often has a long tail, as shown in the following screenshot:

Long-tail latency can hurt the overall query experience. But streaming allows us to send back the results we’re already finished querying, without waiting for the slowest fragments. For example, the diagram below shows a trace-like view of a query execution and each block represents a fragment query. The longer the span, the slower the query:
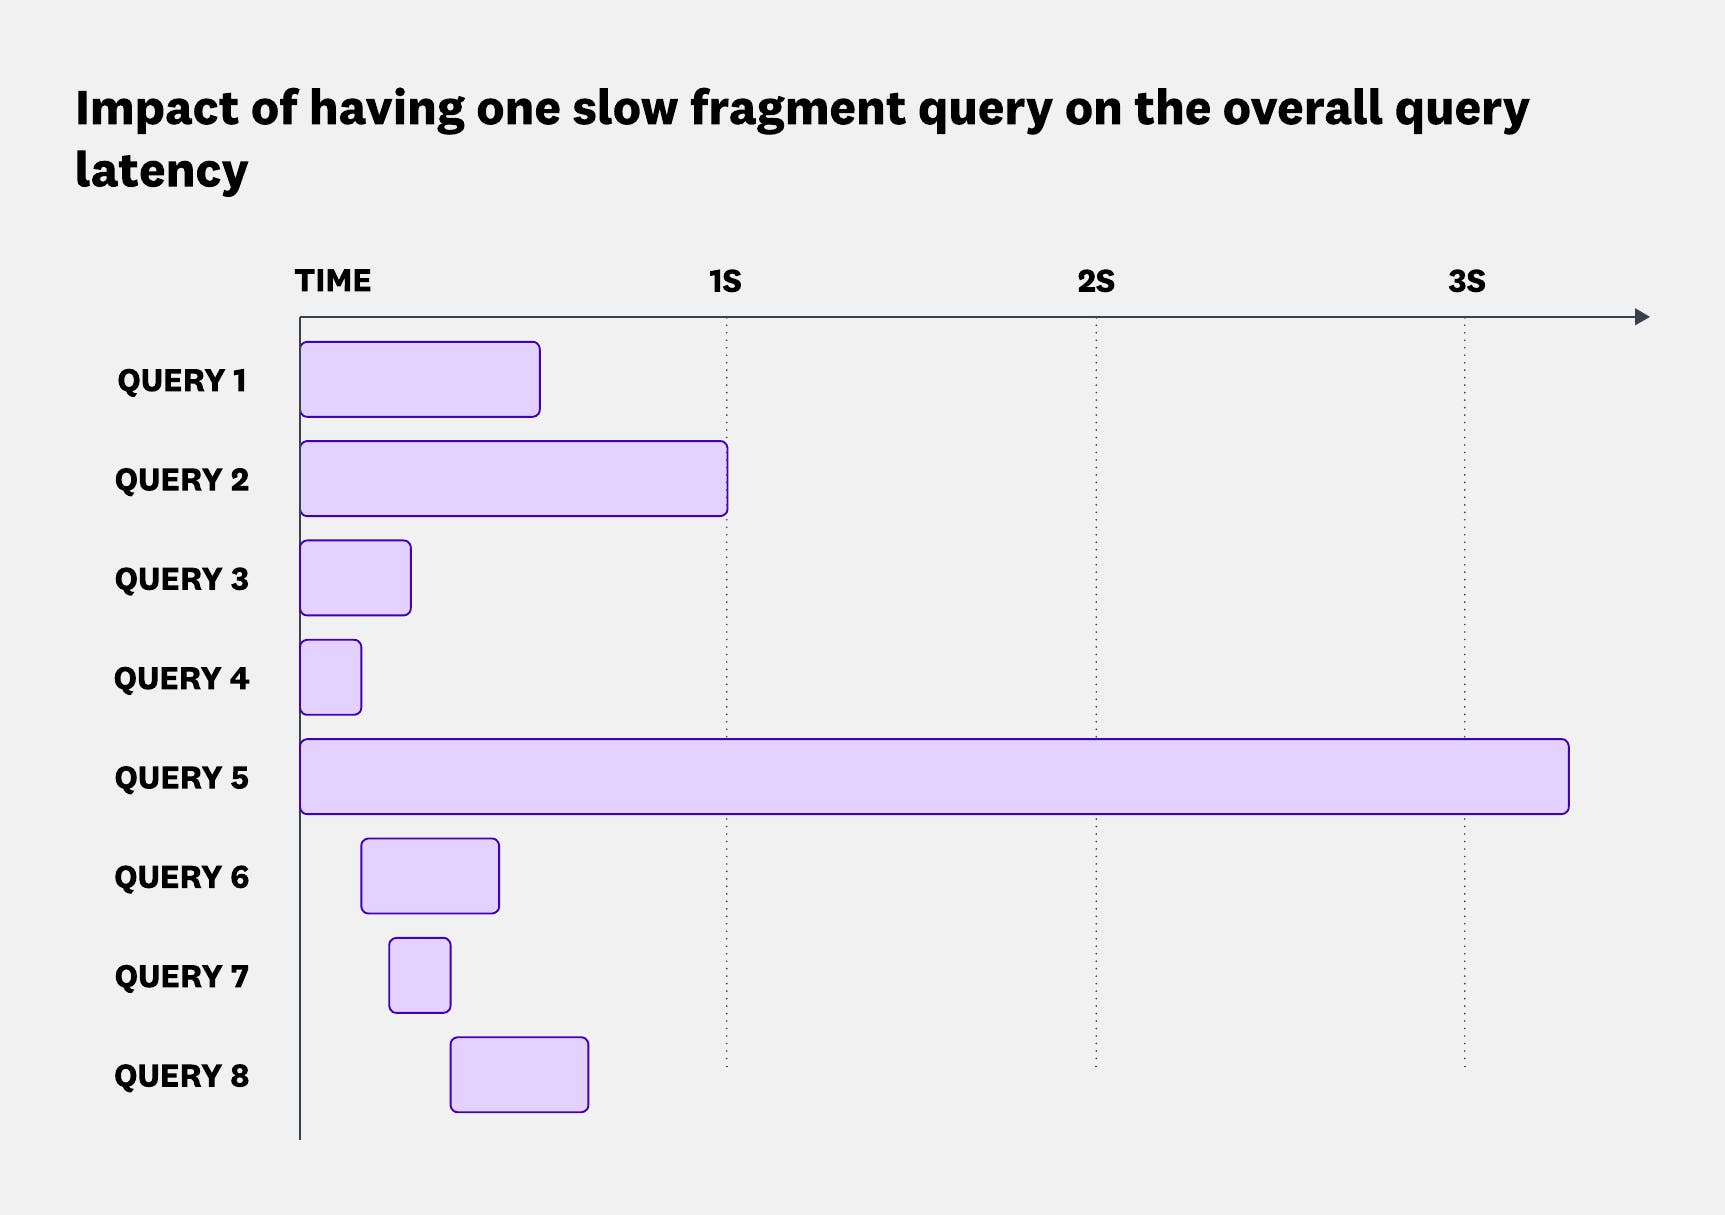
We had 8 fragments to query and we limited ourselves to 5 in parallel, and after just 1 second, we had responses from 7 of them—nearly 90% of the data. Because we stream the results as they arrive, the user sees most of the data much earlier than they would if we waited for the last fragment.
In some services, streaming also means we don’t need to buffer full results before sending them. That reduces memory pressure and helps prevent out-of-memory errors on long-running queries.
That said, streaming comes with its tradeoffs. If a failure happens mid-query, retries are harder—we can’t just reissue the same call. Instead, we need a checkpointing system to ensure we don’t duplicate results. With traditional blocking RPCs, this isn’t an issue: the whole call would simply be retried.
What’s next for Husky
Husky’s query engine is built for one of the hardest challenges in observability: giving users fast, reliable answers across massive, dynamic, and schema-less datasets. Through techniques like fragment pruning, lazy evaluation, multi-layered caching, and intelligent routing, we’ve built a system that handles trillions of queries with subsecond interactivity—while scanning as little as 0.6% of the underlying data on average. This level of efficiency helps ensure we can keep queries fast and cost-effective—even as usage scales into the trillions.
But that’s not the end. We’re continuing to evolve Husky’s architecture to be even more modular and interoperable across internal systems. The maturing Deconstructed Database ecosystem is the perfect foundation for this evolution. We are adopting standards like Apache Arrow, Apache Parquet, Substrait, and Apache DataFusion to decouple components strategically—making Husky not just powerful today, but adaptable for the next decade of data challenges. These standards also help us standardize our interfaces, simplify integration with data sources outside of Husky and improve our time to market to deliver new query features.
We are also exploring colocating caches themselves. We’ve already separated ingestion (write path) from queries (read path)—now we’re looking at doing the same for caches, decoupling query compute from cache storage.
Like solving hard distributed systems problems at scale? We’re hiring!


