
Richard Artoul

Cecilia Watt
This is the story of "Husky", a new event storage system we built at Datadog.
Building a new storage system is a fun and exciting undertaking—and one that shouldn’t be taken lightly. Most importantly, it does not happen in a vacuum. To understand the trade-offs that a new system makes, you need to understand the context: what came before it, and why we decided to build something new.
From Metrics to Logs
A few years ago, Datadog announced the general availability of its Log Management product. This was a significant addition to our platform. Before that, the company’s most widely known product was Infrastructure Monitoring (colloquially known as “Metrics”). Metrics systems are based on the idea of storing pre-aggregated timeseries data as tuples of <timeseries_id, timestamp, float64>.
However, these metrics systems are not suitable for storing log data because they achieve efficiency by pre-aggregating many similar events into a single aggregated datapoint. For example, to get web hit rates, it's a lot more effective (cost- and energy-wise) to capture the count per second on the web server than to read the click stream to derive the same information.
This optimization is highly desirable to produce compressed timeseries for a metrics system, but disastrous for a logs product. At a granularity of one second, a million “events” that occur within the same second can be compressed into a single 16-byte tuple of <timestamp, float64>. In addition, most modern metrics databases leverage delta-of-delta encoding, such that the actual storage cost of each 16-byte tuple is less than two bytes in most cases.
In exchange for the efficiency, metrics systems have limits on their capacity for storing context in the form of tags. You can filter and group metrics data in powerful ways, but there is a trade-off between unbounded tag cardinality and the time a query takes to return.
Hence, the practical recommendation to tag metrics by long-lived dimensions, such as datacenter, service or pod_name, while pre-aggregating short-lived, fast-churning dimensions such as transaction_id, or packet_id.
On the other hand, a logging product has some very different requirements:
Log sizes tend to be measured in kilobytes, not bytes. This has a dramatic effect on what's needed to store and query those logs efficiently.
A logging product that can't support high cardinality data, like stack traces and UUIDs, isn't very useful.
In other words, the appeal of metrics is in the ability to very efficiently compute timeseries, with enough context, out of lots of events. The appeal of logs is in the ability to retain lots of granular events with all their context—and to produce arbitrary dimensional aggregates at query time.
The initial version of Datadog Logs
This is what Datadog's first Logs system looked like.
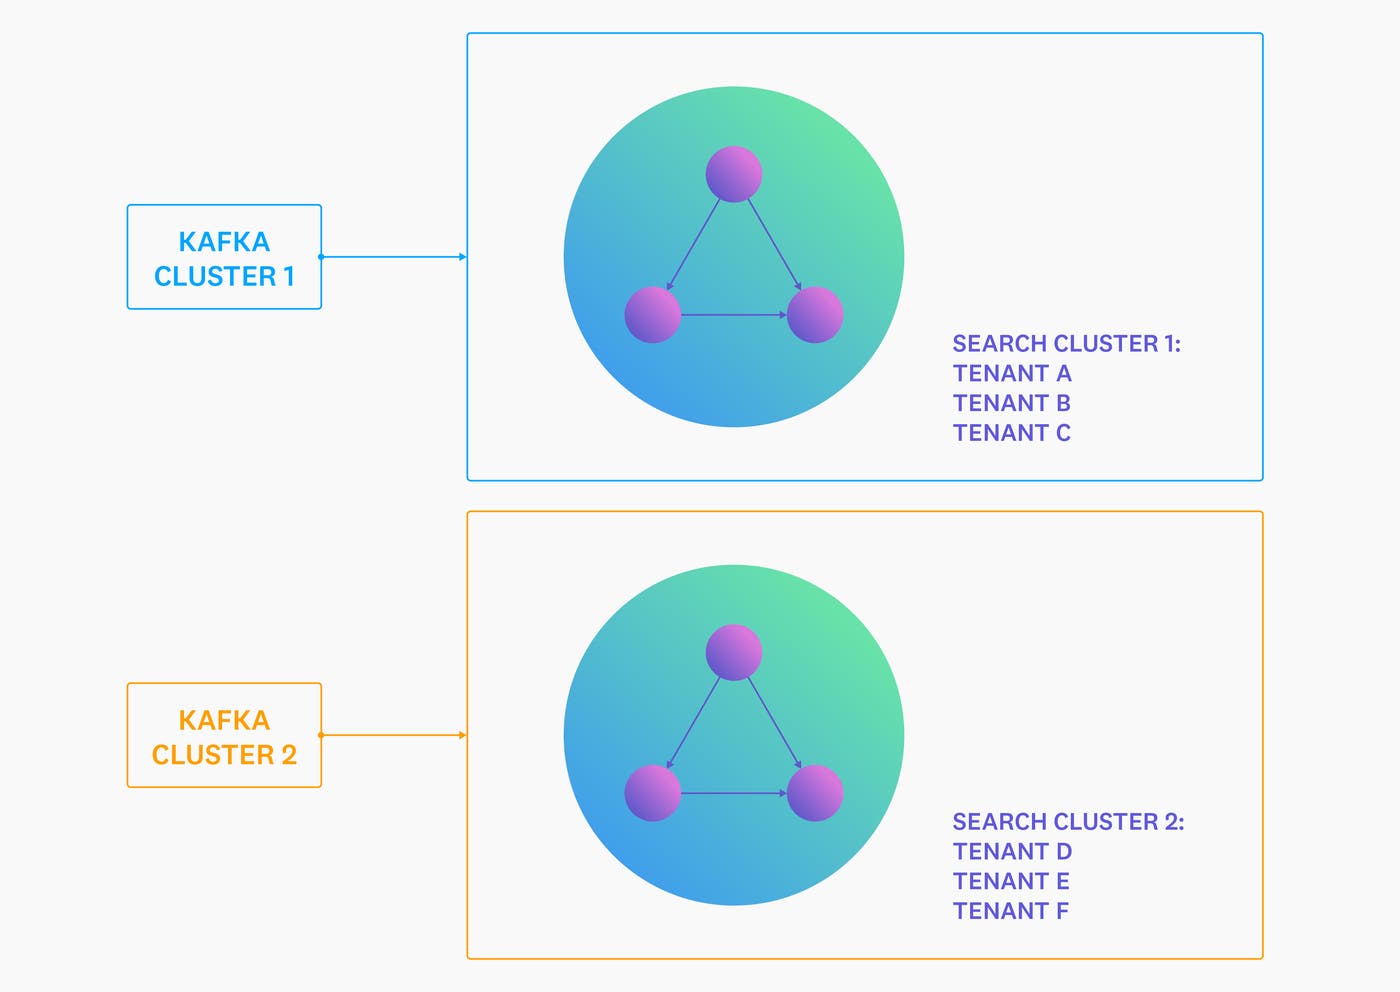
It worked quite well in the beginning, but it didn’t take long for the cracks to show. The primary problem was that within a multi-tenant cluster, a single misbehaving node could end up disrupting the experience of all tenants—and in the worst case, make the entire cluster unavailable.
Whenever this occurred, mitigating the issue was difficult. Scaling up or scaling out an overloaded cluster often made things worse instead of better. The nodes that were already overwhelmed by writes or reads would suddenly start streaming data to each other, in addition to all the work that they were already trying to perform.
Building our own clustering
The second iteration of our Logs system decoupled storage from clustering. We would handle all of the clustering separately, allowing us to tightly integrate the new clustering system with the rest of our multi-tenant technology. We retained the same single-node storage engine, and focused on getting fine-grained control over data distribution and topology changes. The new setup looked something like this:
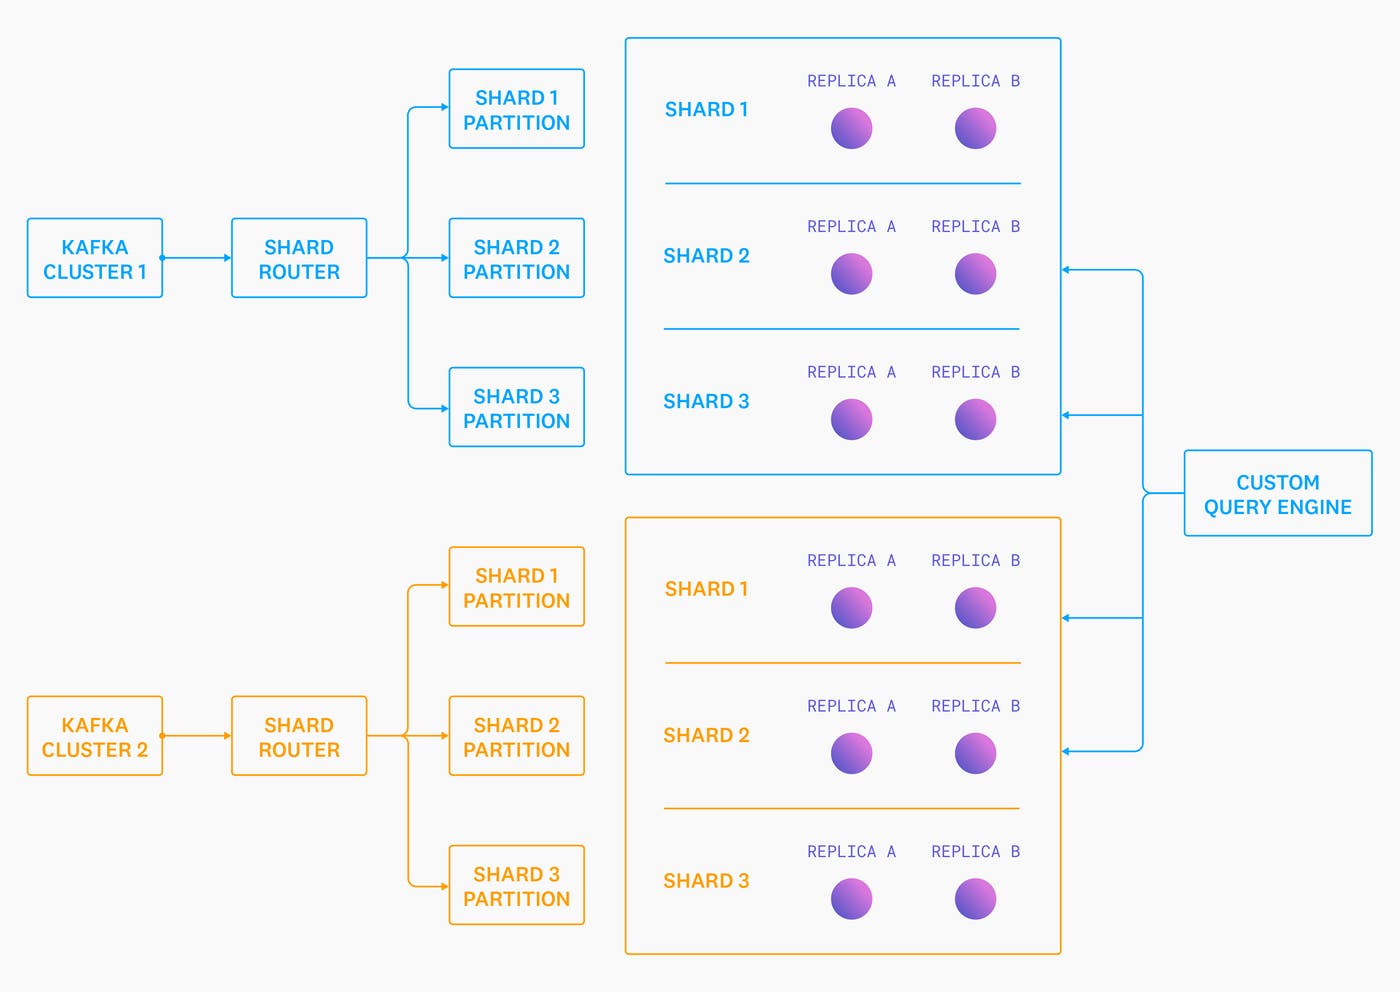
There are a few key differences between this diagram and the previous one:
None of the individual nodes know about each other. Each one behaves as if it’s a “cluster” of one. This means that a single misbehaving or unhealthy node can only ever disrupt as many tenants as we’ve assigned to the shard it owns, and there is no way for it to cause cascading failures to the rest of the “cluster”.
We introduced a new service called “Shard Router” that reads from Kafka and writes back to a new Kafka cluster, but this time with the data organized into “shards” (groups of partitions). Tenants are automatically split into an appropriate number of shards based on their data volume over the last five minutes.
Two storage node replicas consume each shard, consuming only events from their shards' relevant partitions.
We added a custom query engine that knows which shards each tenant's data is spread across—and whose responsibility it is to query all of the relevant shards/replicas, merge the partial aggregates, and generate the final query result.
Platform hypergrowth
The migration to this new architecture represented a marked reliability improvement, meaning that our on-call rotations became a lot more bearable, and engineers got more sleep. Just in time for the scope of our platform (internally called “Event Platform”) to grow at an even faster clip!
Other teams launched new products like Network Performance Monitoring (NPM), Real User Monitoring (RUM), and Datadog Continuous Profiler. Many of these new products had similar storage requirements as the Log Management product: they needed to store and index multi-kilobyte timeseries “events”. Recognizing that the events generated by these new products looked almost exactly like structured logs, we expanded the scope of our platform and started storing those events too.
As new products started to grow on the back of the event platform, cracks started to appear again. For example, a single tenant bursting and emitting a huge number of events in a short period of time could lead to query degradation for all other tenants colocated on the same shard.
In addition to these reliability concerns, product teams started asking us for new pieces of functionality that were difficult for us to support with that architecture:
Some logging customers had critical data that they only occasionally needed to query, but wanted to be retained (and immediately queryable) for much longer than was cost-effective with our existing architecture.
Customers and product teams were asking for the ability to query and aggregate on any field in their events without specifying which fields were indexed ahead of time.
Product teams wanted us to support array functions, windowing functions, and storing DDSketches in the storage engine directly, so they could send us pre-aggregated sketches and then re-aggregate them at query time.
And that was just the tip of the iceberg! Two things became clear to us:
We needed a completely new architecture that separated compute from storage to scale the ingestion, storage, and query paths independently, as well as to give more flexibility for controlling isolation, performance, and quality of service in our highly multi-tenant environments.
We needed to own the storage engine from top to bottom to control our destiny and deliver the functionality that our product teams were asking for.
Designing something new
With a fresh persective and new requirements, we took a step back and rethought our storage stack from the ground up. We were inspired by recent advances in the field (e.g. Snowflake and Procella) that separated storage from compute to great effect, and we decided to take a similar approach. We believed it would give us the highest amount of flexibility for building a system that was resilient and performant in the face of unpredictable and aggressive multi-tenant workloads. We also decided that our new system should be a vectorized column store (albeit one with a lot of optimizations for needle-in-the-haystack-searches) because our platform was beginning to look a lot more like a real-time data lake.
Introducing Husky
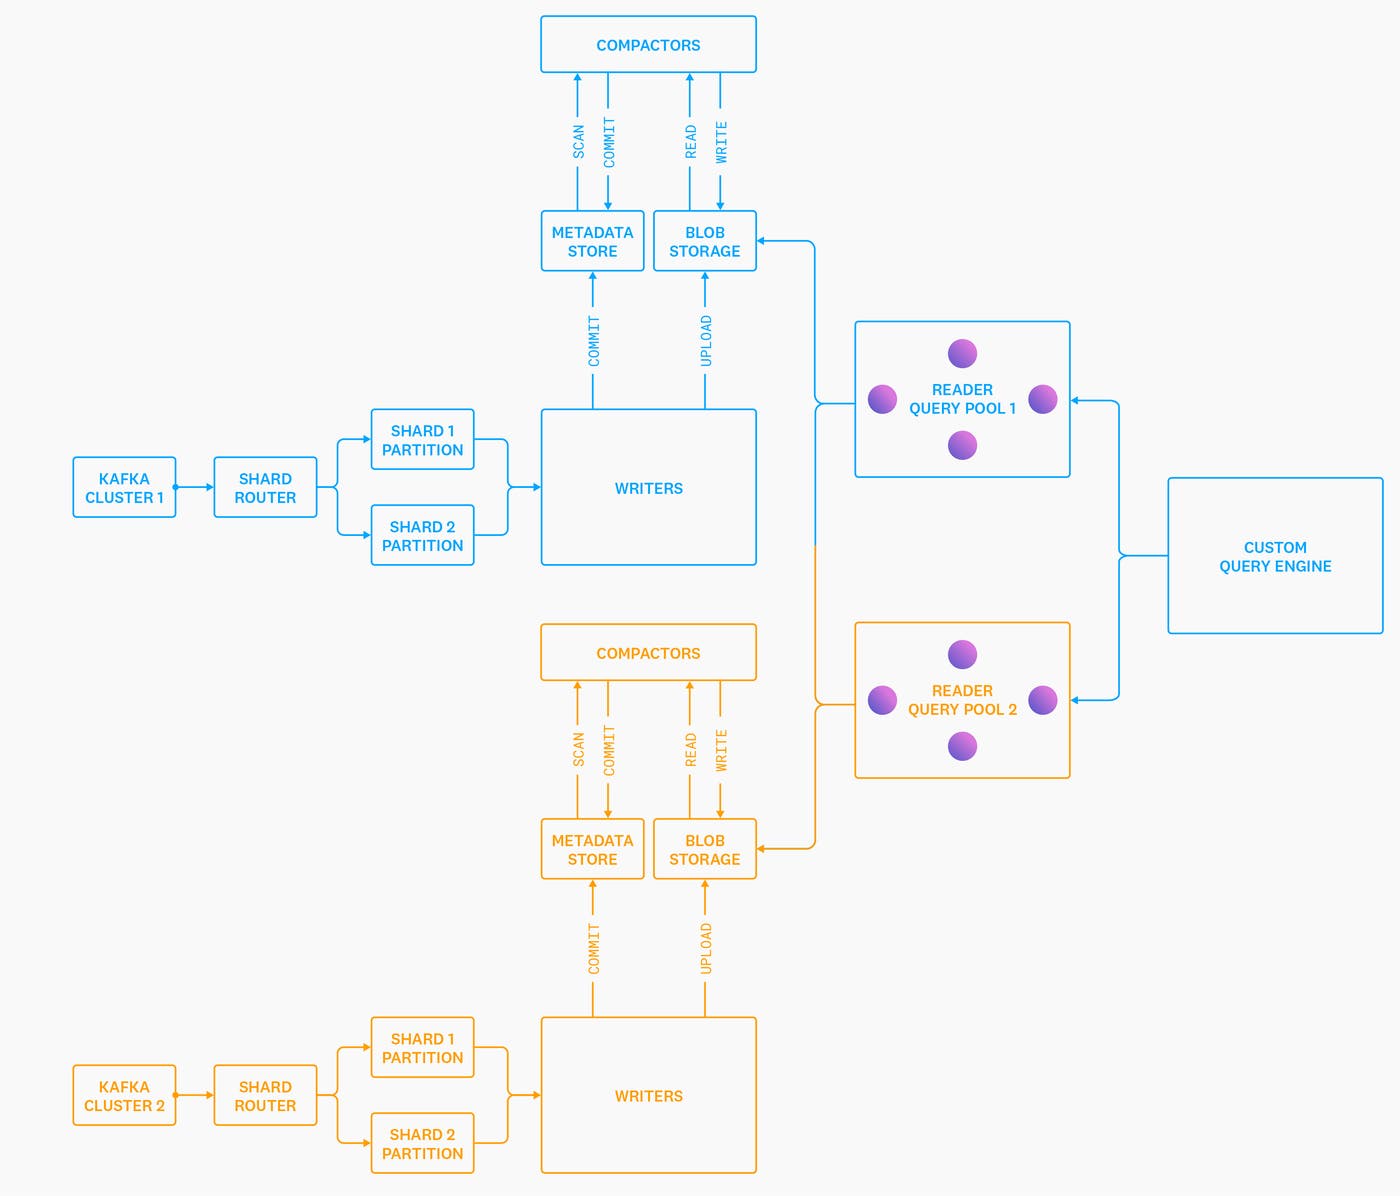
We started building a new storage system, affectionately known as “Husky”. When we're feeling fancy, we describe Husky as an “unbundled, distributed, schemaless, vectorized column store with hybrid analytics/search capabilities, designed from the ground up around commodity object storage”. Of course, a picture is worth a thousand words, so here is a simplified architecture diagram of Husky:
Roles
Let's try and break this down, because a lot has changed from our previous diagrams. The “storage system” that used to live in each individual storage node has now been blown apart into three different roles: Writers, Readers, and Compactors1.
Writers read from Kafka, (briefly) buffer events in memory, upload events to blob storage in our custom file format, and then commit the presence of these new files to our metadata store. This is how data gets into Husky’s storage system. These nodes are completely stateless and can autoscale. Critically, we never communicate with the Writer nodes at query time. This dramatically reduces the ability of queries to impair ingestion, or vice versa.
Compactors scan the metadata store for small files generated by the Writers and previous compactions, and compact them into larger files. These nodes serve the exact same role as the compaction system in an LSM-tree database—but instead of compacting data on a local disk, they run as a distributed, autoscaling service. They upload the compacted files to blob storage, and then “commit” this outcome in the metadata store. The metadata store then deletes the old input files and creates the new output file(s) in an atomic transaction, so queries never get an inconsistent view of the data.
The Reader (leaf) nodes run queries over individual files in blob storage and return partial aggregates, which are re-aggregated by the distributed query engine. These nodes are (almost2) stateless and can be scaled up or down without issues.
Metadata
The Writers, Compactors, and Readers coordinate a shared view of the world via our metadata store. Husky’s metadata store has multiple responsibilities, but its most important one is to serve as the strongly consistent source of truth for the set of files currently visible to each customer. We’ll delve into the details of our metadata store more in future blog posts, but it is a thin abstraction around FoundationDB, which we selected because it was one of the few open source OLTP database systems that met our requirements of:
Distributed and horizontally scalable by default.
Strictly serializable and interactive transactions with no fine print.
FoundationDB’s exhaustive simulation testing virtually guarantees that you’ll never observe a violation of its strictly serializable transaction isolation model. This makes many hard distributed systems problems much easier to grapple with.
Highly resilient when faced with extremely aggressive workloads, as evidenced by production use at Apple and by our own internal testing.
Storage
The concepts of shards and replicas have mostly disappeared from the system. In addition, we make no distinction between “historical” data and “fresh” data anywhere in the architecture. The abstractions of “metadata store” and “blob storage” are the only stateful components left, and we’ve pushed the tough scalability, replication, and durability problems of “store and don't lose these bytes” to battle-tested systems like FoundationDB and S3. This allows us to focus on the problem we’re actually trying to solve: how to ingest, index, and query huge volumes of data in a highly multi-tenant environment. For example, sometimes we have to search PiBs of events just to answer a single query!
The fact that we were able to offload both raw data storage and metadata storage to battle-tested systems is arguably the only reason we were able to build and launch to production a new system as fast as we did, but even then, it still took us over a year and a half between writing our first line of code to fully migrating a product to Husky.
Isolation
Another critical difference with this new architecture is that there is no relationship between a customer’s data volumes and how much hardware we can throw at their queries. Even if a customer’s data volumes are tiny, we can allow a query targeting one year of data to temporarily “burst” into a huge number of Reader nodes if we have spare capacity. This allows us to leverage our scale to smooth out individual tenant variation in query intensity to provide all customers with a better experience. Similarly, customers can send us huge volumes of data, but if they don’t need low latency queries, then we can limit how much compute their queries can use. This is the technical underpinning of our Flex Logs indexing tier.
Husky also allows us to isolate queries independently from how we isolate ingestion and storage. In the diagram above, both Reader pools 1 and 2 have access to both metadata stores and blob stores. This allows us to isolate the queries however we want. We can run all queries in a single giant pool of machines, or we can partition them by product, or even something as granular as a single tenant. Husky’s architecture gives us the flexibility to isolate the query path based on our reliability, cost, and product goals instead of being constrained by the decisions we made at ingestion time.
The most immediately obvious reliability benefit that arises out of this approach (and one that was infeasible before) is that we can isolate queries generated by automated monitoring from those generated by humans. We feel much better about the reliability of our system knowing that a human-generated query can never impair our ability to evaluate customers’ automated monitors and vice versa.
Migration impact
Of course, that all sounds great on paper, but how about in practice? At Datadog, the holy grail for all migrations is improved reliability, performance, and efficiency, in that order.
Reliability
Reliability can be tricky to measure. We try to be objective by comparing ingestion and query SLOs, but even SLOs have limits. For example, a system promising three 9s availability is allowed almost nine hours of downtime per year, but users will have strong opinions about how those hours are spread out! So far we’re optimistic about the reliability of Husky compared to that of the systems it replaced:
Our rate of incident has not increased, despite being a newer system.
Organic growth and sudden, large bursts of incoming events have been handled by autoscaling without human intervention.
We have spent almost no time debugging tenant- or node-level query performance.
Performance
Performance is the most difficult to measure. Benchmarking our complex and variable workload is really hard. Before we migrate a workload, we dual-write all data to both the old system and Husky, and then we shadow 100 percent of the query load for months to compare correctness and performance before we “flip the switch.” The post-migration experience generally looks like this:
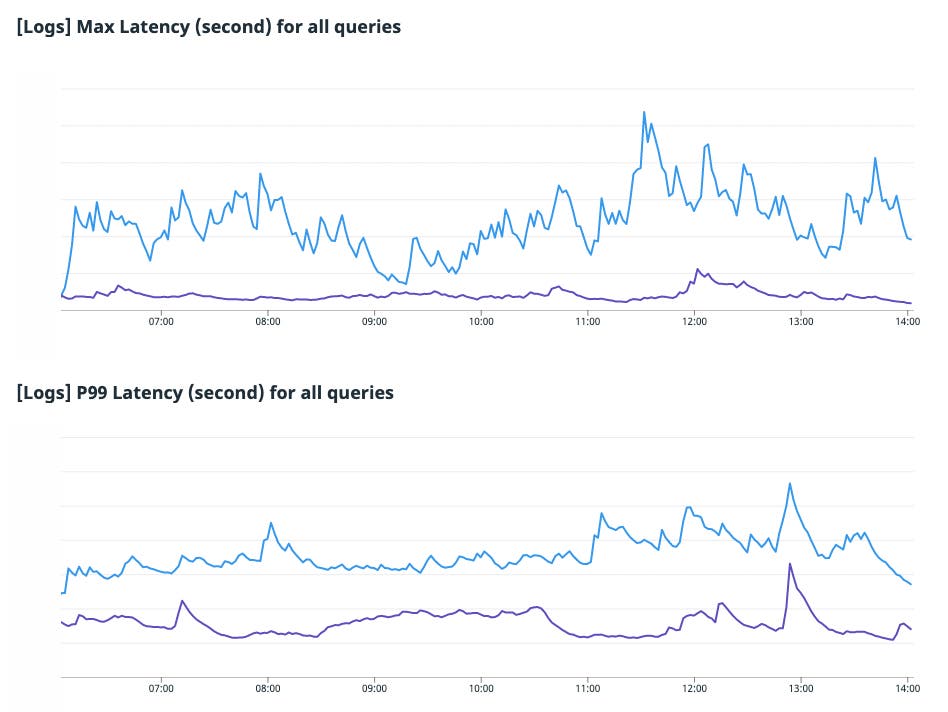
In these charts, Husky's latency (purple) is compared to that of our old system (blue). The p95/p99/max latencies are dramatically lower on Husky.
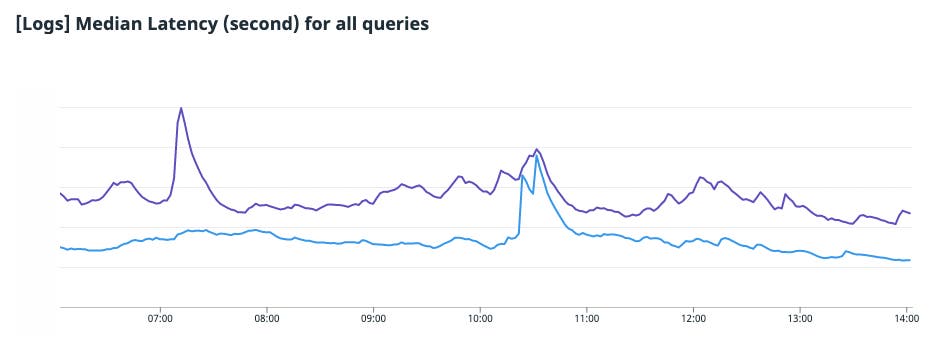
The median latency of Husky is slightly higher than the previous system, mostly due to the much higher “latency floor” of remote storage versus local SSDs.
We ultimately decided that a few hundred milliseconds increase in the median latency was the right decision for our customers to save seconds, tens of seconds, and hundreds of seconds of p95/p99/max latency, respectively.
Efficiency
The Husky migration dramatically improved our overall efficiency, which allowed us to invest time in even better query performance and new query functionality. In addition, the flexibility in how we allocate costs enabled us to launch entirely new products like Flex Logs.
Looking forward
We’ve nearly reached the end, and some of you may be disappointed that we haven’t discussed the details of Husky’s storage engine at all! Luckily this is just the first post in a multi-part series on the details of Husky’s storage system. We promise that we’ll get a lot more into the weeds and implementation details in subsequent posts, but we wanted to start things off by sharing why we built Husky before explaining how!
Finally, if you’d like to work with us at Datadog, please apply for a job!

