Julien Danjou
Last year, we started building our Continuous Profiler product at Datadog, and this summer at Dash, we launched a Continuous Profiler product. While this new feature ultimately targets a wide variety of languages, the first languages chosen were Java and Python.
Java has a long history of profiling, including “always on” profilers. There are event recorders built into the Java Virtual Machine, designed to minimize the observer effect and be always-on in production systems. In practice, such a performant profiler is unnoticeable to the user and provides a lot of insight into the application behavior.
Python does not have comparable tools, so we set out to build a similar always-on profiler with Python.
Profiling and Tracing
To understand what we had to build, one has to understand profiling. Profiling is a form of dynamic program analysis that measures software resource usage, such as CPU time or memory allocation. This data allows you to understand your program’s performance and optimize it adequately, rather than making guesses at what might be slowing it down.
This is different from tracing, a feature Datadog has had for a long time. Tracing allows you to see every operation triggered by your application (SQL query, HTTP request, etc.) when handling a user request, providing the detailed timeline of the execution of that request. Tracing gives great information about request timing, but little insight on the behavior and performance of the code level execution in the operating system.

Python Profiling
Most Python developers probably think about the cProfile module when talking about profilers, shipped since version 2.5 of CPython.
cProfile is a deterministic profiler. It traces every function execution in your program and records the time spent in each call. While this has the upside of showing 100% of your program execution flow, cProfile does have a flaw in how it records data.
If your code is just one giant function, there’s nothing to trace. That’s a contrived example, but without splitting your program into a lot of different functions, the output of a deterministic profiler does not give you enough information to understand your program’s behavior.
On the other hand, if your code is split into thousands of functions, your report will be fine-grained, but the overhead added by tracing every function call is huge. Sometimes two or three x, which is completely unusable in a production system.
Therefore, the pattern of a deterministic profiler is not a good fit for continuous production profiling.

This might have you wondering, why would somebody even want to run profiling in production?
Profiling Production
In 1974, Donald Knuth wrote one of my favorite quotes: “Premature optimization is the root of all evil (or at least most of it) in programming.” Trying to optimize performance for a non-profiled program is analogous to shooting blindfolded. You might guess right, but you might guess wrong, and if you guess wrong, you’re doing the opposite of optimizing.
We have a saying on our profiling team: “You don’t know what you don’t know”. Profiling helps you figure out what you don’t know.
Profiling on your development laptop is not the same as profiling on production environments. Many things are going to be different from the underlying hardware to type and concurrency.
To understand your application’s behavior handling an authentic workload, you need to enable continuous profiling on your production system.
Now that we all agree that we can’t use a deterministic profiler and want to profile our production system, where does that leave us?
Answer: we need to do statistical profiling.
Statistical Profiling in Python
The goal of statistical profiling is the same as deterministic profiling, but the means are different. Rather than recording every call to every function, the idea is to observe a program’s activity and record it intermittently.
Strictly speaking, a statistical profiler might appear less precise than a deterministic profiler, as it’s going to miss out on a lot of concise function calls. But since the profiler will examine the program’s activity every few milliseconds for hours and hours, the statistical result is a trustworthy representation of the program’s resource consumption. Since the profiler is always on and running in your production system, a lot of actual function calls are collected. In a way, statistical profiling can actually be more representative of what a program is doing because of the low overhead. Without massive overhead, you can measure an application running in a manner much closer to how the non-profiled version of that application would be running.
The landscape of Python profilers in the last few years has really grown because of the development of a number of open-source projects. Our profiling team tested dozens of them, though we did not have much success with them for our purposes. Many of those projects are platform-specific, don’t gather enough information, or focus on displaying fancy output. In the end, we decided to build our own statistical profiler for Python, with the various profilers we studied, giving us a lot of neat ideas and useful leads.
Datadog Python Profiler
Whenever you design software, you always end up making compromises. Our profiler was not an exception to this rule. Our constraints were:
- The overhead must be as small as possible.
- The deployment must be as simple as possible.
- The profiler should work in any environment and on the most commonly used operating systems.
With these constraints, we set the bar quite high for ourselves.
General Design
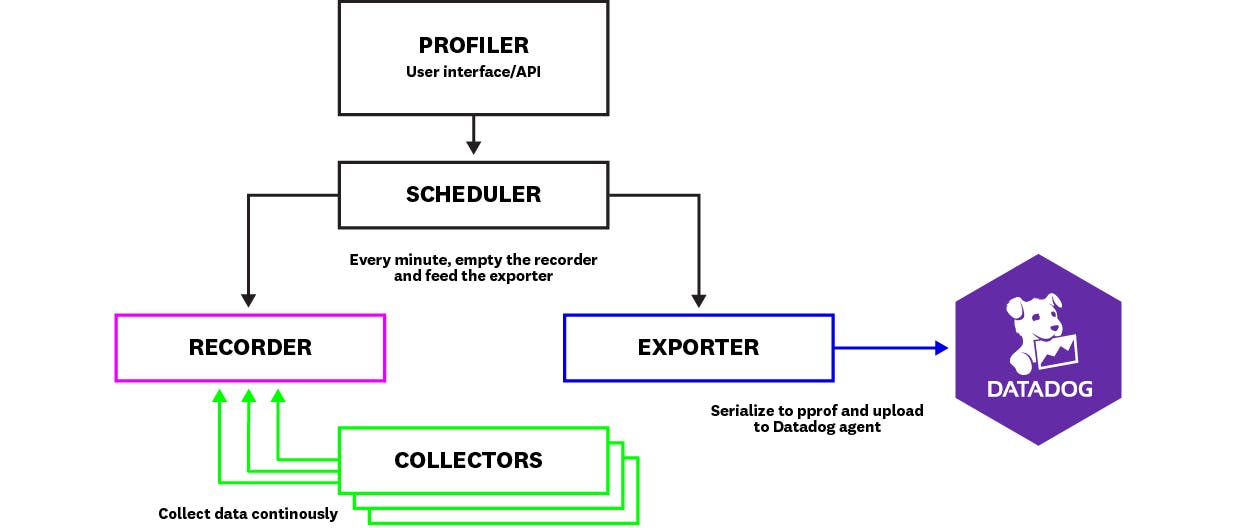
The profiler splits out into the following different components, inspired by the design of the JDK Flight Recorder:
- The recorder is in charge of storing the events generated by the collectors.
- The collectors are in charge of collecting the data: CPU usage, memory allocation, etc., and storing them in the recorder.
- The exporter is responsible for exporting the data out of the application.
- The scheduler is in charge of calling the different pieces at the right time. For example, as the profiler exports data every minute this is the component responsible for calling an exporter every sixty seconds.
- Finally, the profiler is the high-level object exposed to the users, so they do not have to manipulate the pieces mentioned above.
Let’s dig into some of the main pieces.
The Collectors
Our profiler is designed to be extendable and can support a wide variety of data collectors.
The stack collector is the most important shipped data collector. It wakes up 100 times per second and gathers the execution stack of every Python thread of the application.
To do that, it lists all the threads running inside the program and gathers all the current information about them: which function they are executing, how much CPU time they used, which kind of exception they might be handling, etc.
To avoid overloading the system, the stack collector controls its CPU overhead by measuring the time it takes to measure the application. That gives it the ability to slow down its polling rate in case the application is heavily loaded, limiting its impact on application performances. This feature is important to make the profiler imperceptible in production systems.
Part of this code is written in C using Cython, enabling better performances and allowing us to use some system calls unexposed by the Python API.
The Datadog profiler also ships with a memory collector, which records memory allocations, as well as a lock collector, which records which locks were acquired and released. They both help understand where your application is spending time allocating memory and where it might be waiting to acquire multi-threading locks, respectively.
The Exporters
While it might not sound like it, exporting data is a challenge on its own. Gathering thousands of stack traces and metrics for hours and hours can generate a lot of information.
There is no standard format to export profiling data, but we finally settled on the pprof format. This format comes from the Go profiling tool and serializes using Protocol Buffers, making it efficient in terms of both performance and space.
The pprof format allows aggregation of the collected metrics and compresses the strings using a pool, making it efficient in terms of space. You can aggregate thousands of samples in a few tens of kilobytes.
The profiler uploads this pprof file through HTTP to the Datadog Agent, which then uploads it to our backend. This way, exporting data every minute is done in a few milliseconds of CPU—with little to no impact on the application performance.
Results
Our goal was to make continuous profiling a great experience in Python, in a space where only a handful of domain-specific profilers exist. We’re off to a great start, and we are eager to add more features and improvements in the future. Check out future blog posts to see specific places where we are having performance improvements.
If you have already used the profiling tab in your Datadog dashboard, you’ve seen the flame graphs that it can produce. The default flame graphs give you a great representation of the code that consumes the most CPU time, allowing you to spot heavy functions in a snap.
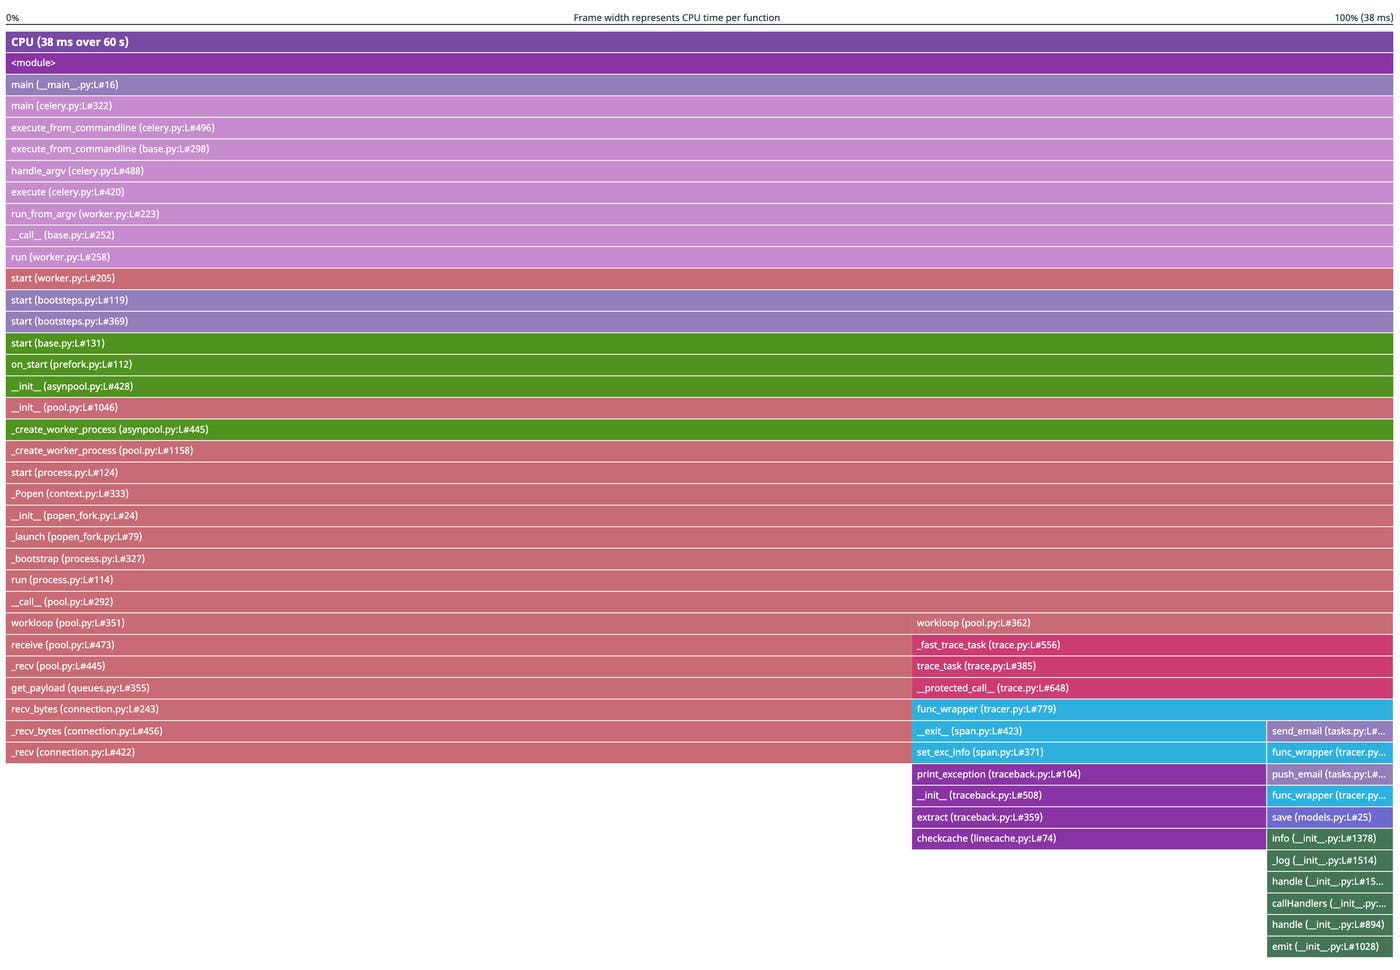
If you’re interested in profiling your code, check out the instructions on setting up the profiler in Python.
If you think this is an exciting adventure and want to get on board, we’re always looking for talented engineers to join us!
