Justin Lesko

Danny Driscoll
Amazon EKS on Fargate is a managed service that reduces the operational overhead of maintaining a Kubernetes cluster by abstracting away the underlying infrastructure. In a serverless Fargate environment, each pod is assigned its own isolated compute resources; there is no direct host-level access. This can be challenging for observability: Sending logs and metrics from your serverless Kubernetes clusters to downstream monitoring services typically requires a third-party log router and additional infrastructure, which increases complexity and cost.
To address these challenges, Datadog now supports a Kubernetes-native method for collecting logs. Instead of routing logs through a third-party service, this setup allows logs to be collected and shipped entirely by the Datadog Agent.
In this post, we’ll explore how the new logging method works and its advantages over other methods for sending EKS Fargate logs to monitoring solutions.
How kubelet logging works
In a traditional Kubernetes environment, the container runtime, kubelet, and node work together to manage application logs. The result is a log directory (typically /var/log/pods) on the underlying host filesystem that houses logs organized by pod and container. When the Datadog Agent is deployed as a Daemonset, with one Agent pod per node, it is able to take advantage of Kubernetes’ default logging behavior and collect logs by mounting the host’s filesystem and tailing the files.
While serverless EKS on Fargate environments remove the burden of managing servers for your Kubernetes workloads, Fargate does not provide any direct host access, which prevents the typical logging pattern we just described from functioning properly. Historically, in order to collect logs on Fargate, users have had to rely on the open source log router Fluent Bit to send logs to AWS CloudWatch so that they can then be forwarded to Datadog. This combination of services requires additional paid infrastructure and bespoke Fluent Bit configuration. In addition, the resulting logs lack the rich contextual tags that are available with a typical Datadog integration.
The new native kubelet logging method circumvents these issues by enabling the Datadog Agent to collect logs directly, much like running the kubectl logs command. The Agent is deployed as a sidecar container within each of your application pods and proxies through the cluster’s API server to the kubelet (because it cannot connect directly to the kubelet) to request a container’s logs. Then, the Agent can ship the collected logs directly to Datadog without the need for any supporting infrastructure.
Advantages of native kubelet logging
Native kubelet logging brings several benefits for EKS Fargate users. Setup is simpler because it’s no longer necessary to manage custom Fluent Bit configurations or use CloudWatch as an intermediary log source before sending telemetry data to Datadog. This also lowers costs, as there is no need to configure and manage any additional infrastructure or services.
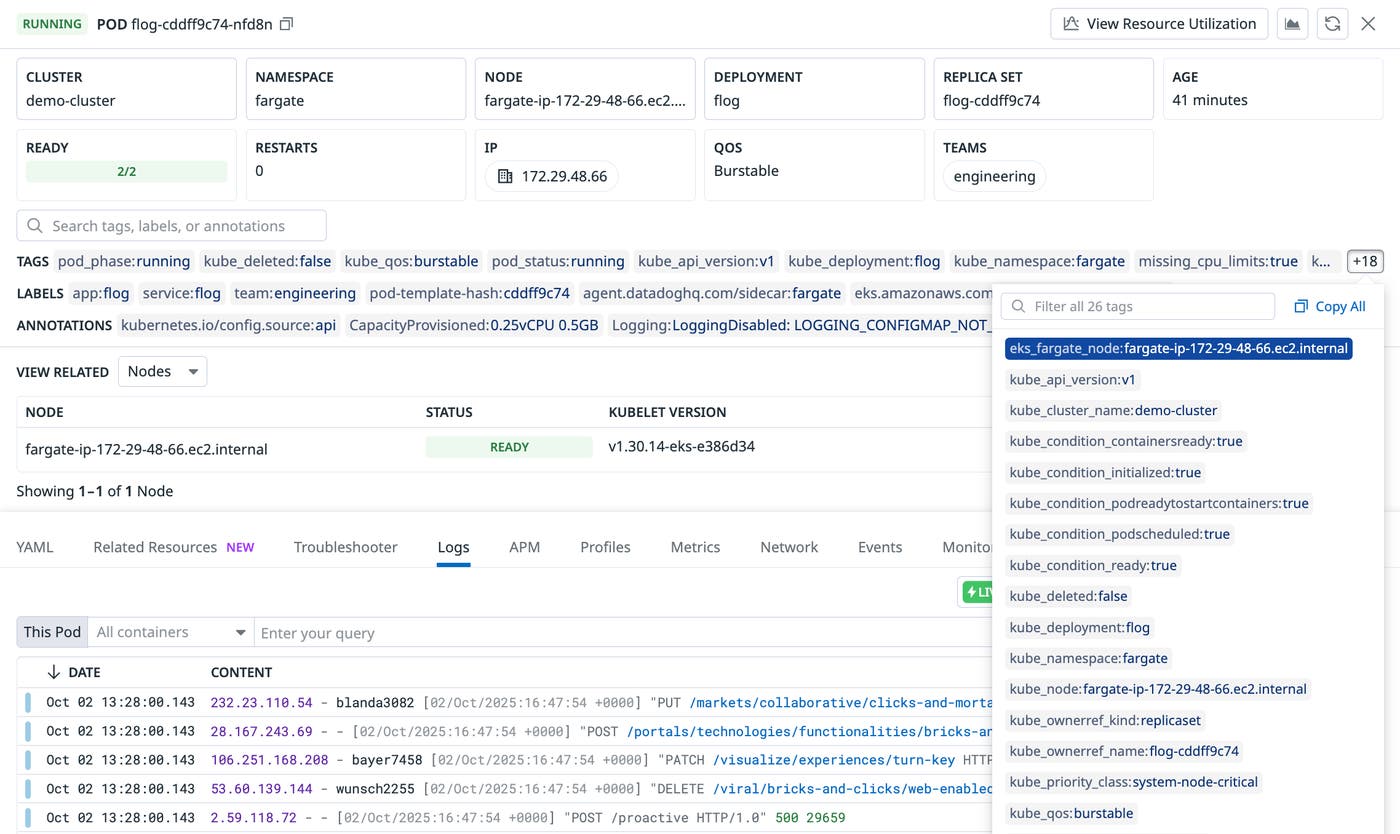
In addition, Datadog’s Autodiscovery capabilities increase log configuration consistency by enabling you to apply the same log collection patterns to your EKS Fargate logs as you do across your whole environment. And because logs are collected directly by the Datadog Agent, they are tagged with complete Kubernetes metadata, including pod names and container IDs, enabling richer context and more accurate monitoring.

Start collecting EKS Fargate logs with the Datadog Agent
Native kubelet logging provides a simplified, cost-effective way to collect logs from workloads deployed on EKS Fargate. This new method is easier to configure, requires no supporting AWS infrastructure, and produces fully tagged logs.
Check out our documentation to get started. If you don’t already have a Datadog account, you can sign up for a 14-day free trial.

