Bowen Chen

John Kendall
Amazon Elastic Kubernetes Service (EKS) is a managed container service designed to deploy and scale cloud-based or on-premise Kubernetes applications. AWS released EKS Blueprints to provide customers with a framework for creating internal development platforms on EKS. Using EKS Blueprints, enterprises can reduce operational complexity by packaging tools (e.g., services that run CI/CD pipelines and collect telemetry data) into a cohesive platform that enables teams to seamlessly deploy their EKS workloads at scale.
We’re excited to announce that Datadog is an official launch partner with EKS Blueprints. With our EKS Blueprints add-on, you can deploy the Datadog Agent to gain deep visibility into the health and performance of your dynamic infrastructure.
Monitor EKS Blueprints with Datadog
Amazon EKS Blueprints is designed to be extensible, so it can support your existing framework while still allowing you to add new capabilities. Whether you are looking to migrate to EKS or create a system of better practices, Blueprints can provide tools to help you succeed. In addition to EKS’s existing support for Elastic Load Balancing and VPC, developers can now create and configure well-architected EKS clusters over multiple accounts and regions—all from a single Git repository.
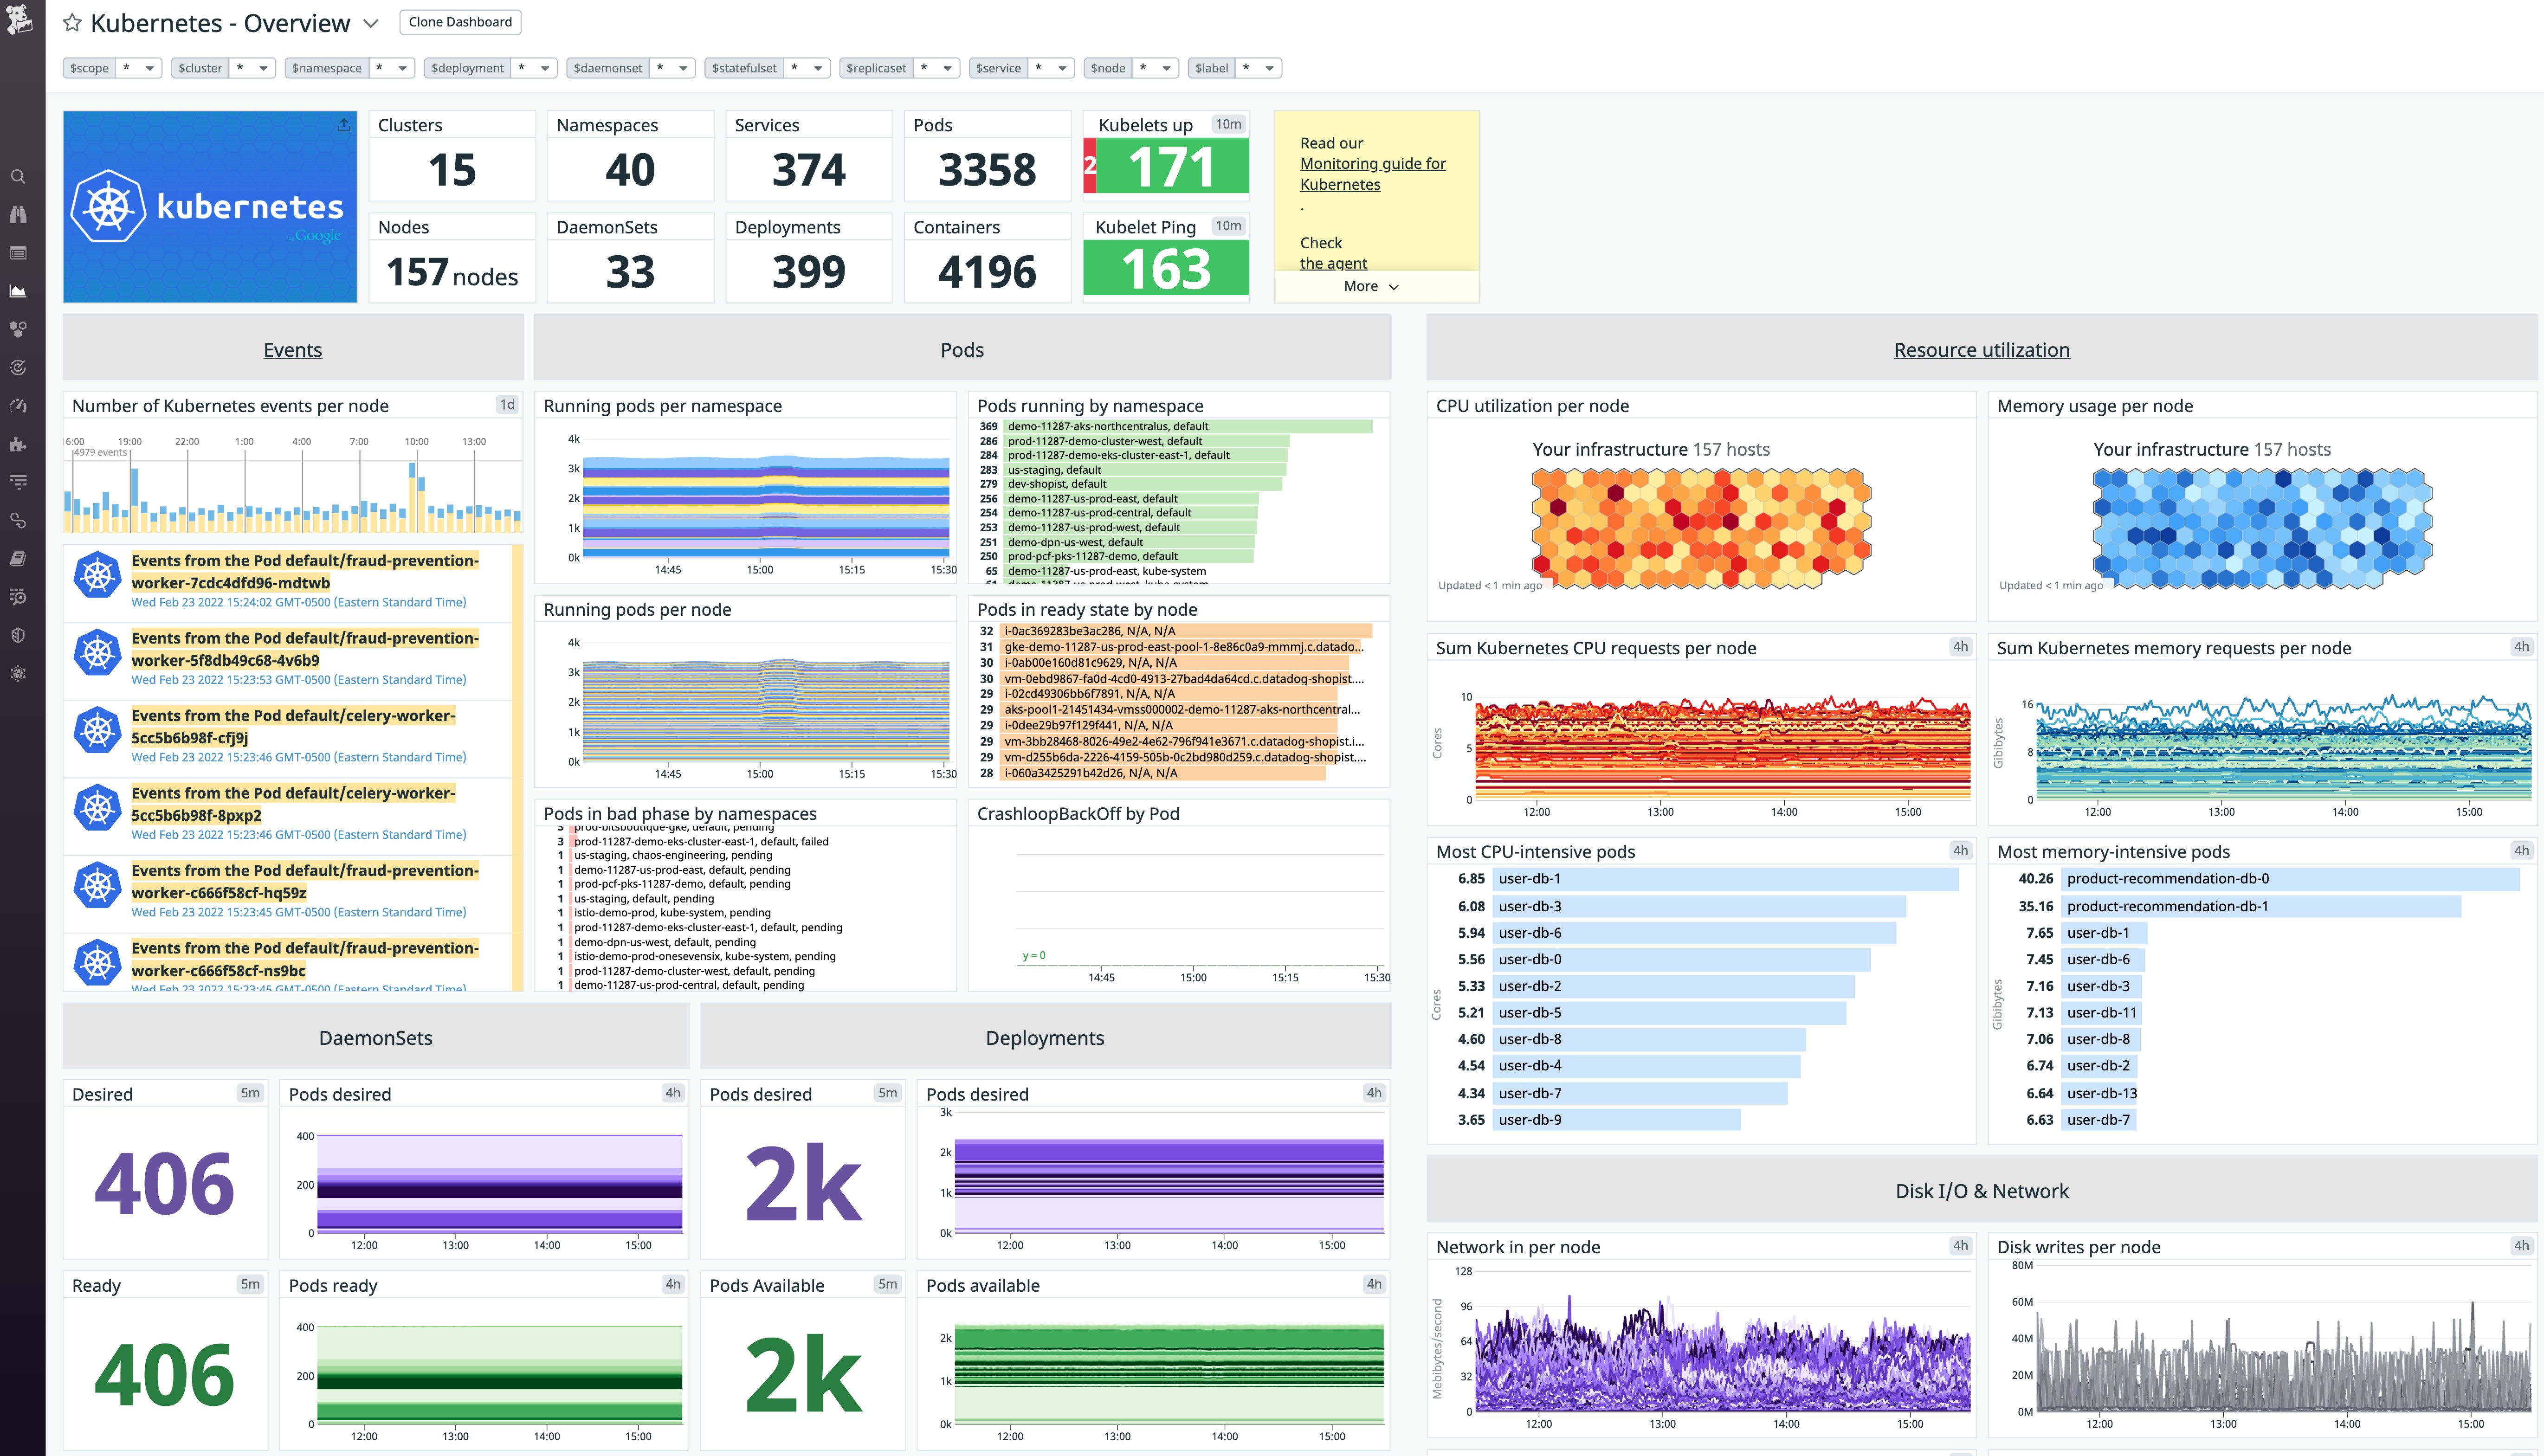
While EKS Blueprints simplifies the deployment of your workloads, it remains essential to get full visibility into your clusters. Datadog provides you with tools to monitor clusters, pods, containers, and other Kubernetes resources. Our out-of-the-box Kubernetes dashboards provide a high-level overview of your clusters’ performance by delivering critical insight into metrics such as pod availability and resource utilization.

The Kubernetes Overview dashboard provides an easily accessible report into the CPU and memory usage of each pod (as shown above). Comparing each pod’s resource requests against actual utilization can help you rationalize the limit specifications within your manifests and determine which pods may be vulnerable to node-pressure eviction. If a pod’s memory limit is set too close to its standard utilization, it runs the risk of being OOM terminated. Learn more about configuring requests and limits in our EKS monitoring guide.
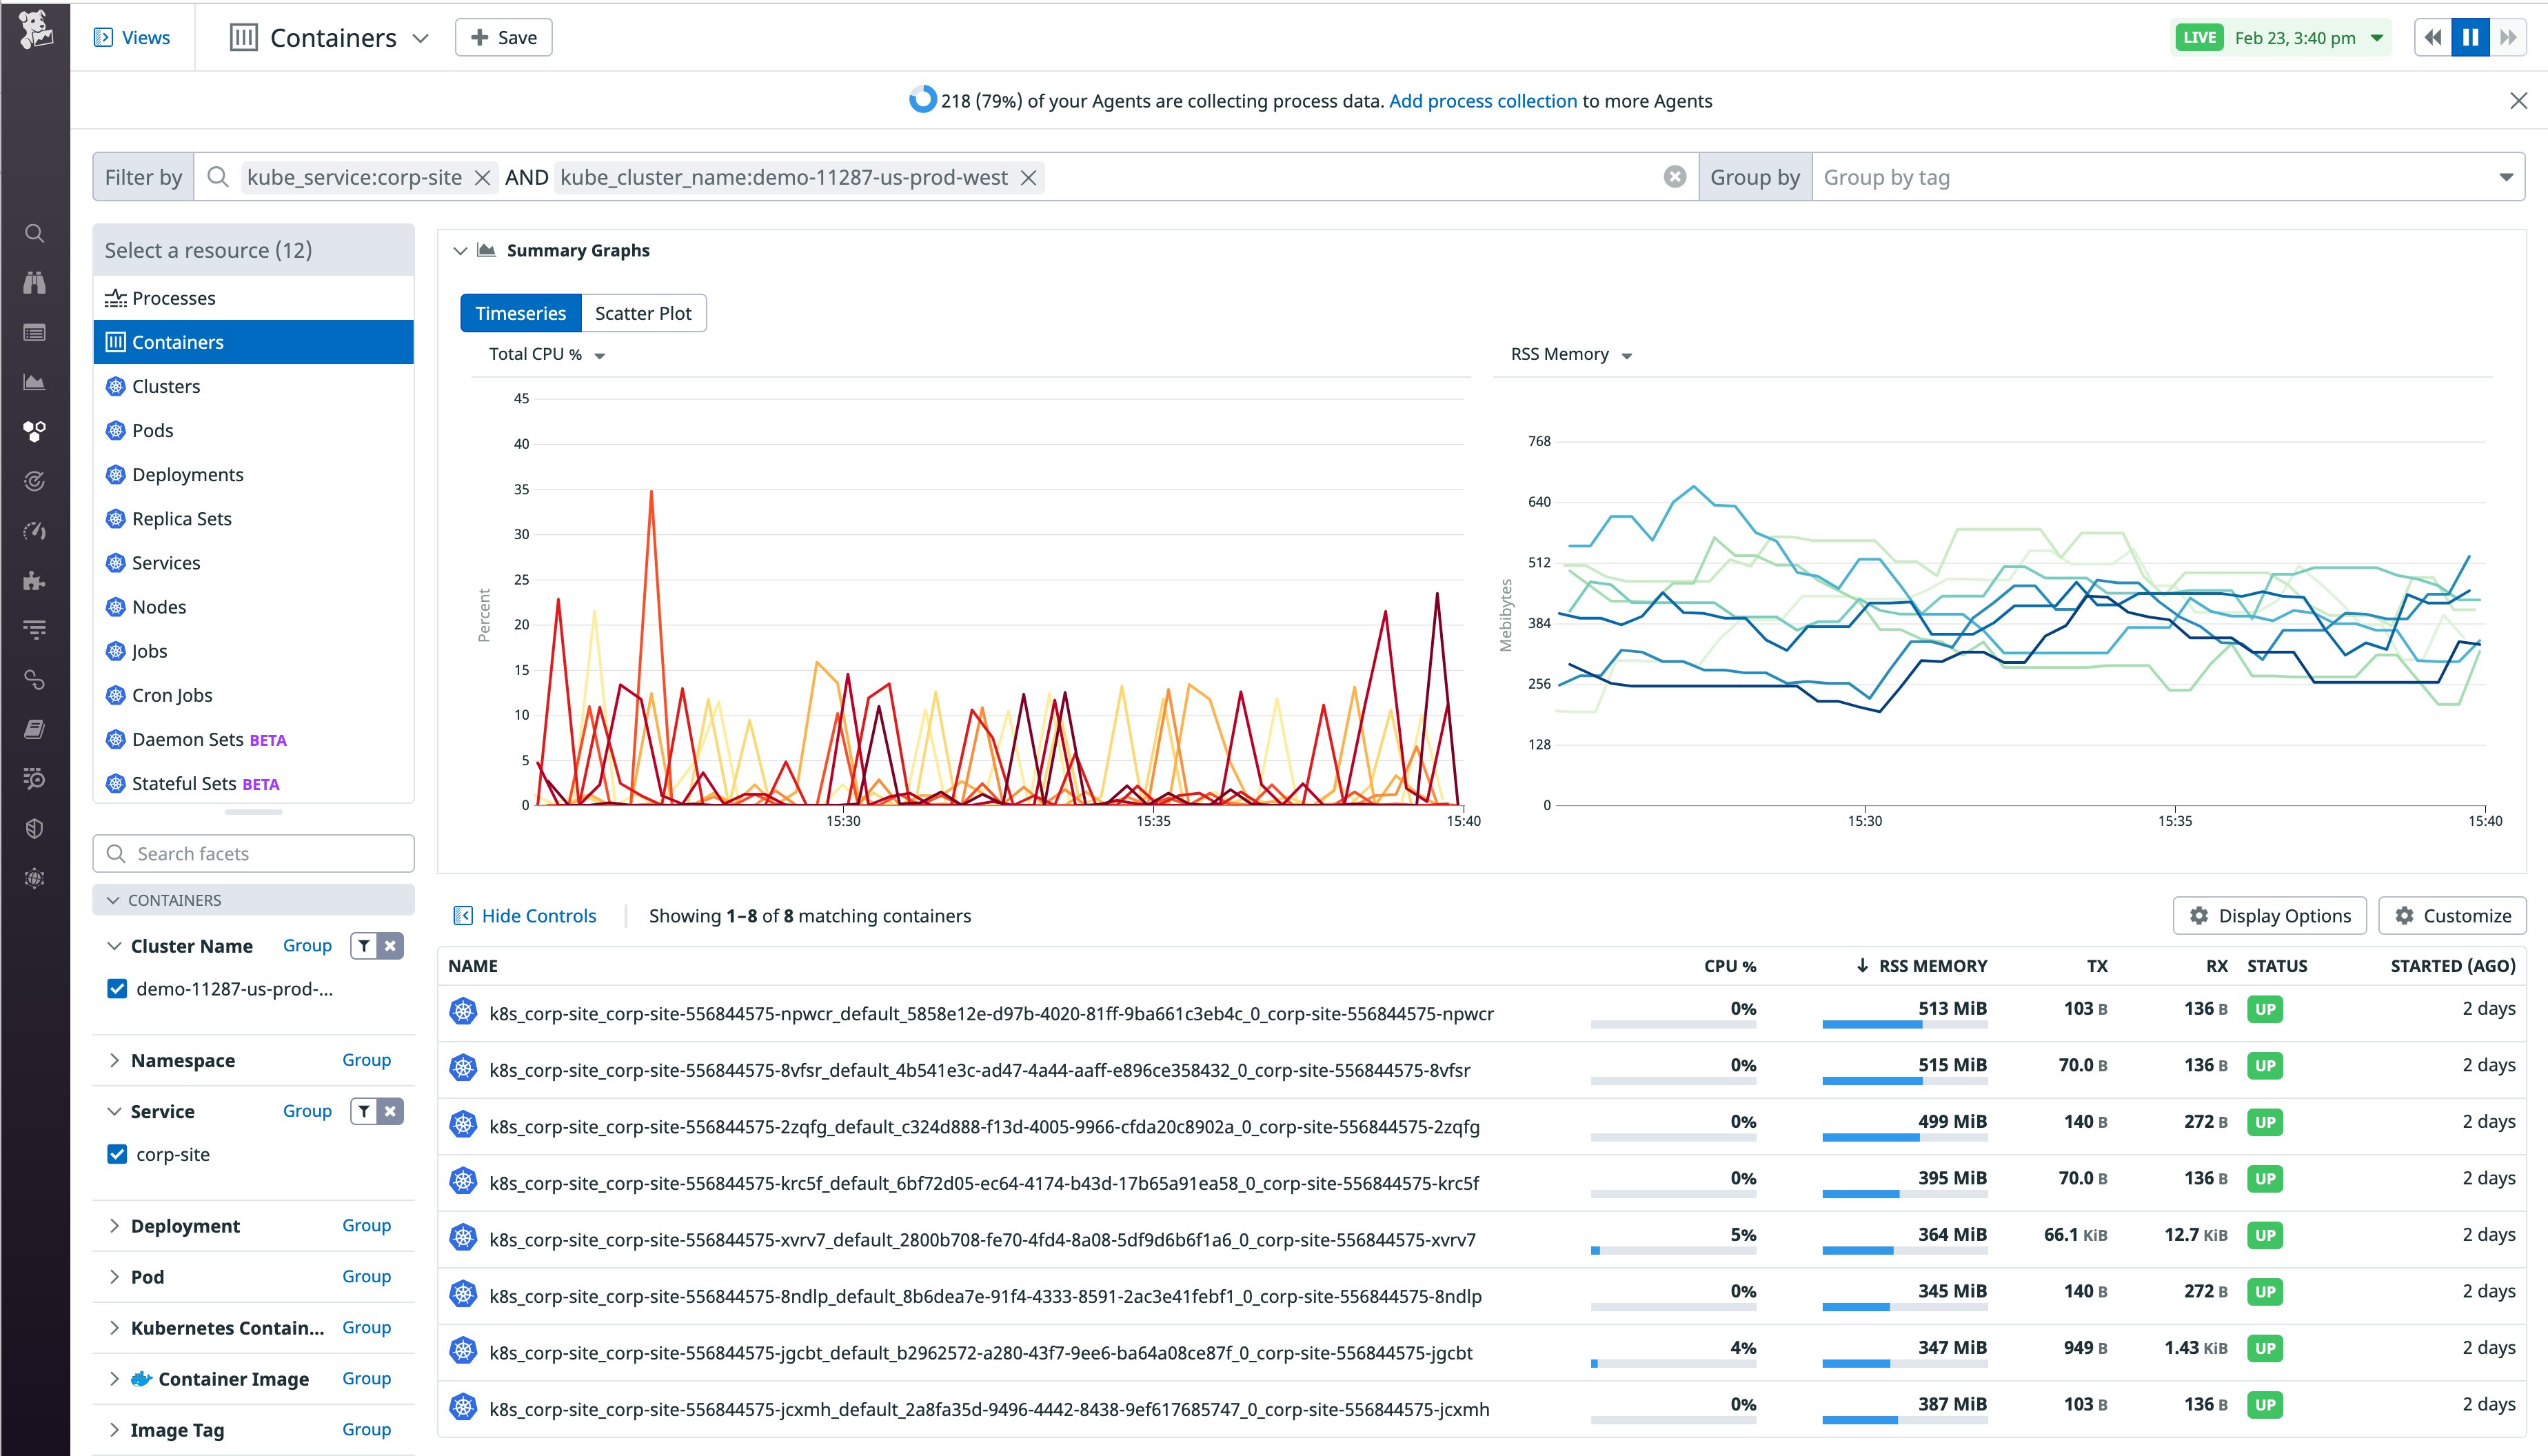
For a deeper look into your containerized infrastructure, our Live Container view provides real-time resource metrics that can be filtered using our built-in dynamic tags, including tags that are automatically detected from Kubernetes. For example, you can use these tags to track your containers across different Docker images, services, and Kubernetes namespaces for an at-a-glance summary of their CPU and RSS memory utilization. In the screenshot below, we used the kube_service and kube_cluster_name tags to filter for containers from a specific Kubernetes service and cluster.

Since most resource metrics are highly volatile, the Live Container view updates them at a two-second resolution so you can observe critical spikes in your environment while filtering out noise. From here, you can inspect unusually resource-intensive containers to get a more detailed view of their performance over different time frames, or analyze correlated logs and traces for a more complete picture.
Get started with EKS Blueprints and Datadog
If you’re using Amazon EKS Blueprints, Datadog can deliver comprehensive insights into the health and performance of your workloads. For more information about integrating your containerized environment with Datadog, check out our documentation. If you don’t already have a Datadog account, get started today with a free trial free 14-day trial.


