Sumedha Mehta

Steve Zou
Organizations that run applications on Amazon Elastic Container Service (Amazon ECS) often juggle signals across container and task metrics, logs, and events while they hunt for the change or condition that broke a deployment. This work adds operational overhead and extends incident timelines as teams switch between tools and manually correlate symptoms.
To help solve these challenges, Datadog now provides default monitors and an integrated troubleshooting experience that helps you spot common ECS problems quickly and jump straight to the failing service or task to fix them. You can go directly from an alert to the ECS Explorer to understand service, task, and container health within your ECS clusters, without changing tools or sifting through logs.
In this post, you’ll learn how to:
- Use the ECS Explorer to debug issues detected by your monitors
- Identify cluster-level issues before they cascade
- Zero in on AWS Fargate task-level failures (for example, CPU, memory, network, and storage)
Use the ECS Explorer to debug issues detected by monitors
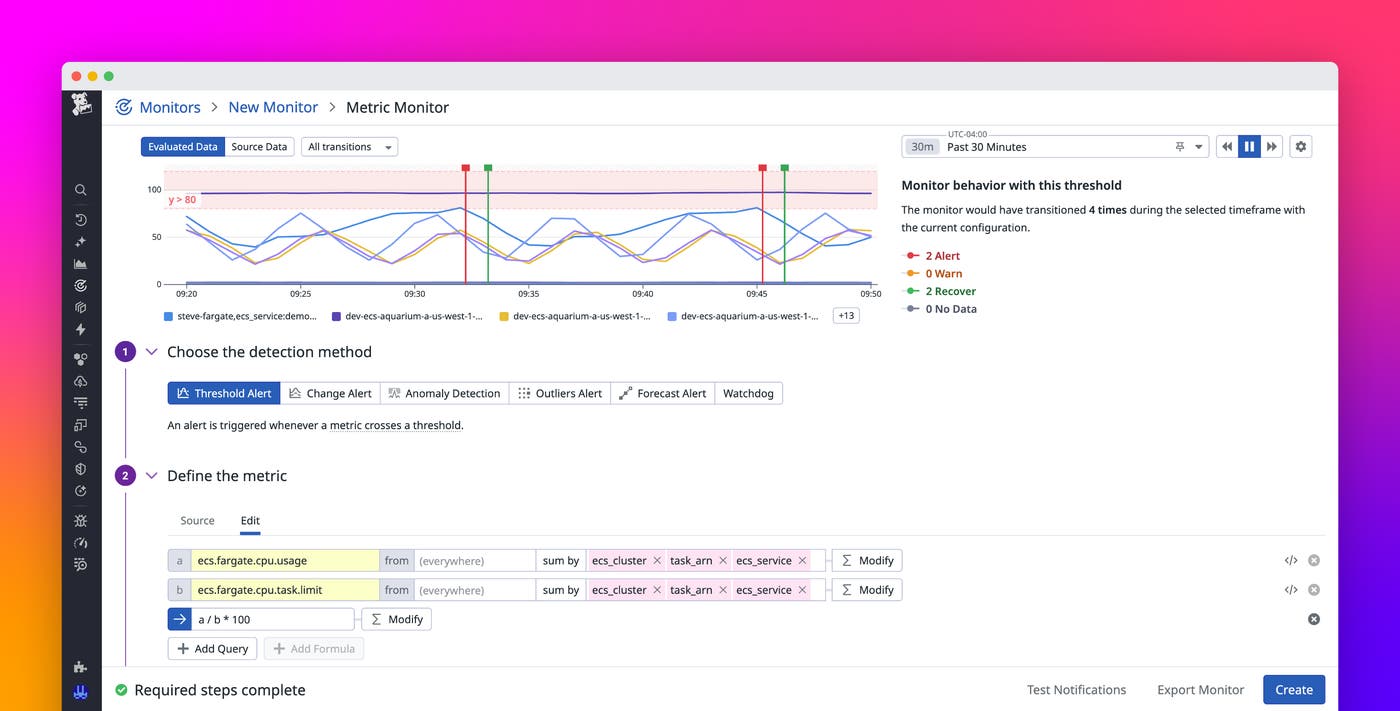
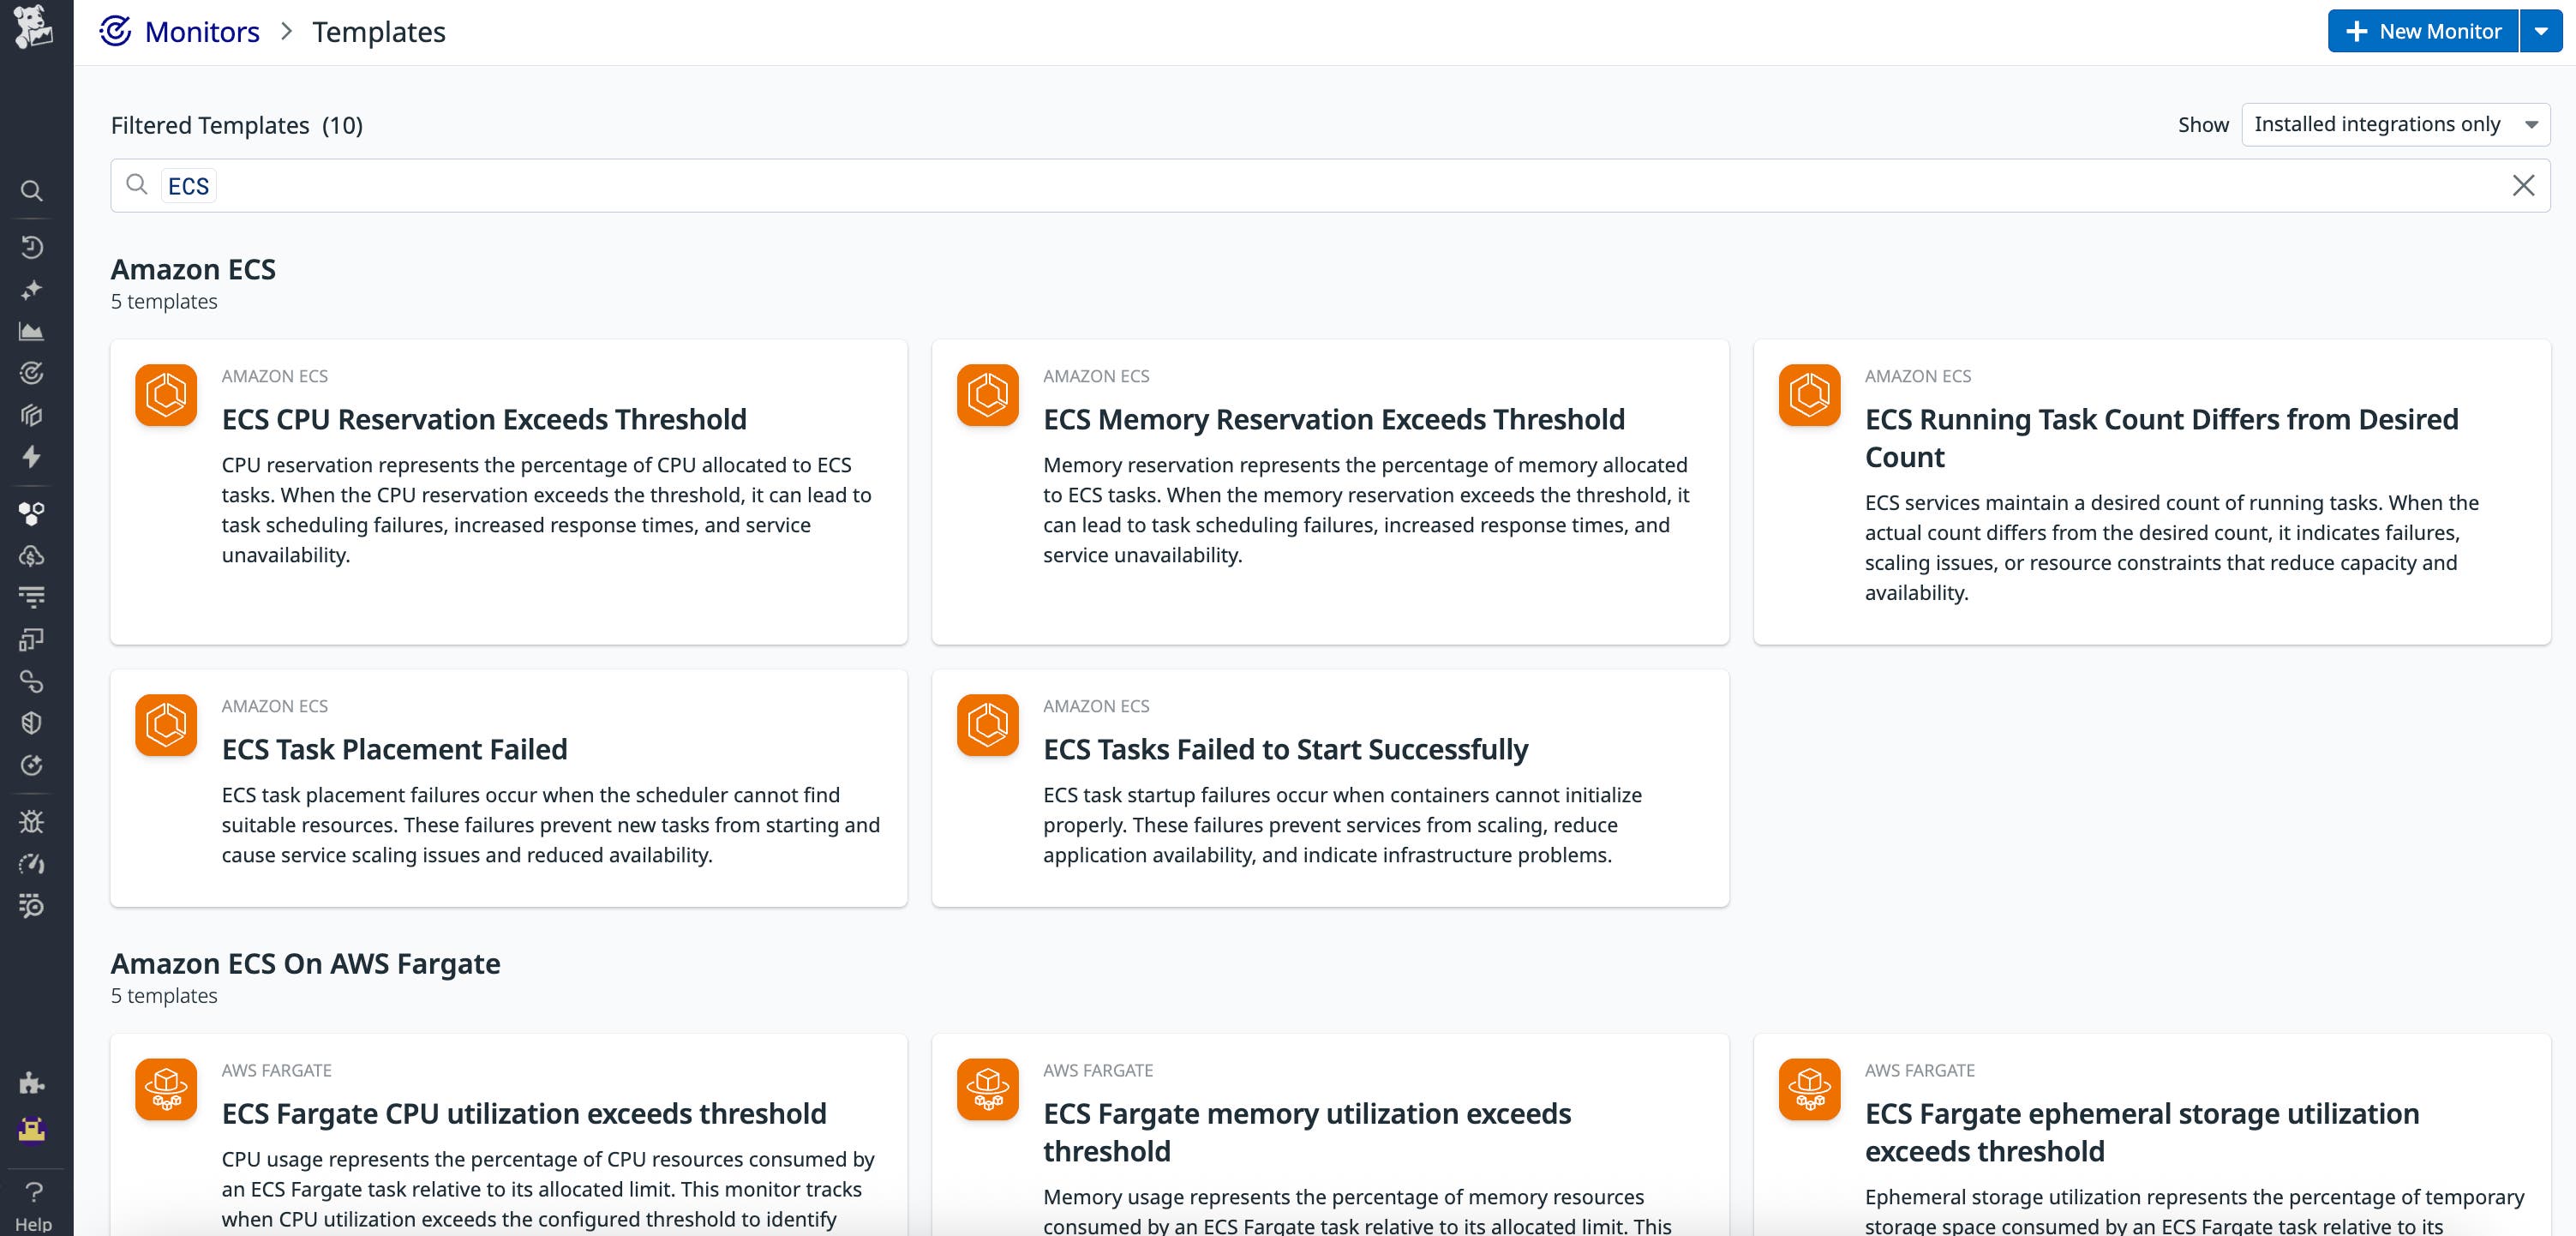
Datadog’s default monitors for ECS and Fargate cover common failure points such as CPU, memory, network health, and ephemeral storage. You can enable these default monitors from the ECS Monitors page in Datadog and customize thresholds for your environment.
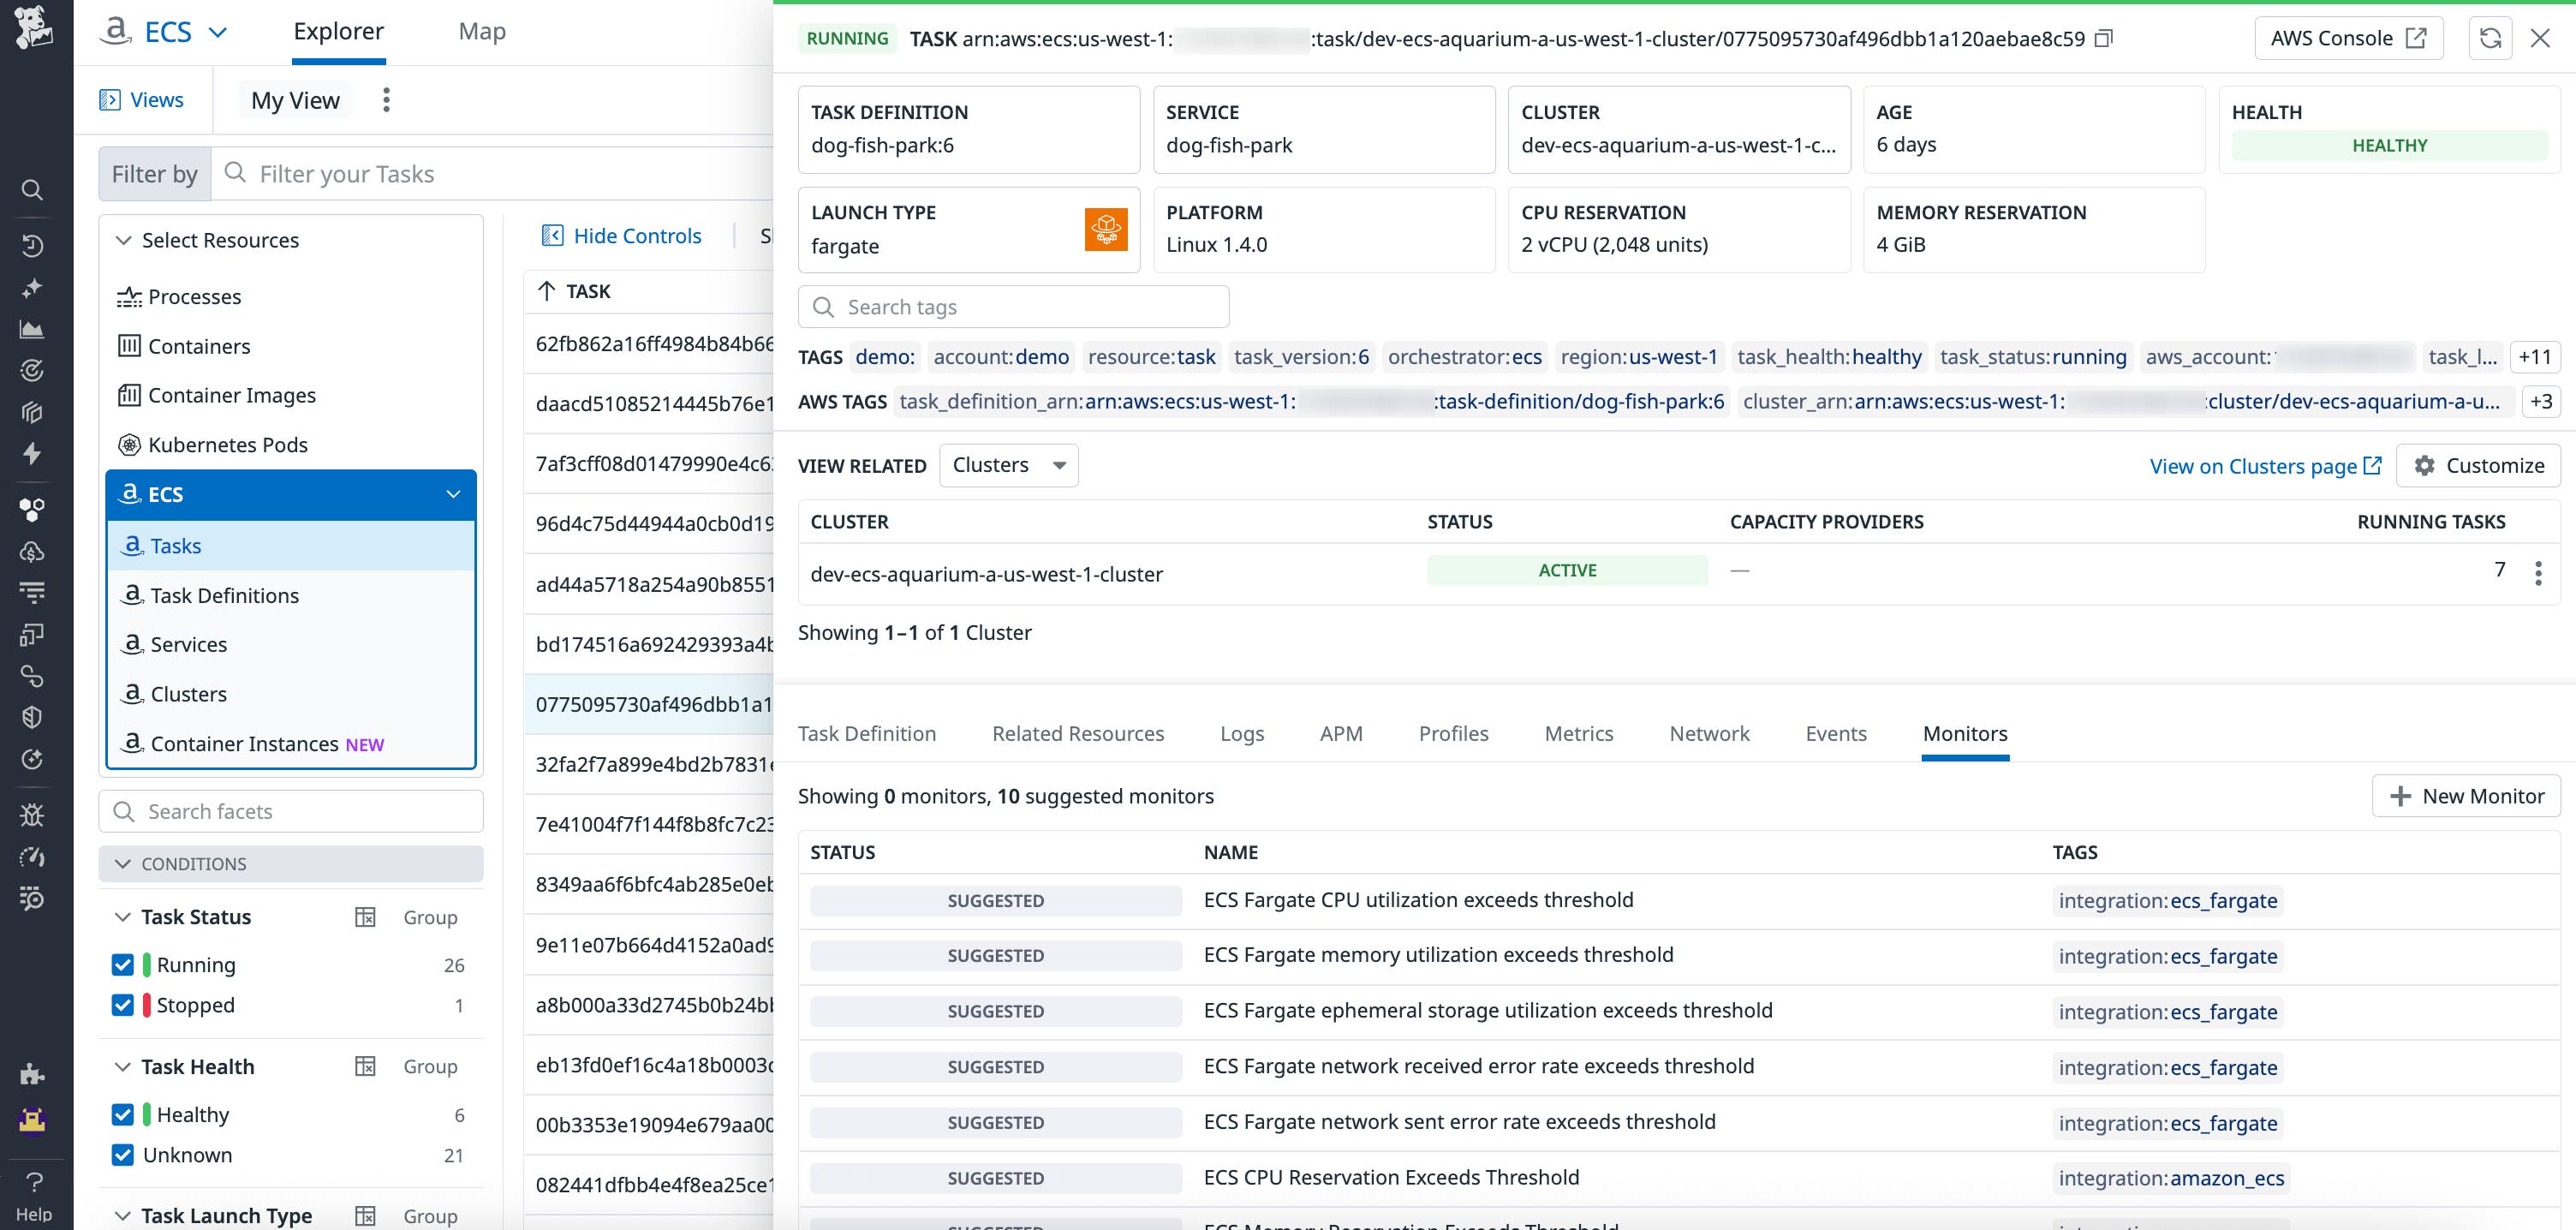
From any triggered alert, you can pivot directly to the ECS Explorer. There, you’ll see the affected cluster, service, and task alongside key context: the running task definition, recent changes, logs, and service events. This workflow is designed to get you from “something is wrong” to a concrete hypothesis and resolution without switching tools.
Identify cluster-level issues before they cascade
In ECS, a cluster is a grouping of resources where your services and tasks run. The cluster provides the underlying infrastructure, which can be in the form of container instances (Amazon EC2) or serverless compute (Fargate). When a cluster is constrained, symptoms appear everywhere: Tasks remain pending, services can’t scale, and latency climbs.
Datadog’s default monitors surface early signs of resource contention, such as high CPU and memory reservation. These findings indicate that most of the cluster’s capacity is already allocated to tasks. The resulting monitor alert links you to the ECS Explorer, where you can take the following steps:
- Compare CPU and memory utilization across all services in the cluster.
- Identify which services are being over-reserved relative to actual usage.
- Decide whether to adjust resource limits or scale the cluster.
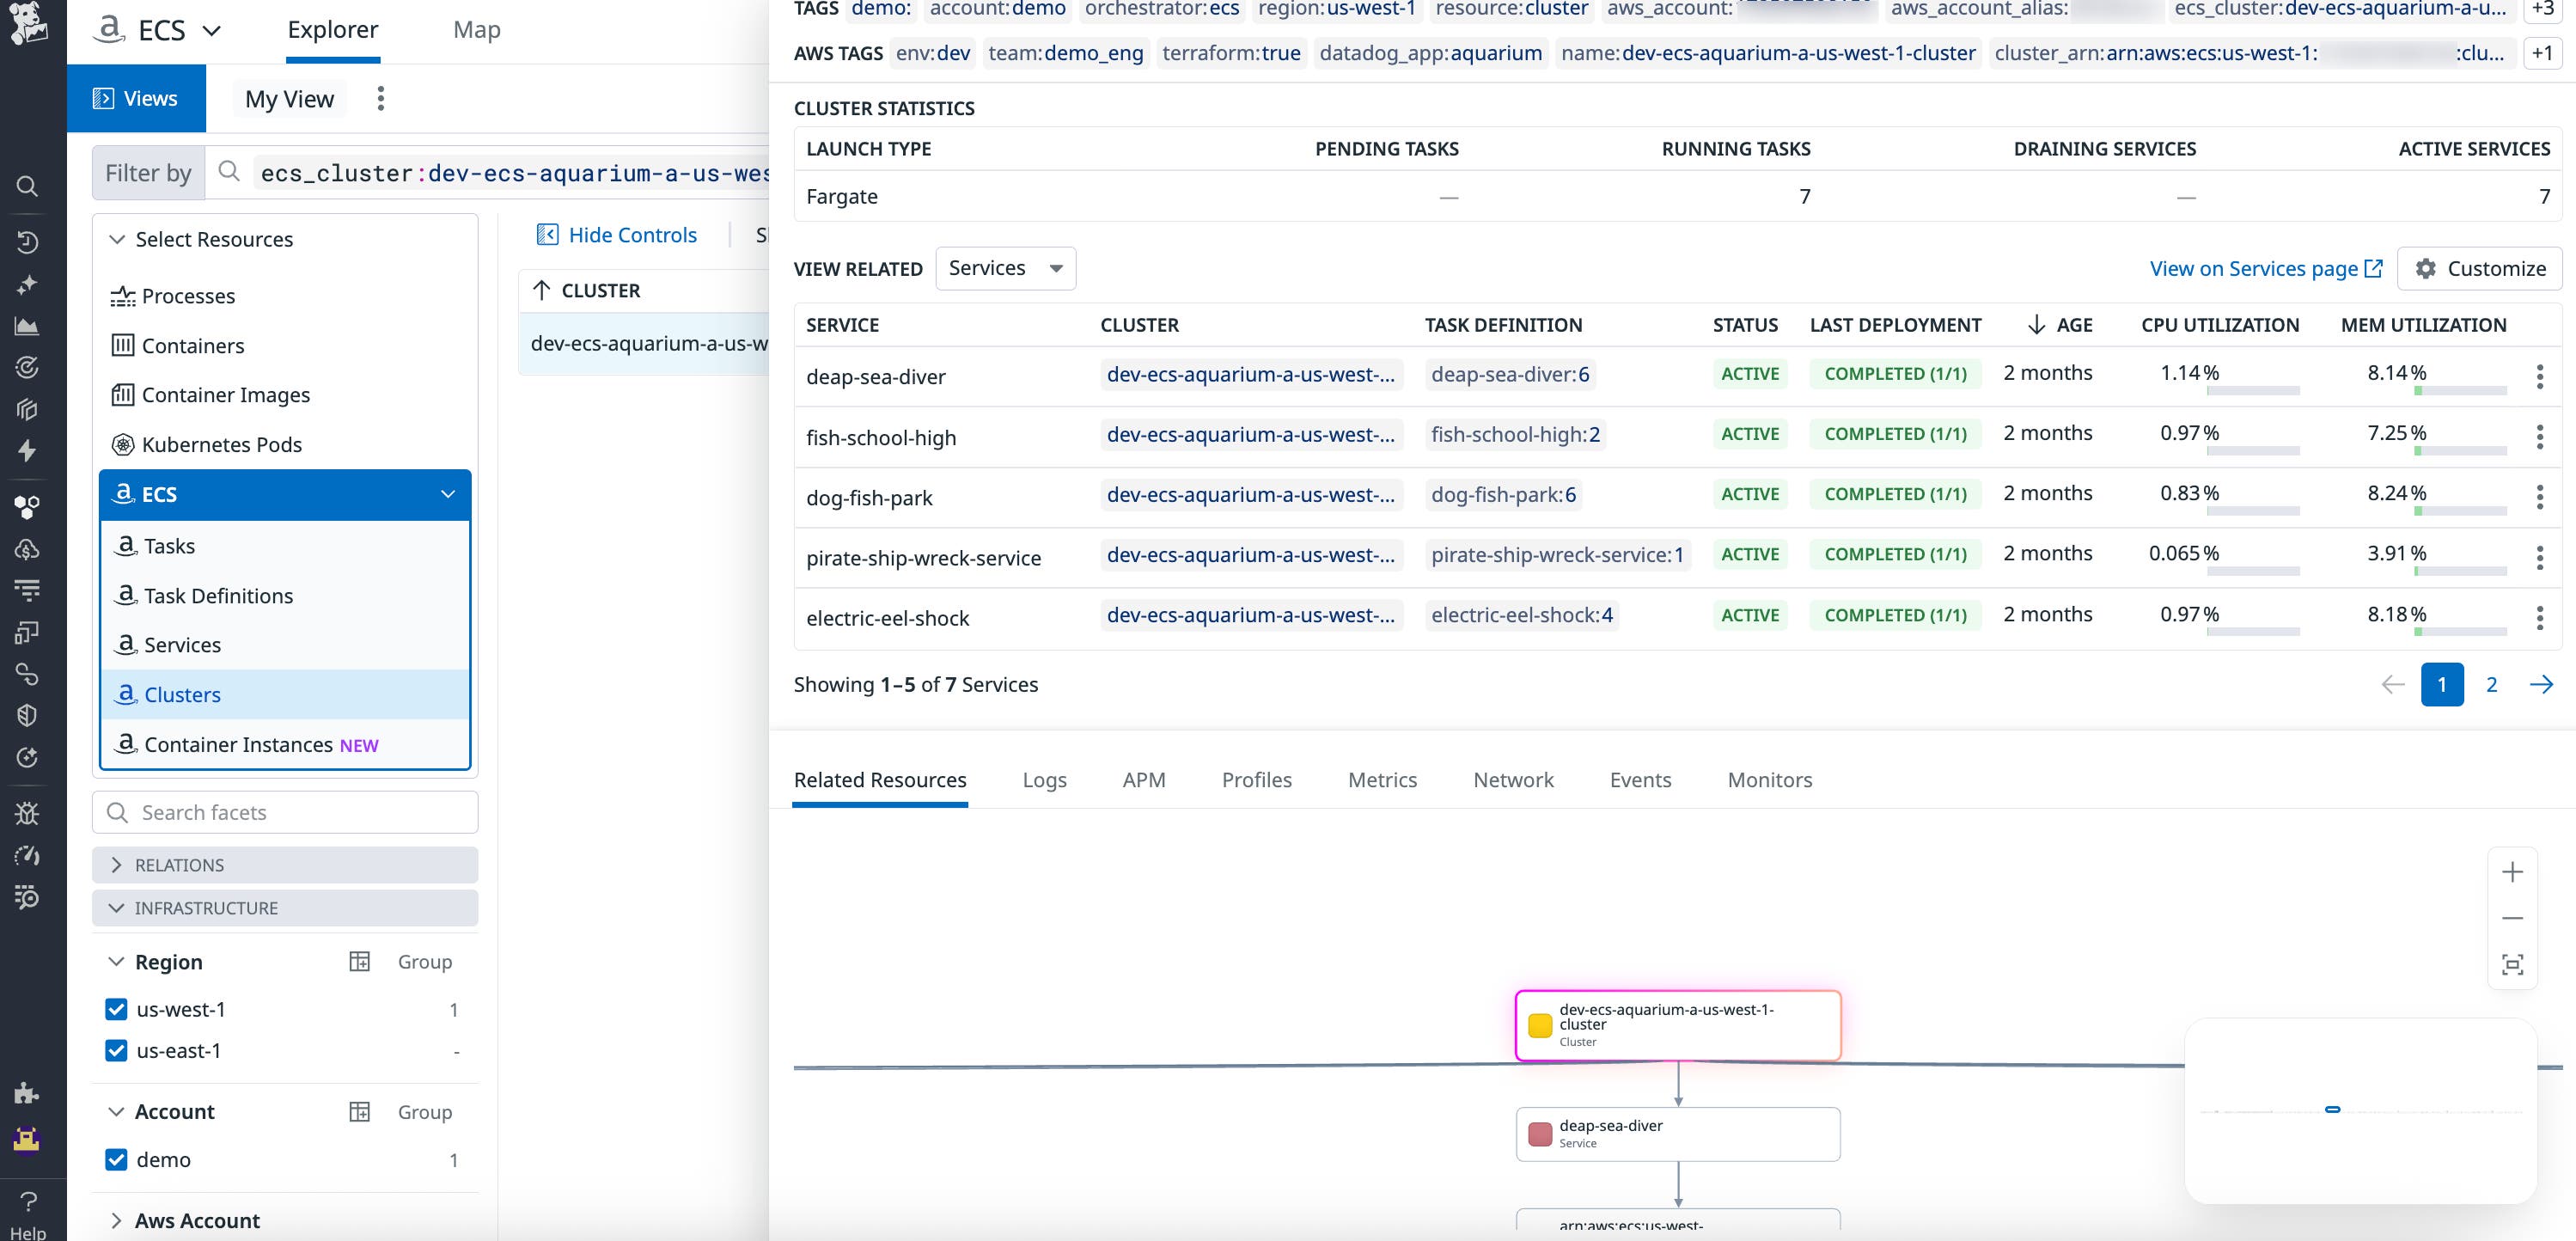
Cluster issues often lead to placement failures, where new tasks can’t start. The ECS Explorer service panel shows pending vs. running tasks, recent service events (for example, a task state change), and the current task definition.
You can open the task definition side panel to check for misconfigured quotas, missing permissions, and mismatched limits. If changes are necessary, you can roll out a corrected definition.
Zero in on Fargate task-level failures
Because Fargate abstracts the underlying compute, you need task-level visibility to resolve failures quickly. Datadog’s task monitors and the ECS Explorer help you mitigate common problems at the task level.
CPU and memory issues
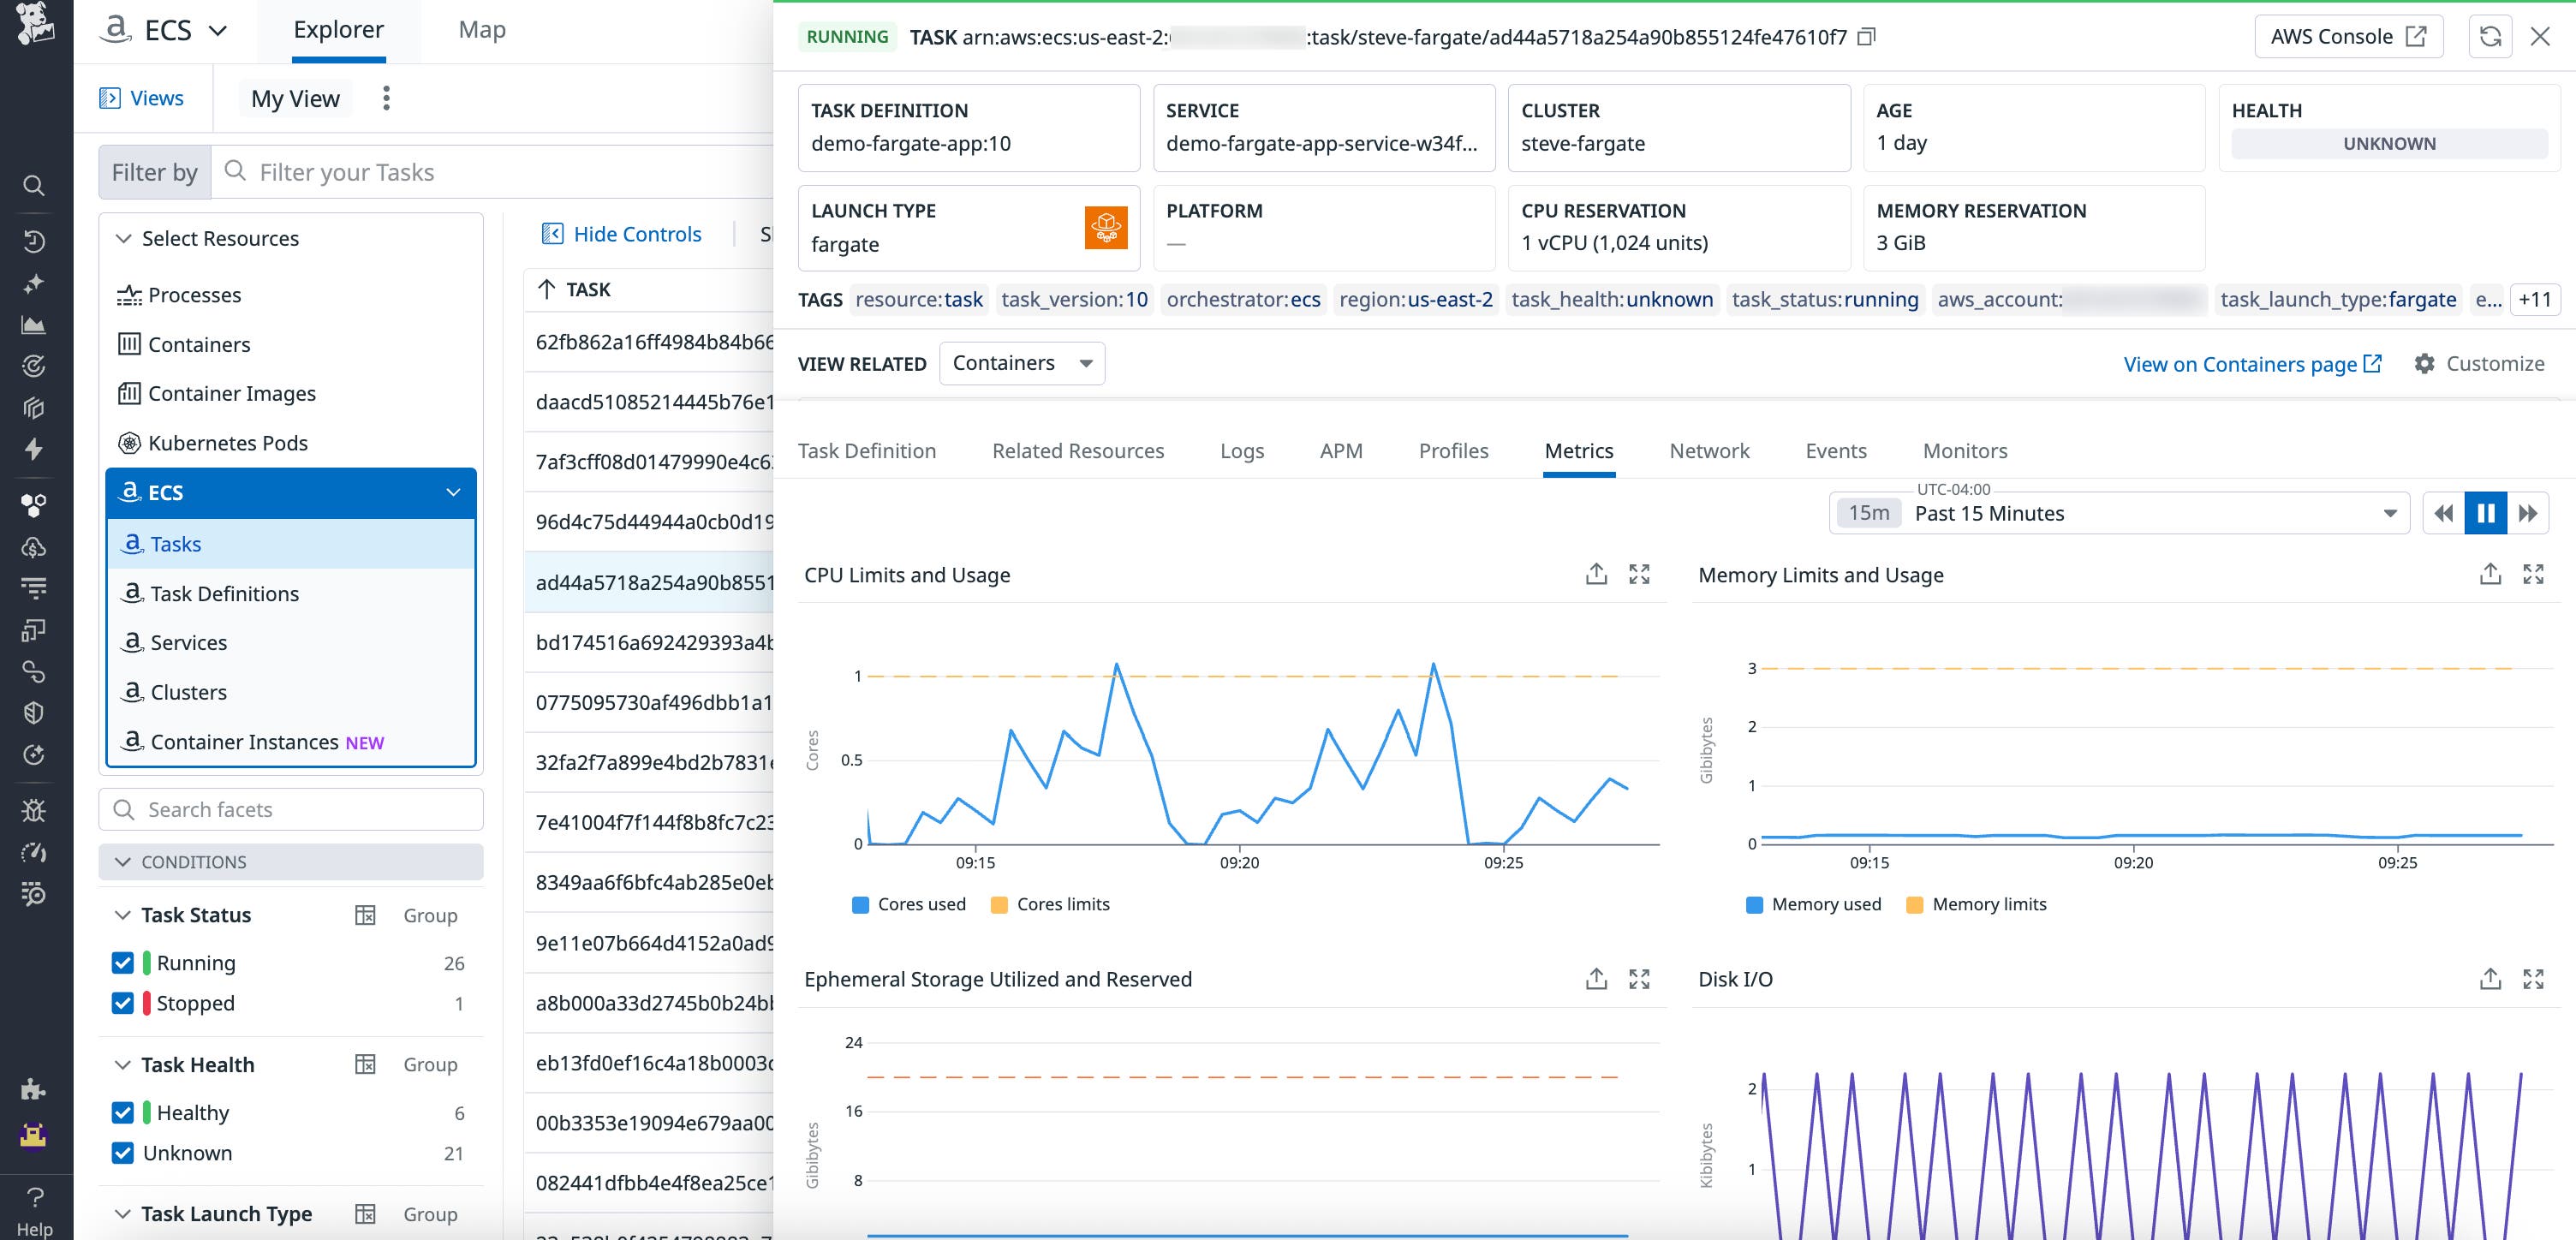
When utilization exceeds provisioned resources, tasks might fail to start or throttle under load. From the triggered alert that you receive, you can jump to the affected task to check real-time CPU and memory. You can then open the associated task definition to check the requested CPU and memory values, and adjust the resources to better match the observed demand.
Networking problems
Fargate tasks can encounter networking errors if AWS networking resources are misconfigured. For example, improperly configured VPC routes, subnet assignments, and security groups are common issues.
From the alert, you can pivot to the ECS Explorer to review the task’s network configuration and recent service events. Then you can correlate spikes in network errors with APM traces to identify code paths or deployments that introduced connectivity issues.
Ephemeral storage limits
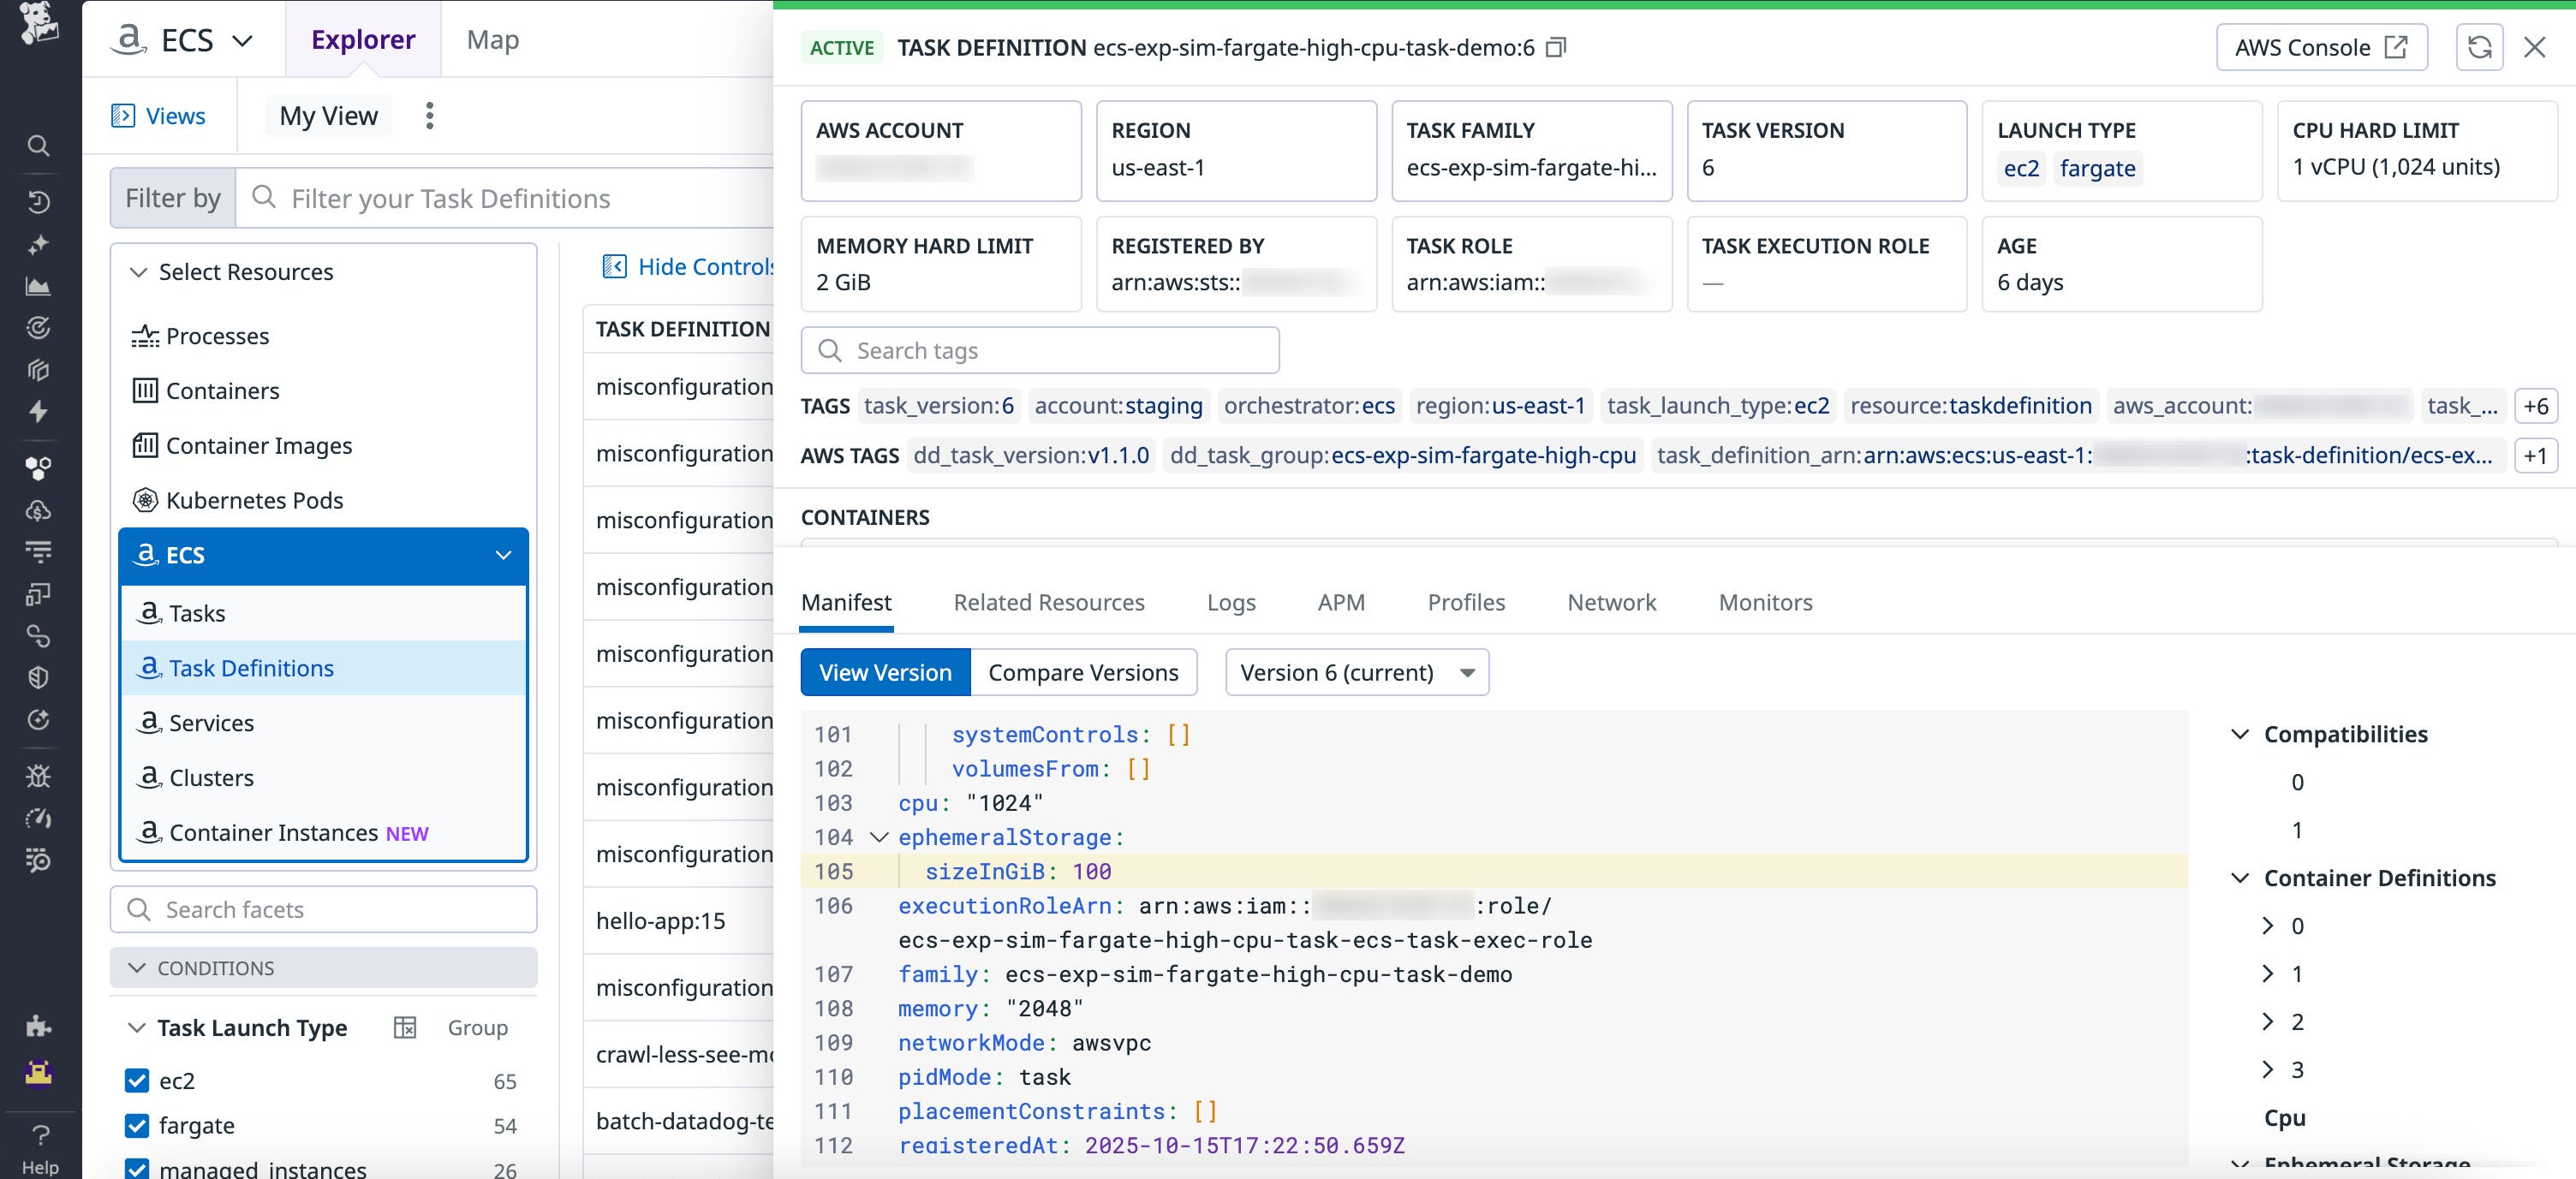
Fargate tasks use ephemeral storage for logs, temporary files, and caches. When space runs out, tasks fail. Datadog includes a default monitor for this condition. From the alert, open the task definition to adjust the ephemeralStorage.sizeInGiB value as needed.
Regressions after deployments
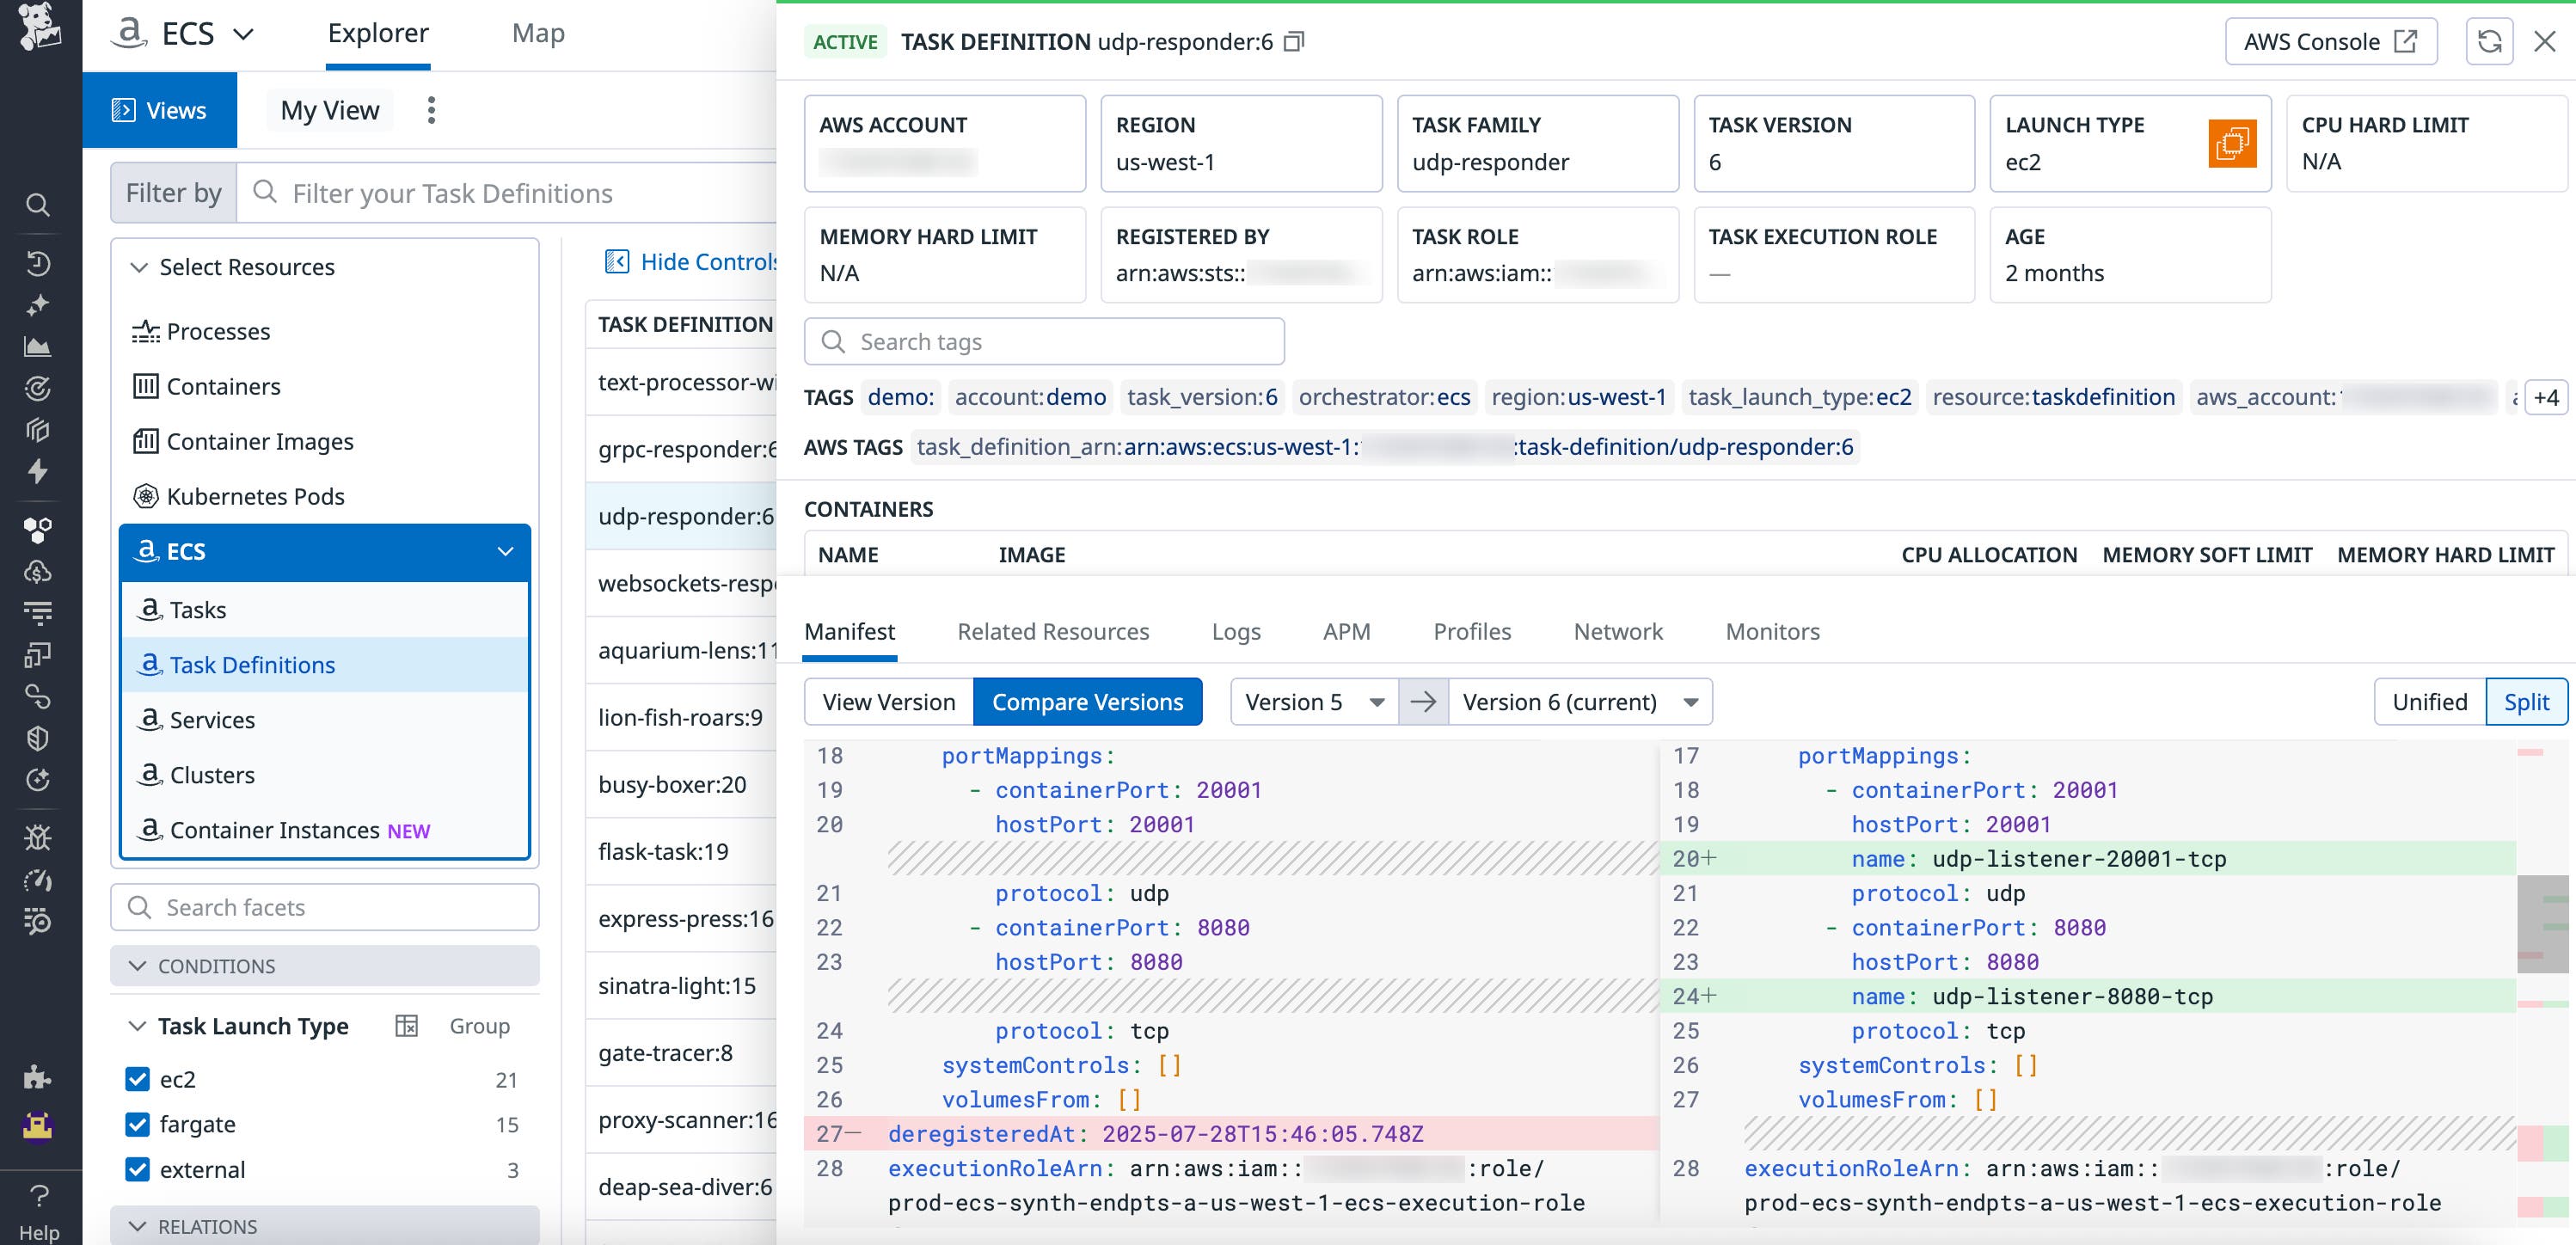
When behavior changes after a deployment, you can compare recent task definition versions and container images directly in the ECS Explorer. The side-by-side diff highlights changes in configuration or image tags, making it clear whether a new release introduced the issue.
Improve your ECS monitoring with Datadog
Datadog’s default monitors for ECS and Fargate help you detect common issues—including resource saturation, placement failures, network errors, and ephemeral storage limits—and connect them to the task or service at fault. With the ability to pivot directly from alerts to information in the ECS Explorer, you can investigate and resolve problems faster. To learn more, check out our ECS documentation and ECS Explorer documentation.
If you don’t already have a Datadog account, you can sign up for a 14-day free trial to get started.
