Andrew Southard
Collecting observability data like metrics, traces, and logs makes it much easier to identify bottlenecks and other performance problems in your .NET applications. When you need to troubleshoot a production incident, it's especially important to be able to navigate all that data so you can find the source of the issue and enact a timely resolution.
Datadog enables you to pivot seamlessly between metrics, logs, and traces from any of your applications, infrastructure components, or services. To provide even more granular insight into .NET application performance, Datadog now automatically correlates logs and traces at the level of individual requests. So when you receive an alert about a performance problem in your .NET application, you can troubleshoot the issue efficiently by:
- Browsing aggregated performance metrics for the affected service or endpoints to narrow the scope of your investigation
- Inspecting end-to-end traces of problematic requests to see where in the call stack the issue originated
- Drilling down to correlated logs from those requests for richer context to identify the root cause
In this post, we'll show you how automatically correlating your .NET logs with distributed traces can help you identify, investigate, and resolve performance problems.
Auto-correlation for faster investigation
Automatically correlating your logs with APM data enables you to investigate and resolve performance issues much faster, without the friction of switching tools and contexts. Distributed tracing and APM is a powerful way to detect performance anomalies and dive right into investigation by inspecting how real user requests are being executed from end to end.
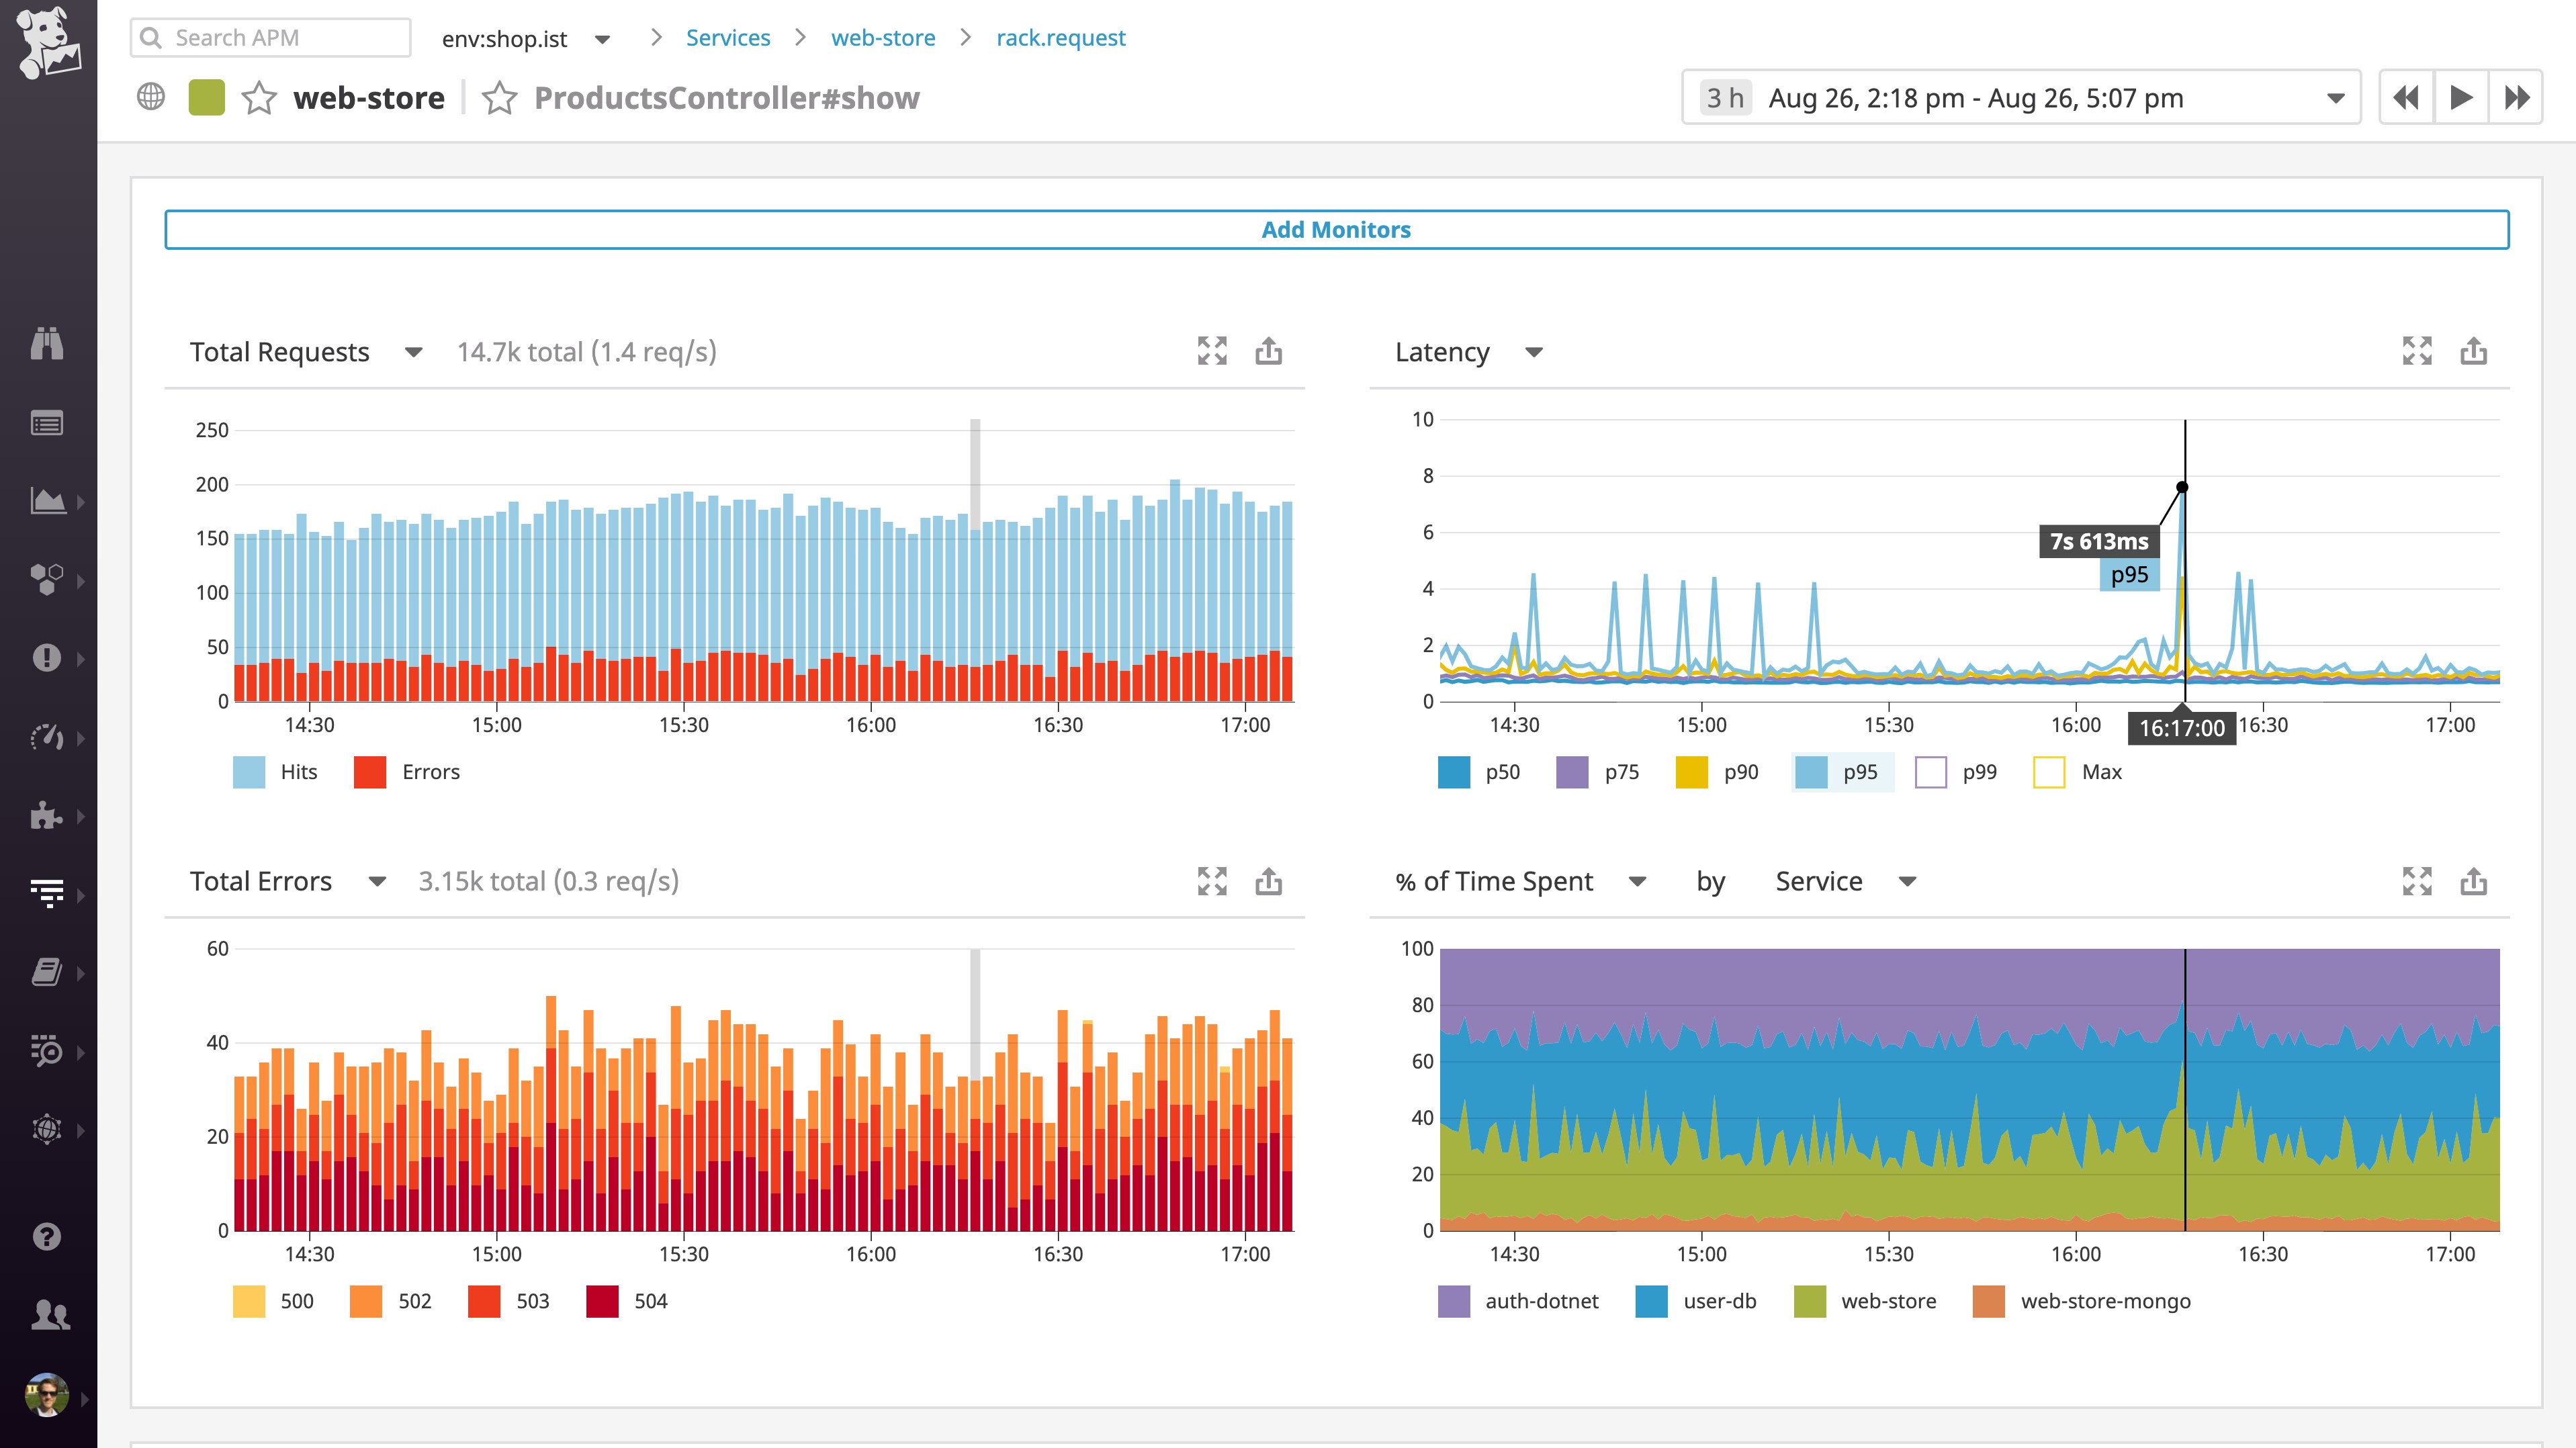
For instance, if you receive an alert about elevated latency on a controller that generates product pages in your e-commerce app, you can dive immediately into APM data for that controller. In the screenshot below, we can see that p95 latency is spiking for show requests to the ProductsController in our polyglot web application, which uses a .NET authentication service to check whether a user is logged in before displaying user information on product pages.

Break down request-level trends in the Span Summary
Datadog APM automatically summarizes performance stats for each resource (e.g., an endpoint, action, or query) in your application, and breaks down where your application is spending the most time while serving requests. In the screenshot below, you can see two interesting datapoints on the overview dashboard for the slow ProductsController#show resource: most of the time in serving product pages is spent in the auth-dotnet authentication service and in making calls to the user-db database. You can also see that each request involves, on average, 16 queries to the PostgreSQL database to check the expiration time of the user session. Because 16 separate queries is probably excessive, the next step in troubleshooting is determining why all those queries are being made.

Dive into request execution
The trace view in Datadog APM allows you to visualize how all these queries, calls, and other operations fit together in terms of the overall timeline of executing a request. Traces automatically capture correlated service logs and host-level metrics, so you can navigate quickly between all the data pertaining to a request.
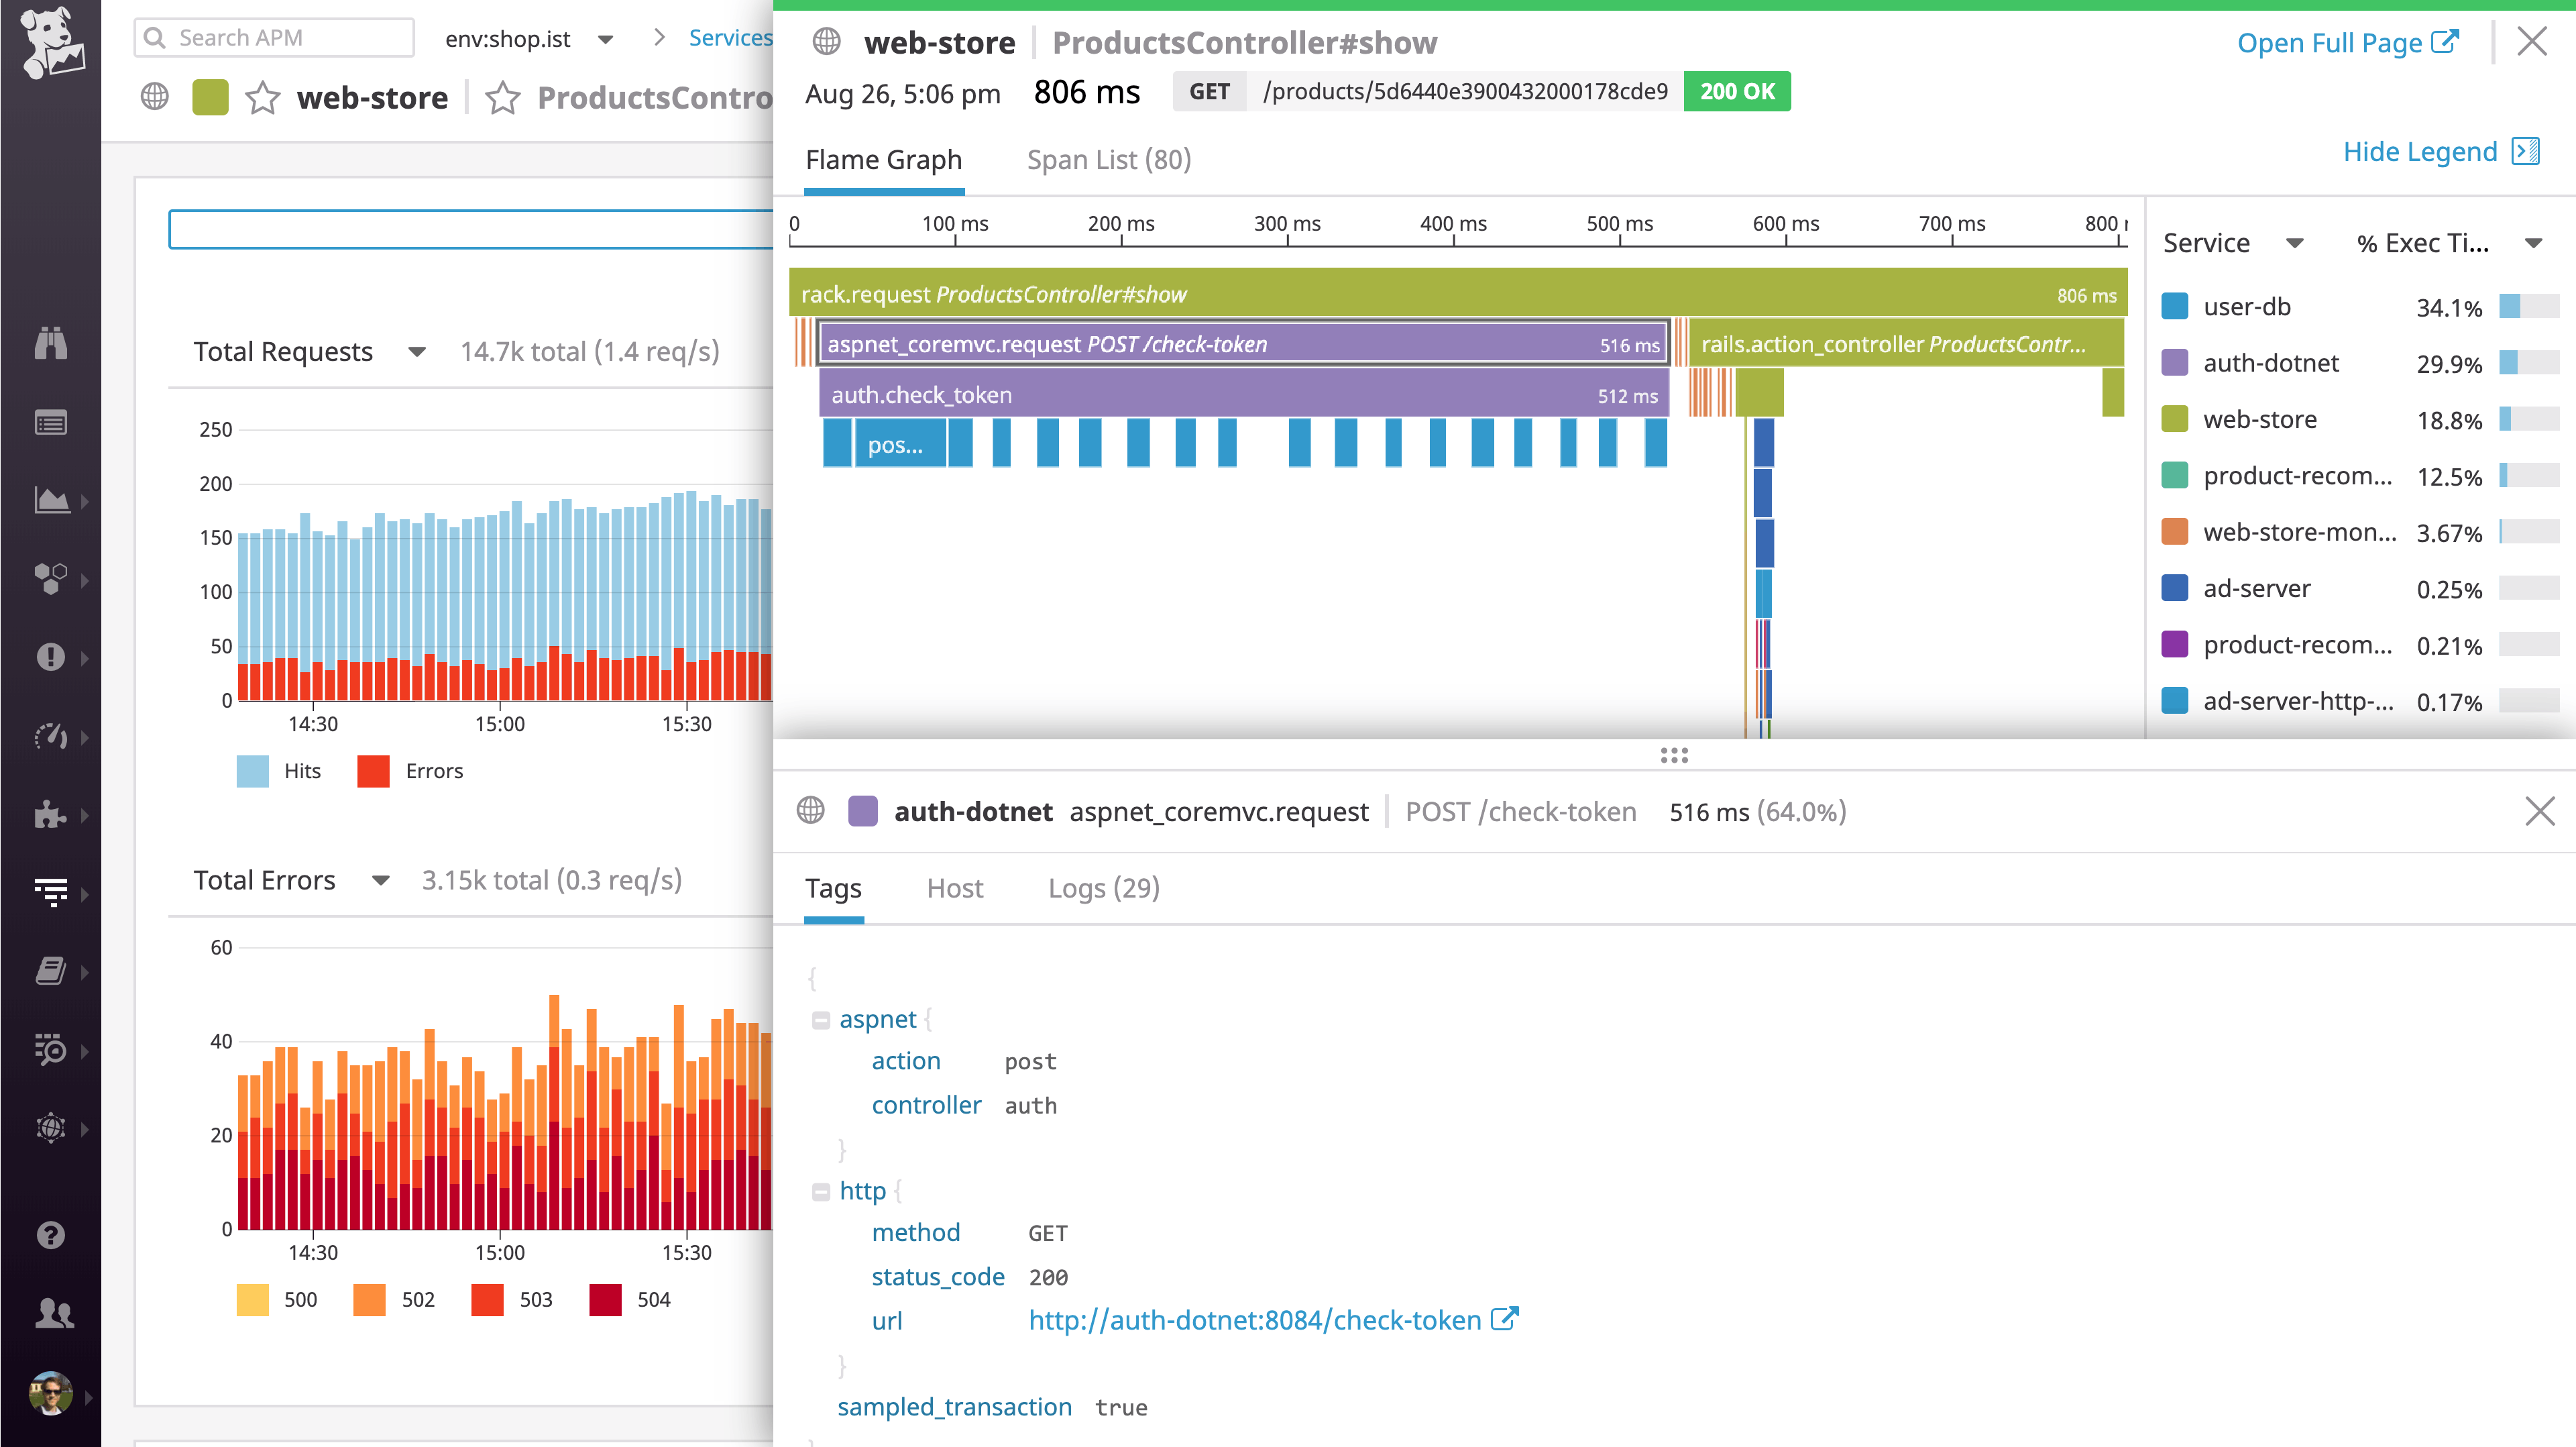
In this example, diving into traces for individual requests allows you to see whether the authentication service's latency is directly related to the excessive number of PostgreSQL queries. In the trace below, we can see that the auth-dotnet service (purple spans) is indeed calling the user-db database service (blue spans) over and over again. It appears that performance is suffering due to an N+1 query pattern, in which the application makes multiple independent calls to the database unnecessarily.

Pivot to logs to diagnose the cause
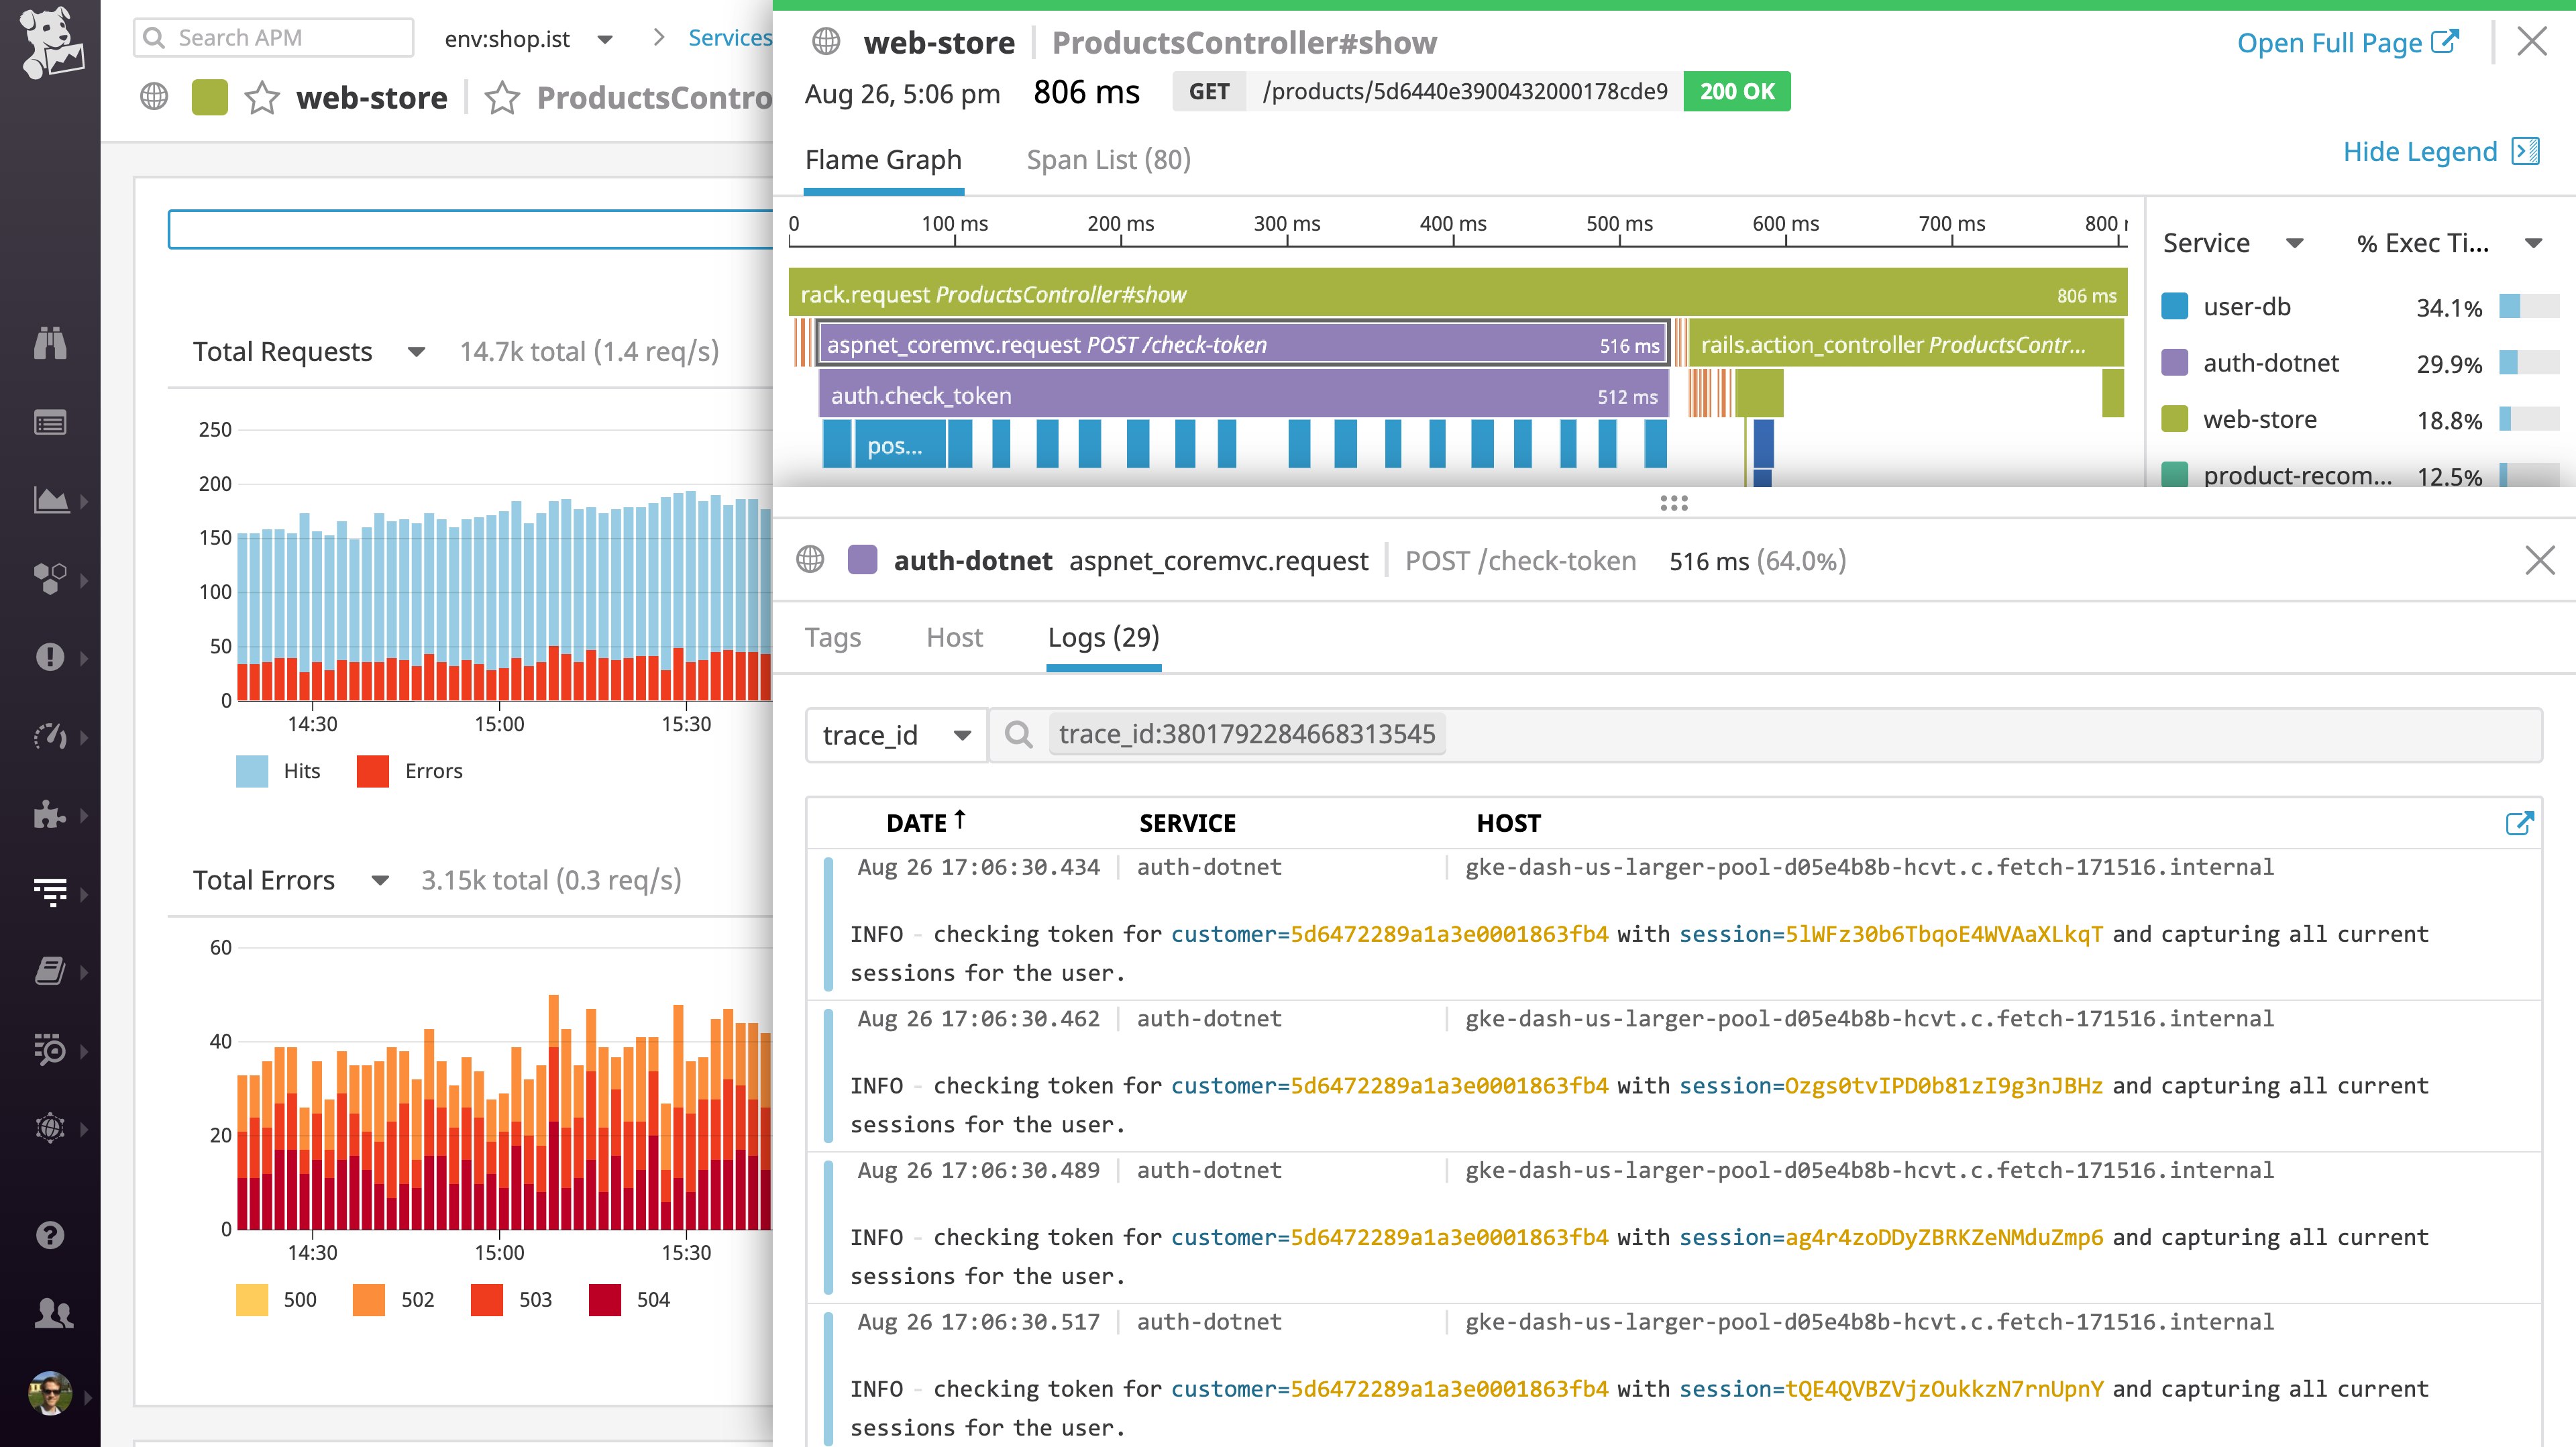
To get a deeper look into the problem, you can pivot directly to the logs that your application generated while serving this request. Clicking on the "Logs" tab in the trace view displays the logs from all of the services that acted on this request, as identified by a unique trace_id that is automatically added to your logs. In the example below, you can see the logs from our .NET service (auth-dotnet), along with logs from all the interdependent services that helped fulfill this request.
The correlated logs reveal the source of the issue. The .NET authentication service is checking and re-checking the same user token for each session ID individually, rather than checking the token once and storing any needed information about the user's status. Fixing the application logic to prevent the explosion of database calls would reduce the complexity of executing the request and would also eliminate a performance bottleneck.

Filter and contextualize your .NET logs
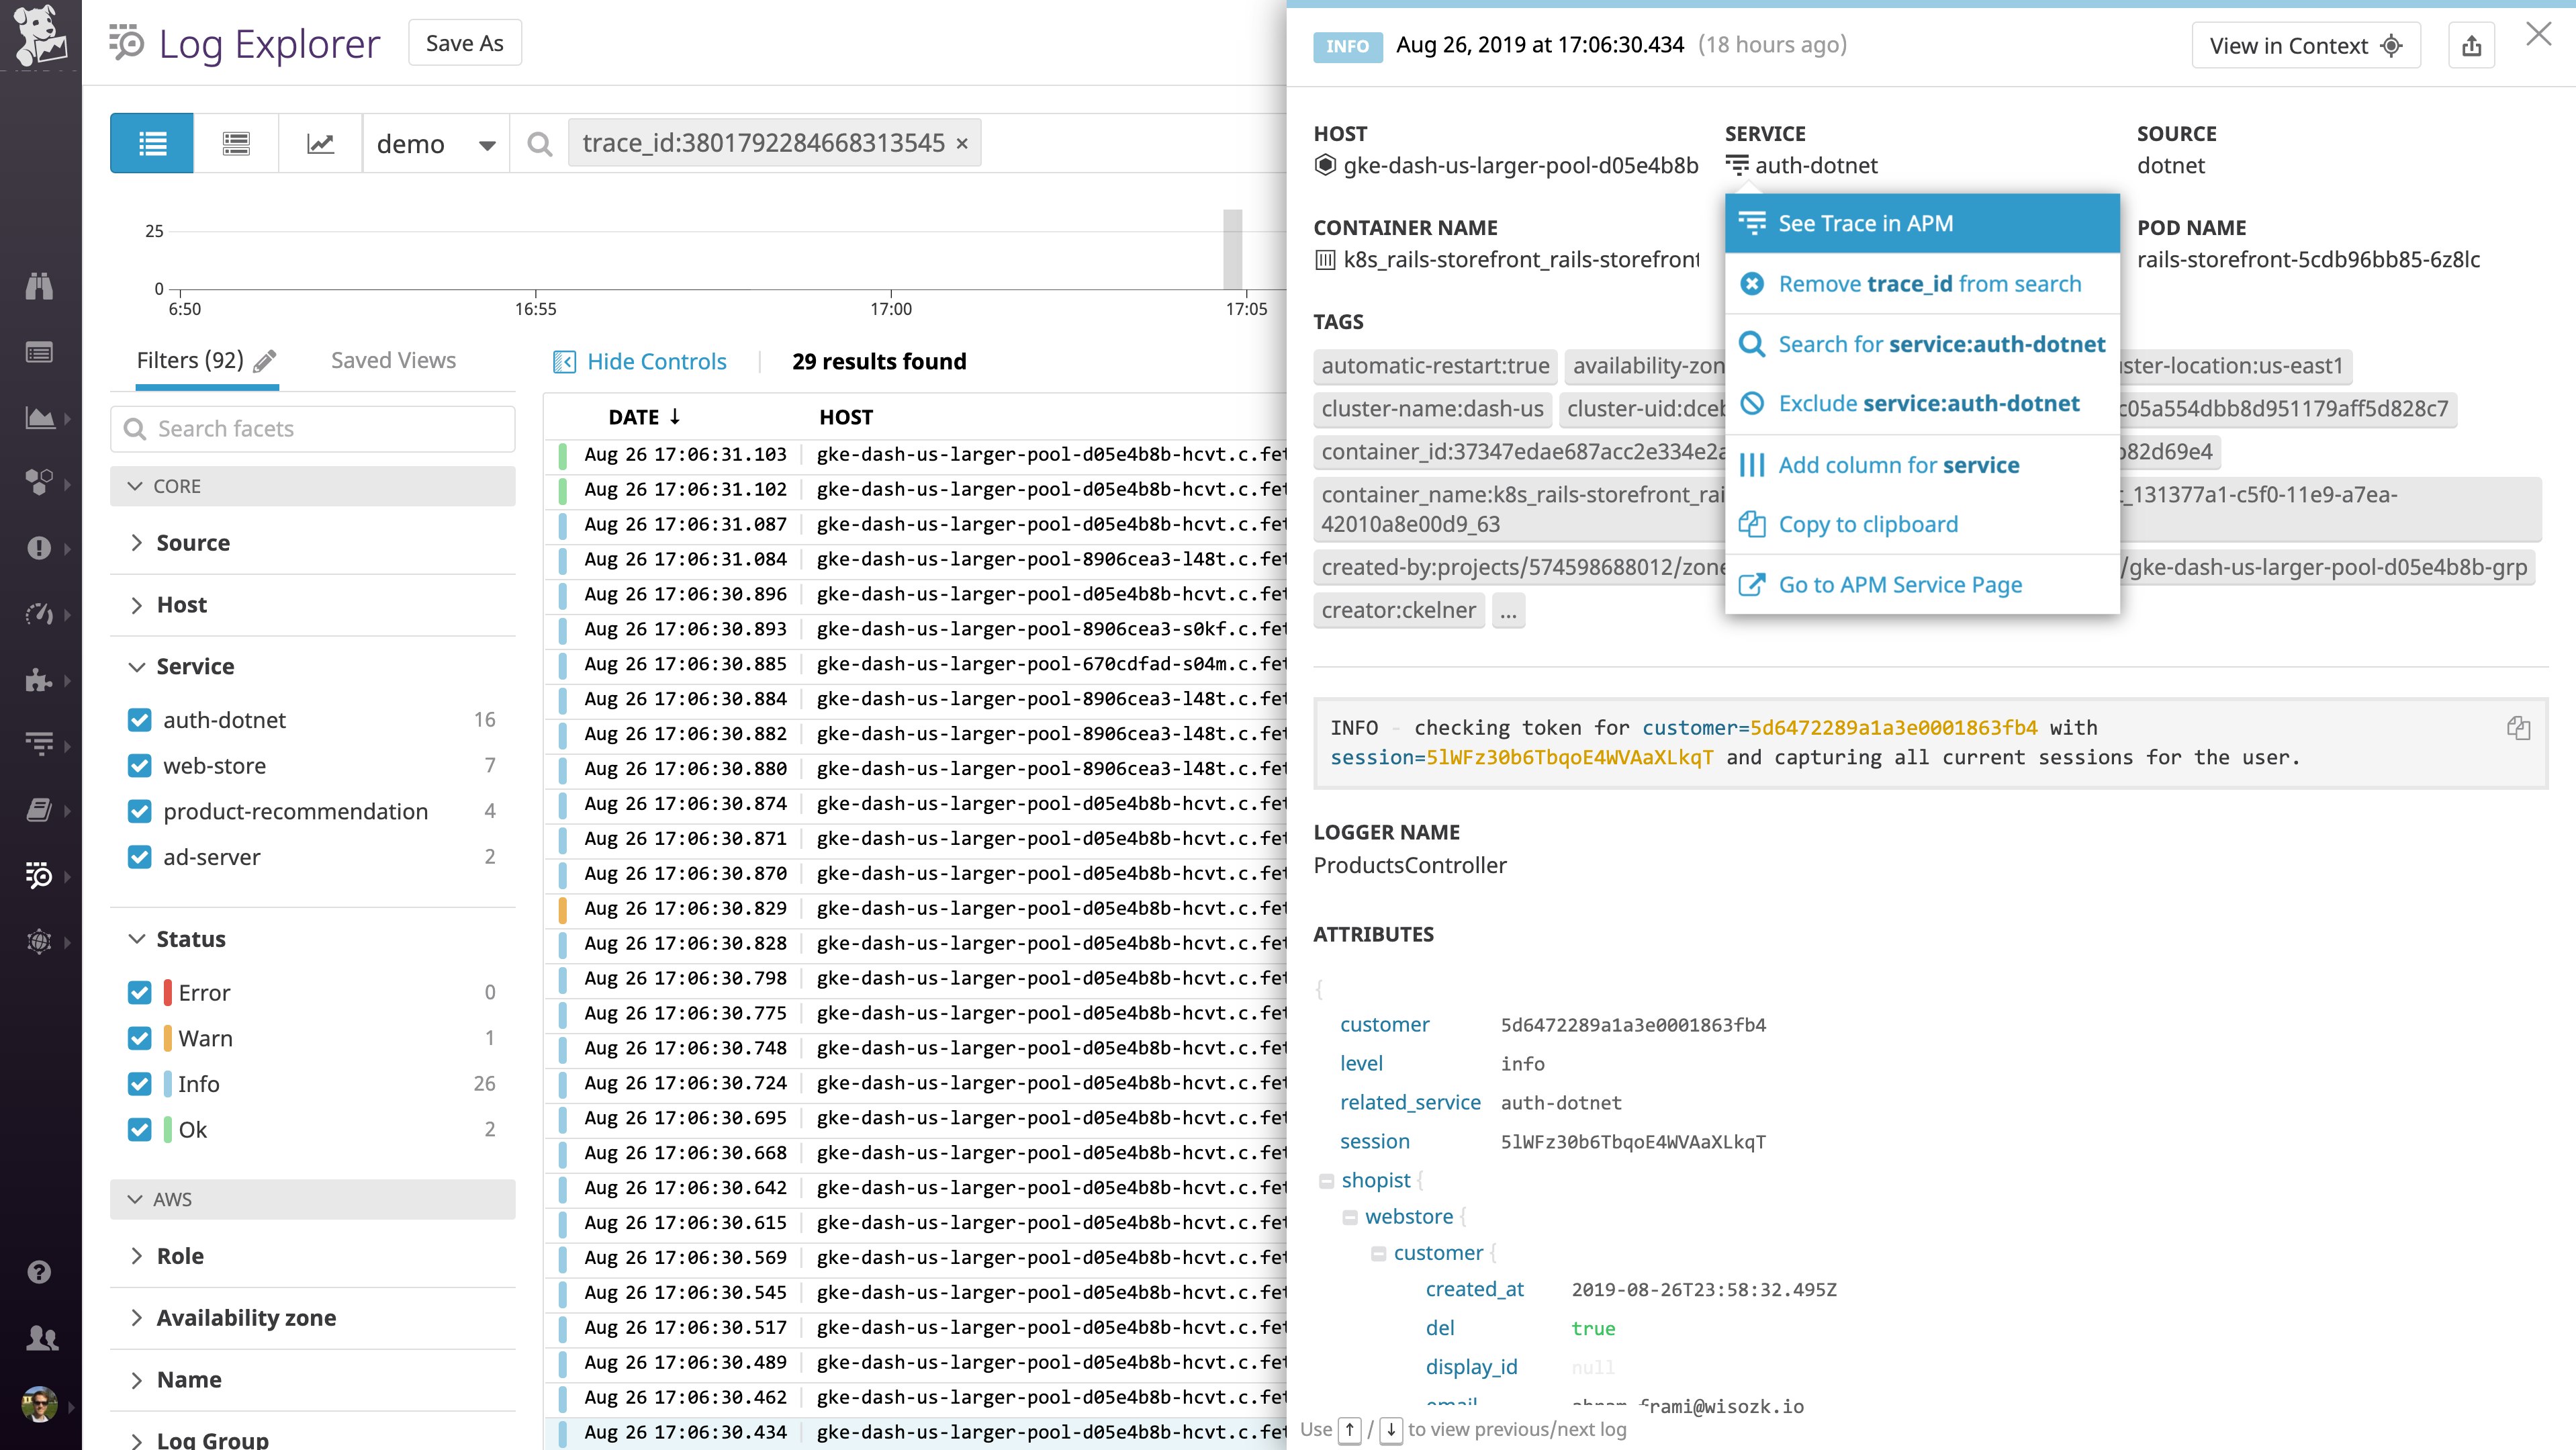
The connection between logs and traces is bi-directional, so from an individual log entry, you can click to see the trace of the request or transaction that was being carried out when that log was generated. Viewing the trace allows you to interpret the causal chain of events in your application that led to the occurrence captured in the log. Tracing also provides performance context, so you can see if a logged event ultimately contributed to a user-facing error or added latency in the handling of a request. For example, if you see an uptick in logged retries in calling an external API, you can pivot directly to APM to see whether those retries are causing excessive latency or even timeouts for your users.

In the Log Explorer, you can also filter by any single trace_id to narrow the full log stream down to just the logs from a particular request. Datadog's automated log-processing pipelines apply tags (such as the host, service, and availability zone) and extract attributes (such as HTTP response code, database user, or client IP address), so you can use that metadata to further filter your logs. For example, you can drill down to all the logs from a single request that returned an error, or view all the request logs for a particular subset of customers, such as your enterprise subscription tier.
How Datadog auto-correlates .NET logs and traces
Datadog’s distributed tracing library for .NET automatically propagates the context of a request as it traverses disparate hosts and services. This context propagation is what enables Datadog APM to reconstruct the full lifespan of a complex request in a distributed system. Datadog's .NET tracing library can now inject that same context (via a unique trace_id) into your logs, whether you use log4net, NLog, or Serilog. In Datadog, all the logs bearing the trace_id from a particular request automatically display in context with the complete trace of that request.
Get started
Correlating your .NET logs with distributed traces is as simple as changing a configuration setting in the .NET tracer for Datadog. Once you set DD_LOGS_INJECTION=true via environment variables or your application configuration files, Datadog's .NET tracer will automatically inject a trace_id into your .NET logs, enabling you to seamlessly correlate them with request traces. See our APM docs for more details.
If you aren't yet using Datadog to monitor your .NET applications, you can get started today by signing up for a free trial.


