
Jason Peterson
Note that Apache Mesos uses master/agent or master/slave terminology, which Datadog discourages in favor of "leader/agent." While we are deprecating noninclusive terms within our own products, such as our Mesos integrations, we still have a long road ahead of us. We thank you for your patience as we update our language.
Apache Mesos, as its developers tout, “abstracts the entire data center into a single pool of computing resources, simplifying running distributed systems at scale.” And that scale can be tremendous, as proven by prominent adopters such as Twitter, Airbnb, Netflix, and Apple (for Siri).
But Mesos is not the simplest system to deploy, as even its developers acknowledge. As a bare-bones kernel, it requires engineers to find and configure their own compatible solutions for service discovery, load balancing, monitoring, and other key tasks. That could mean more tinkering than you’re comfortable with, or a larger team than you have budget for.
To the rescue comes DC/OS (for "Datacenter Operating System”). As the name suggests, it’s a full-fledged operating system for Mesos clusters, bundled with compatible technologies to handle all the above tasks and more. Plus, it’s easy to install and configure, even for small teams.
Datadog + DC/OS
Datadog is a popular choice for monitoring Mesos clusters because it’s easy to deploy at scale, and it's designed to collect and aggregate data from distributed infrastructure components.
As we’ll show here, DC/OS makes it even easier to deploy the Datadog Agent across your Mesos cluster, and out-of-the-box integrations for Mesos, Docker, and related services let you view your cluster’s many metrics at whatever level of granularity you need.
Installing Datadog: Agent nodes first
Mesos clusters are composed of leader and agent nodes (both of which are explained here, along with other key Mesos concepts). We’ll start by installing Datadog on the agent nodes.
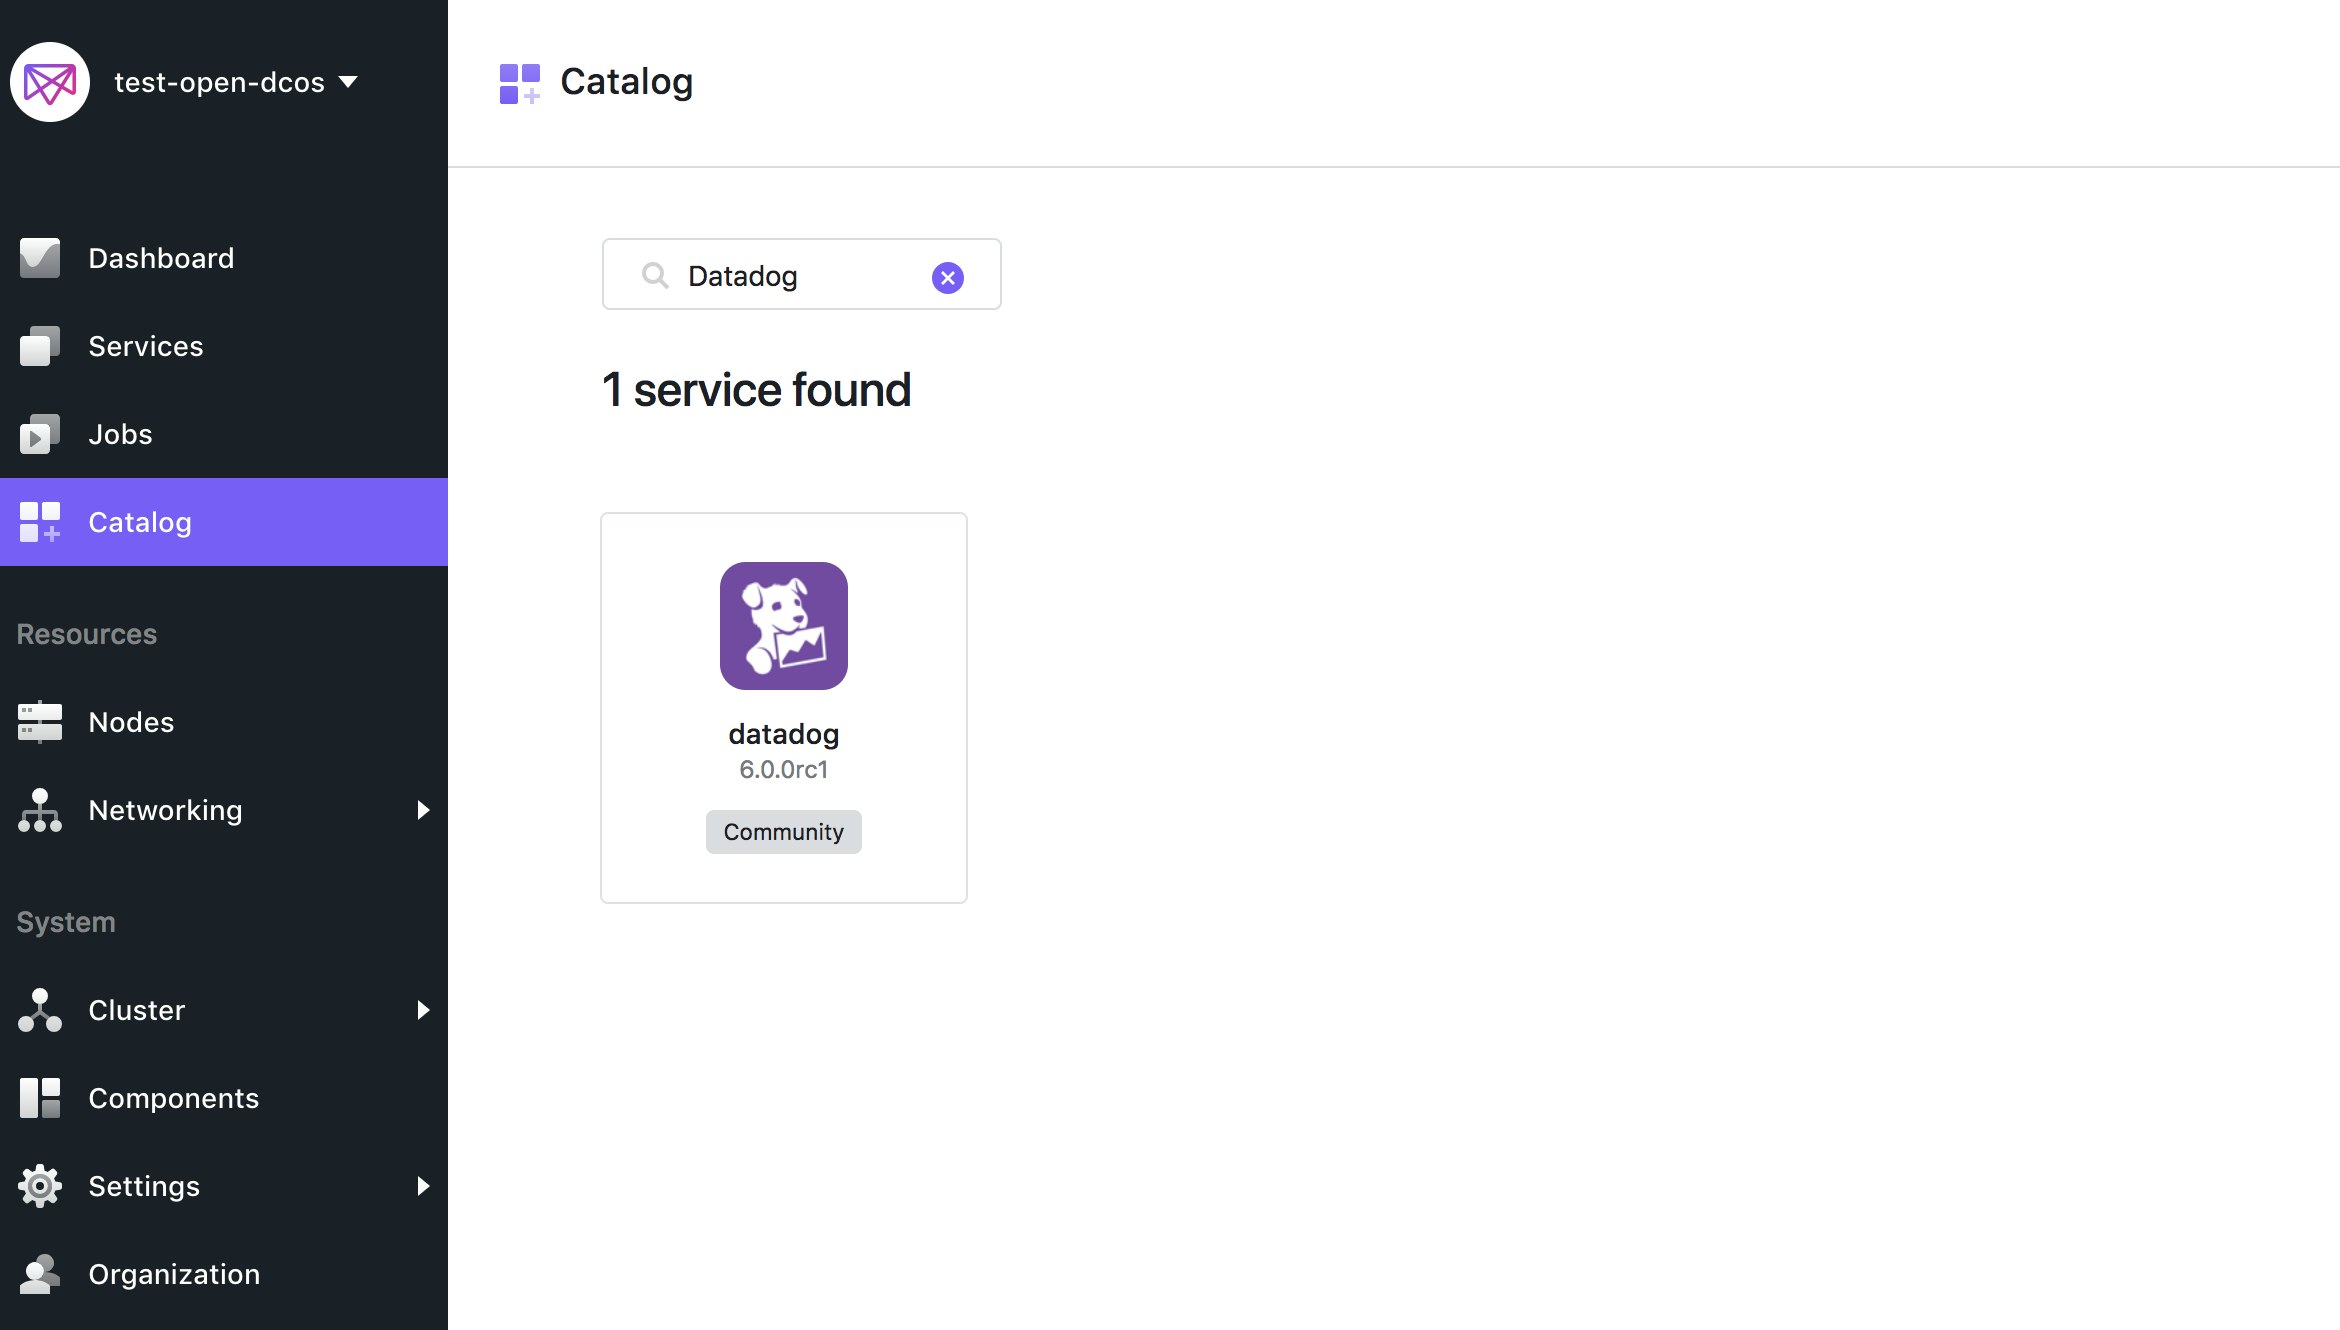
As you can see below, the DC/OS package catalog already includes Datadog, greatly simplifying the installation process. Just log into your leader node via the DC/OS web UI and click the Catalog link in the left column. Use the search field to find the Datadog service, then click the icon to continue.
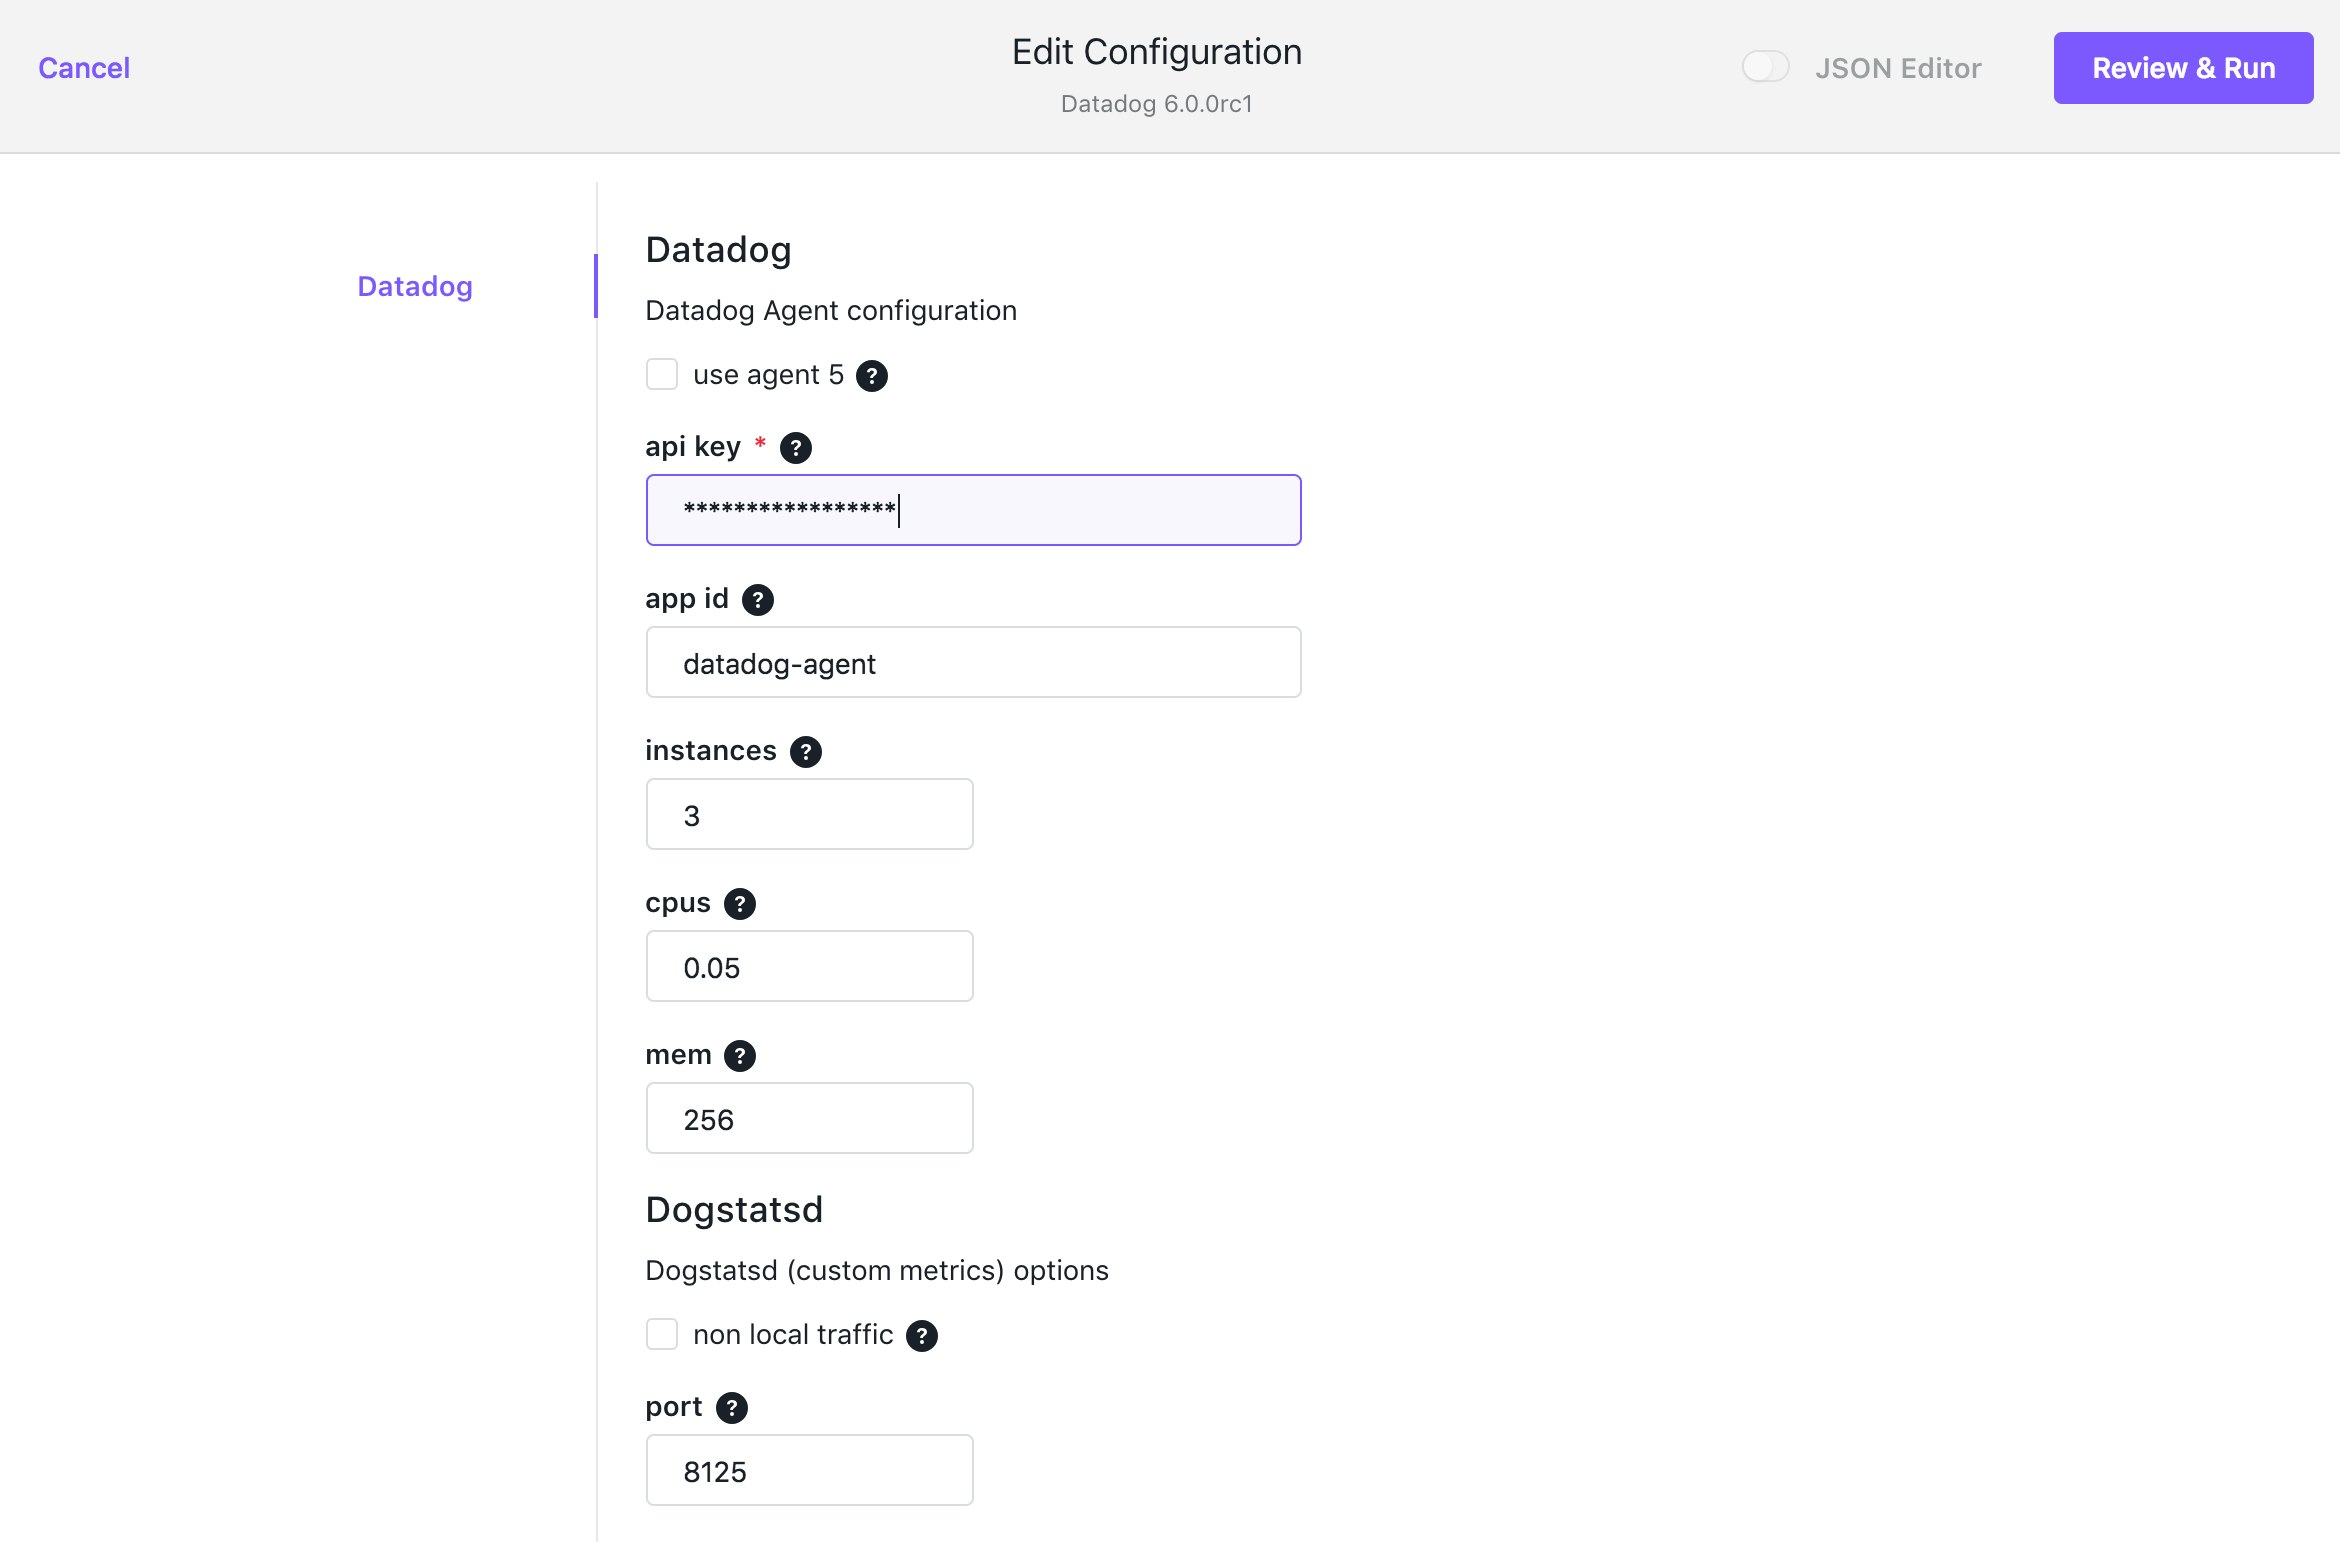
Next you'll see the Description page. Click the Review & Run button in the upper right to advance to the configuration form, shown in the screenshot below. Input your Datadog API key, then type the number of agent nodes in your cluster into the Instances field. (To view your node count, click the Nodes item on the left side of the DC/OS web UI.) You can leave the default values in all the other fields. Click Review & Run again to proceed.
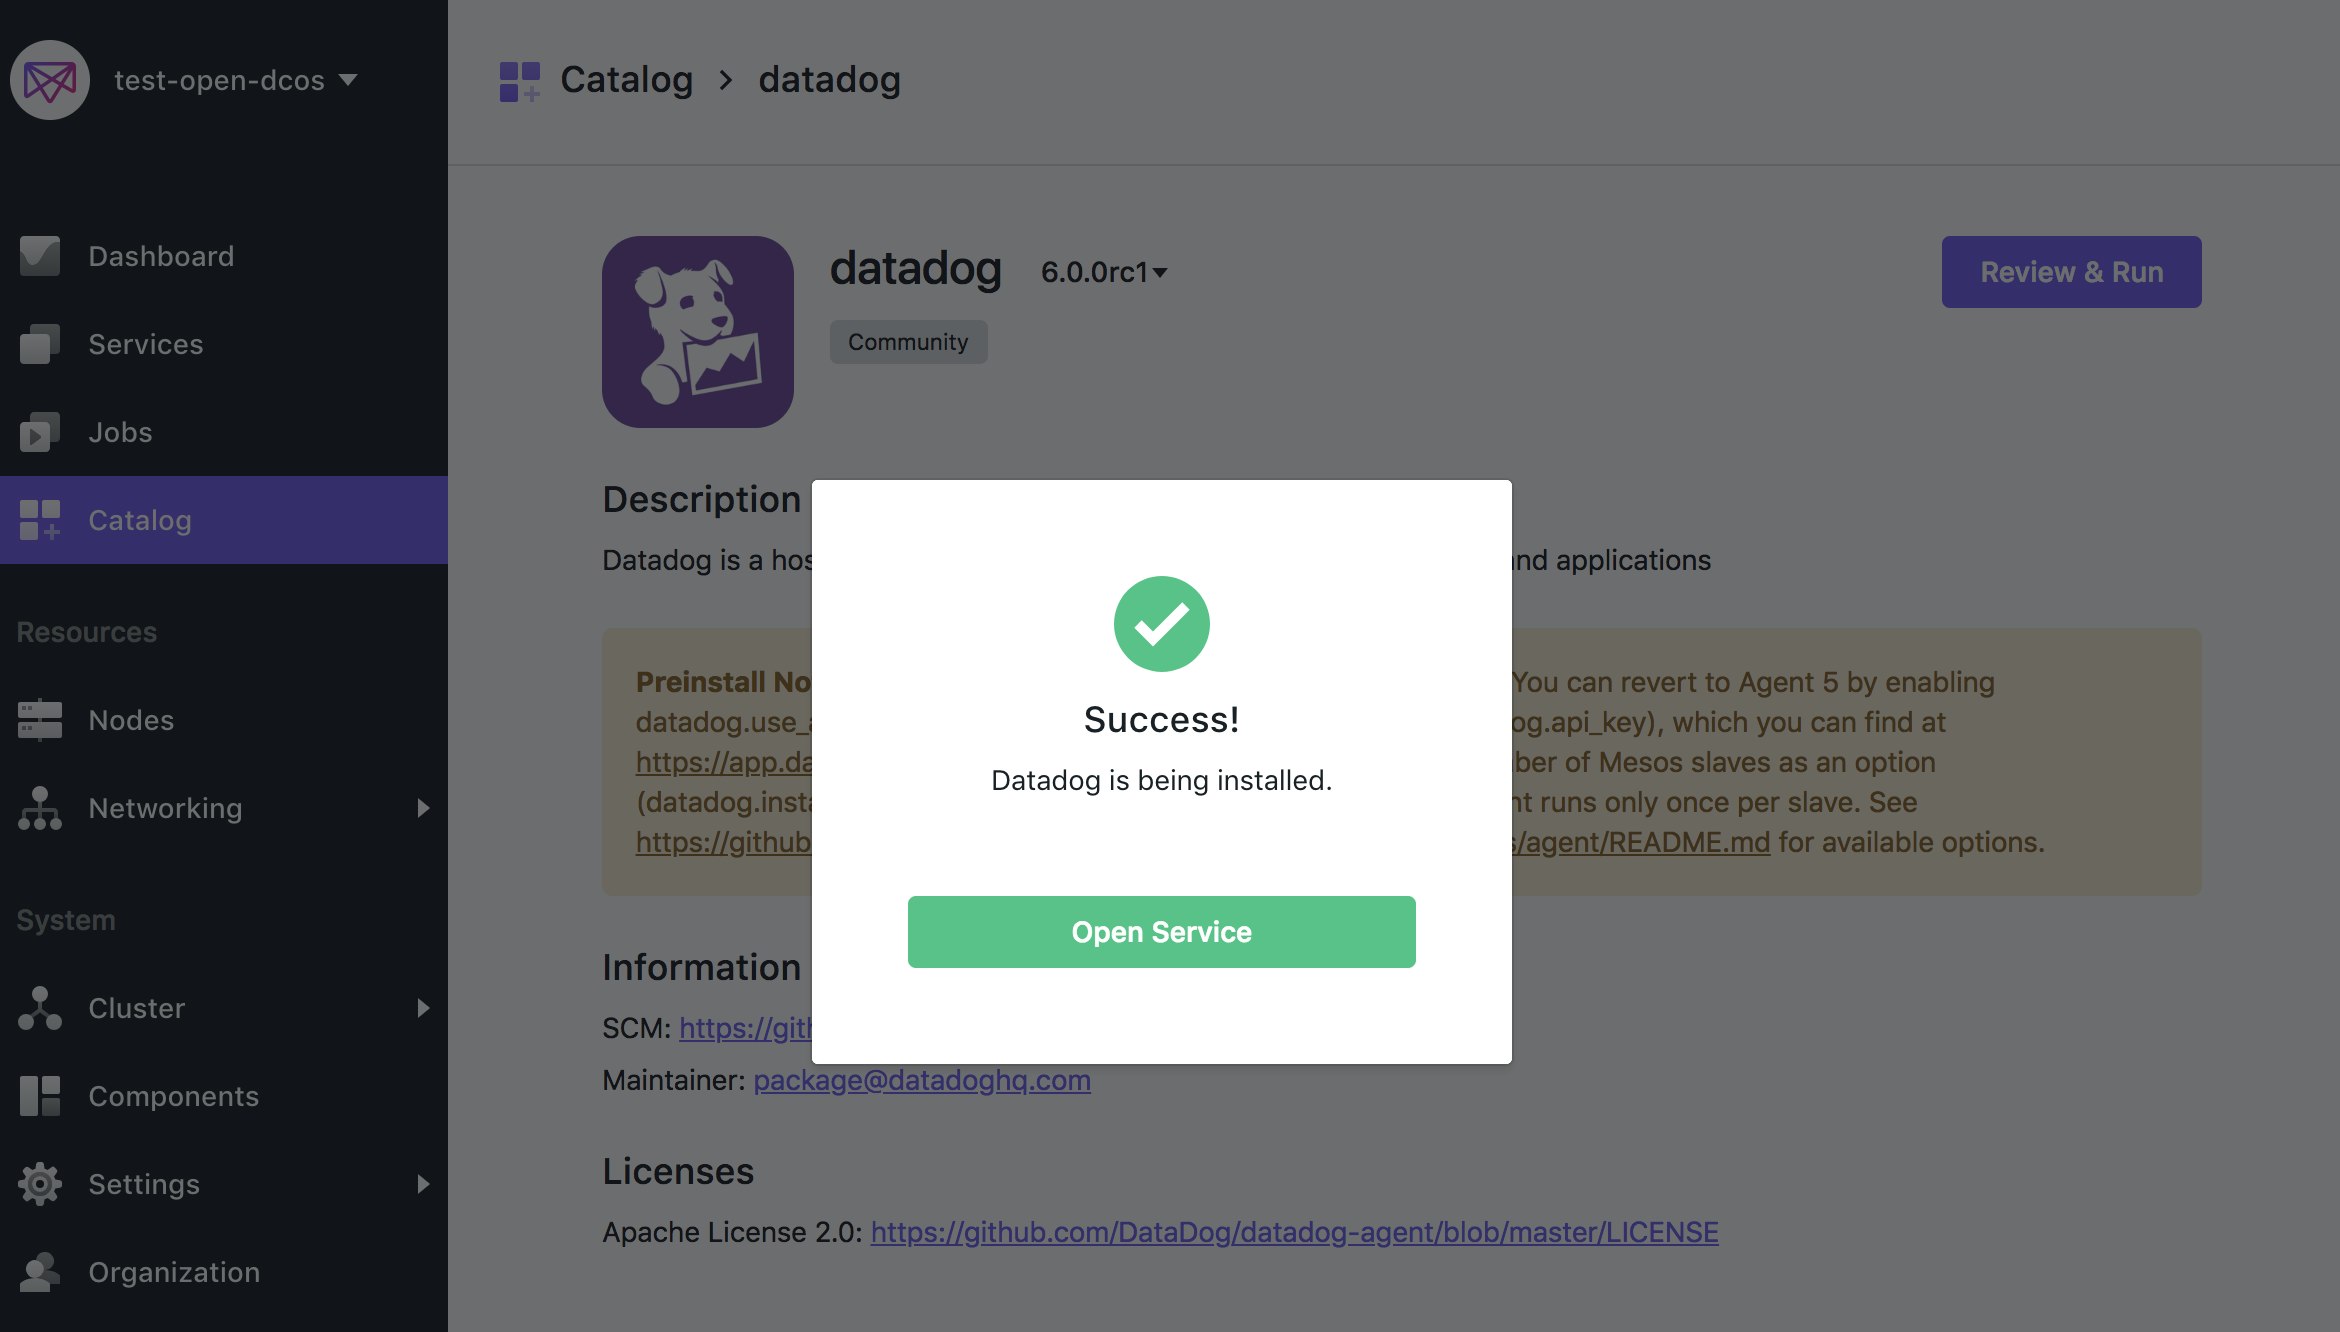
Finally, review the information and click the Run Service button in the upper right. The UI will show you a dialog indicating the service was successfully installed.
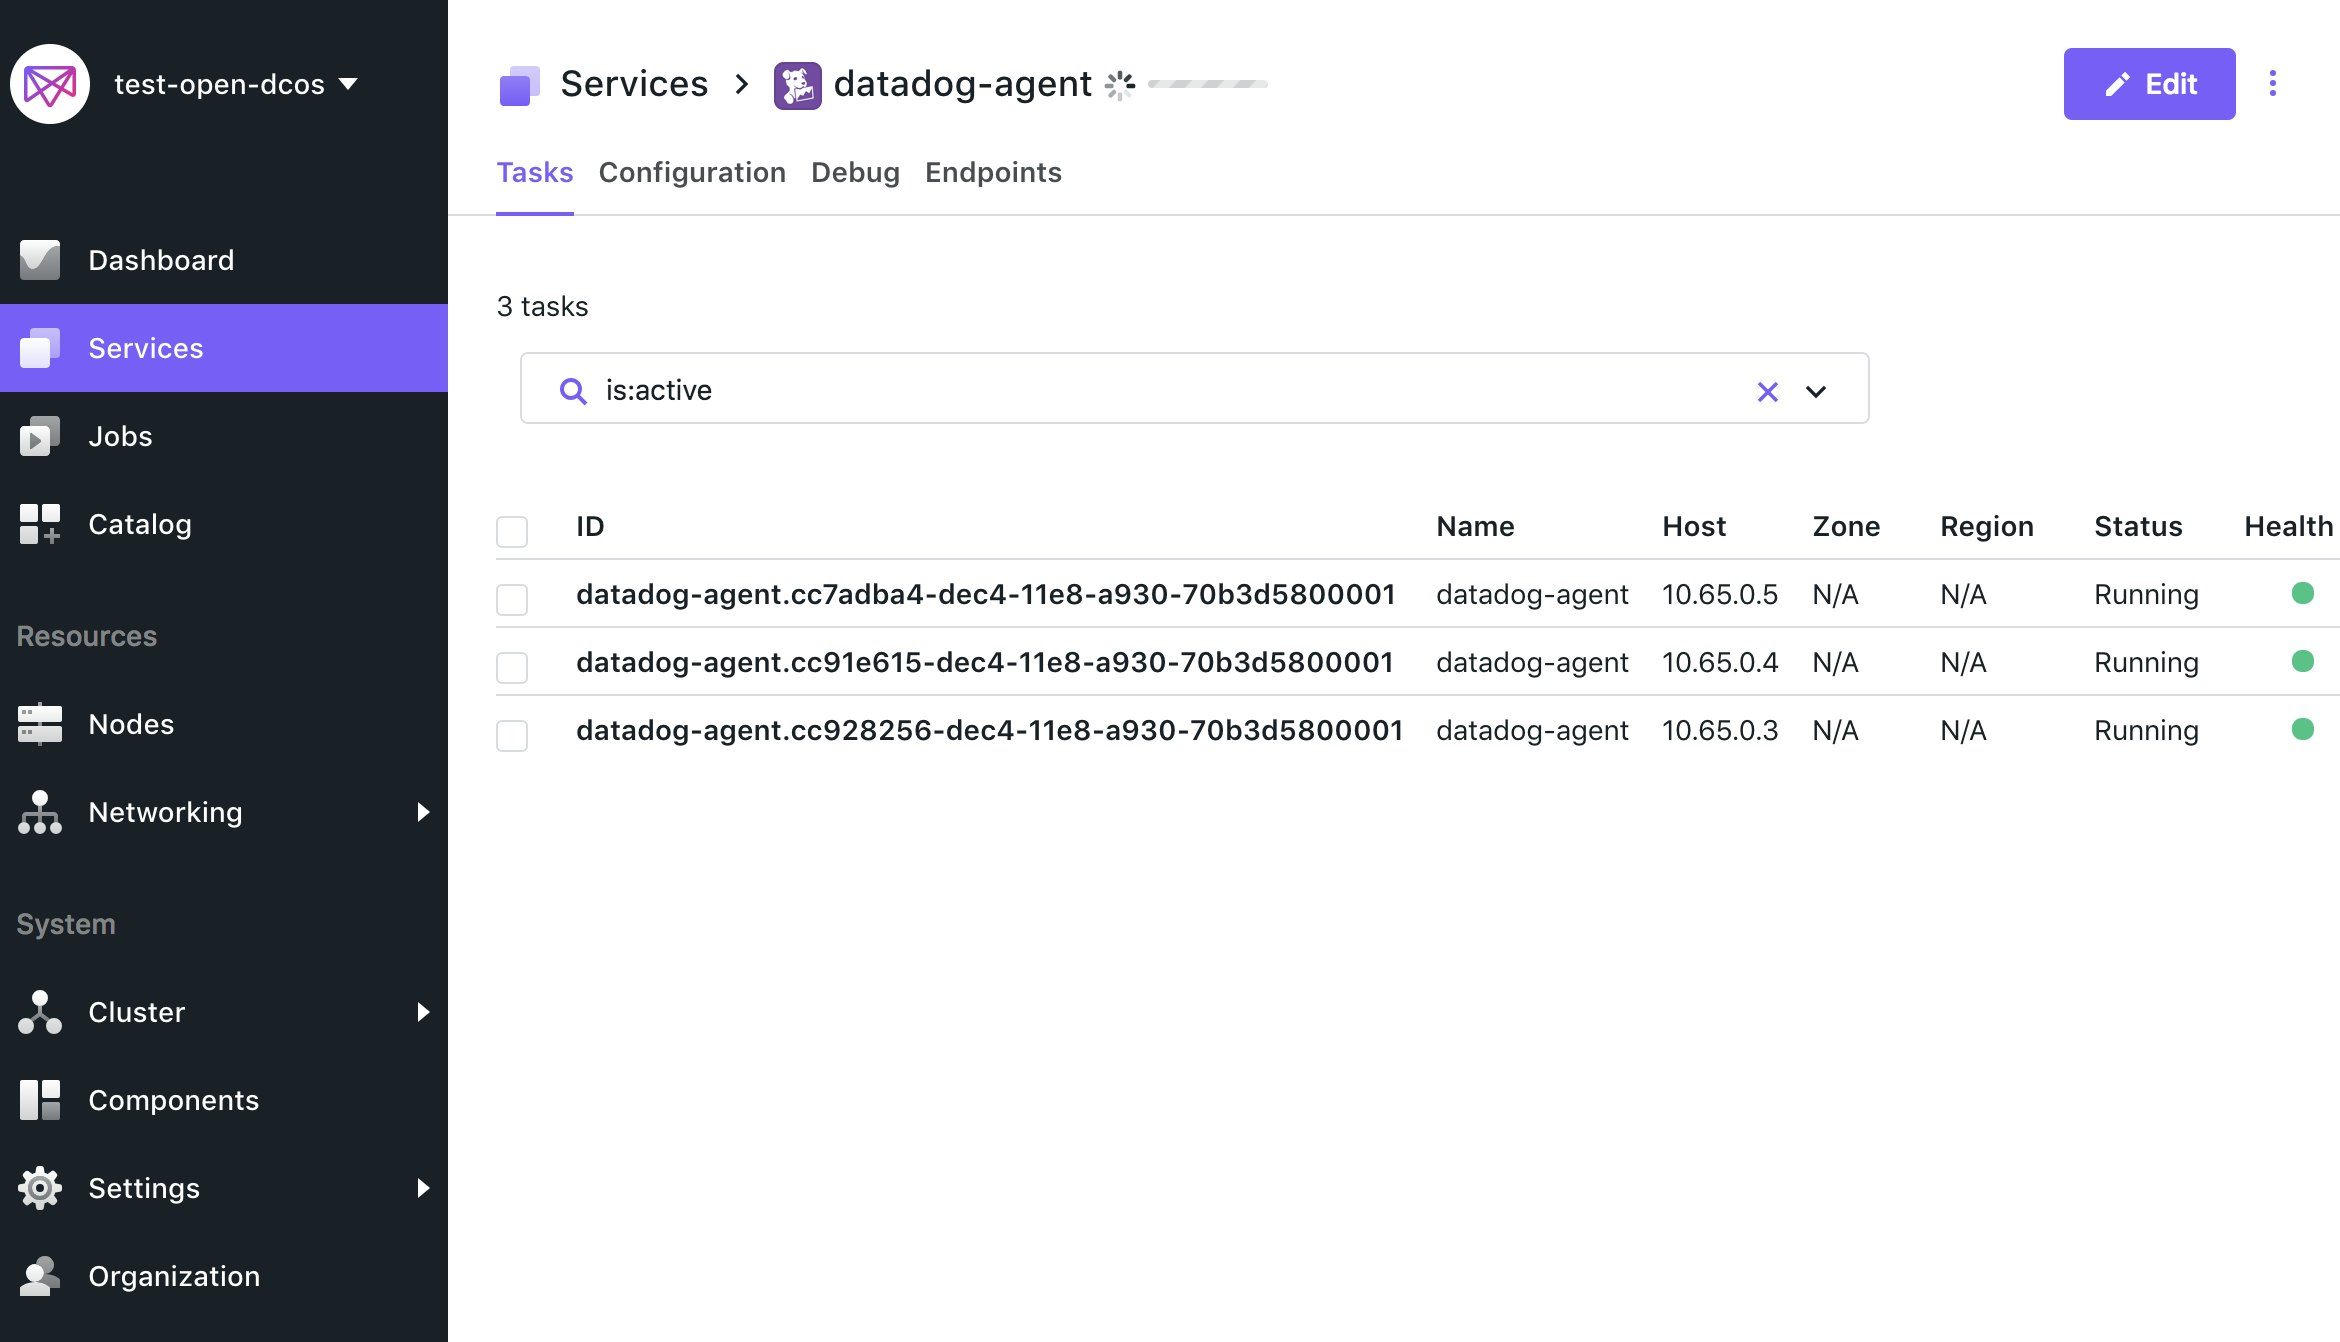
Click the Open Service button to inspect the DC/OS service view and confirm that Datadog is running across all agent nodes.
You're now collecting metrics from both Mesos and Docker, which we'll explore in a moment. But first, let's expand our monitoring coverage by installing the Datadog Agent on our leader nodes as well.
Now for the leader nodes
The Datadog package in the DC/OS catalog installs the Datadog Agent within a standard Mesos framework. In the Mesos scheme, only agent nodes may execute frameworks (see here for more detail). Therefore, to monitor the cluster’s leader nodes, you’ll need to install Datadog as a standalone Docker container on each.
To do so, run the following command, which takes care of both installation and initialization:
docker run -d --name datadog-agent \ -v /var/run/docker.sock:/var/run/docker.sock:ro \ -v /proc/:/host/proc/:ro \ -v /sys/fs/cgroup/:/host/sys/fs/cgroup:ro \ -e DD_API_KEY=<YOUR_DATADOG_API_KEY> \ -e MESOS_MASTER=true \ -e MARATHON_URL=http://leader.mesos:8080 \ datadog/agent:latestThat’s it. If the command returns no error, Datadog is now running on that leader node. You can confirm this by running the command below to ensure that the Datadog Agent is running in a Docker container:
docker ps -a | grep datadog-agentNote that we’ve passed three extra parameters in the example above: a Datadog API key, a flag indicating that the node is a leader, and the URL to the Marathon leader (which is usually the same as shown above). The MESOS_MASTER=true option tells Datadog to look for metrics from the specialized set of services that run on a leader node: Mesos and Docker (same as on agent nodes), plus Marathon and ZooKeeper. Marathon is the Mesos framework responsible for launching long-running processes across agent nodes; ZooKeeper is a distributed coordination service that handles leader elections on your DC/OS cluster.
With the Datadog Agent now installed on all Mesos nodes, you can start monitoring all your cluster metrics.
Bring up your template dashboards
In your list of available dashboards, you’ll see an out-of-the-box dashboard built specifically for monitoring Mesos clusters (if you don’t, just click the Install Integration button in the Mesos integration tile). You'll also see resource metrics from your containers populating the pre-built Docker dashboard, and metrics from your Mesos leaders flowing into the ZooKeeper dashboard. Once you enable additional integrations (such as NGINX, Apache, or MySQL), you will have access to dashboards specific to those technologies as well.
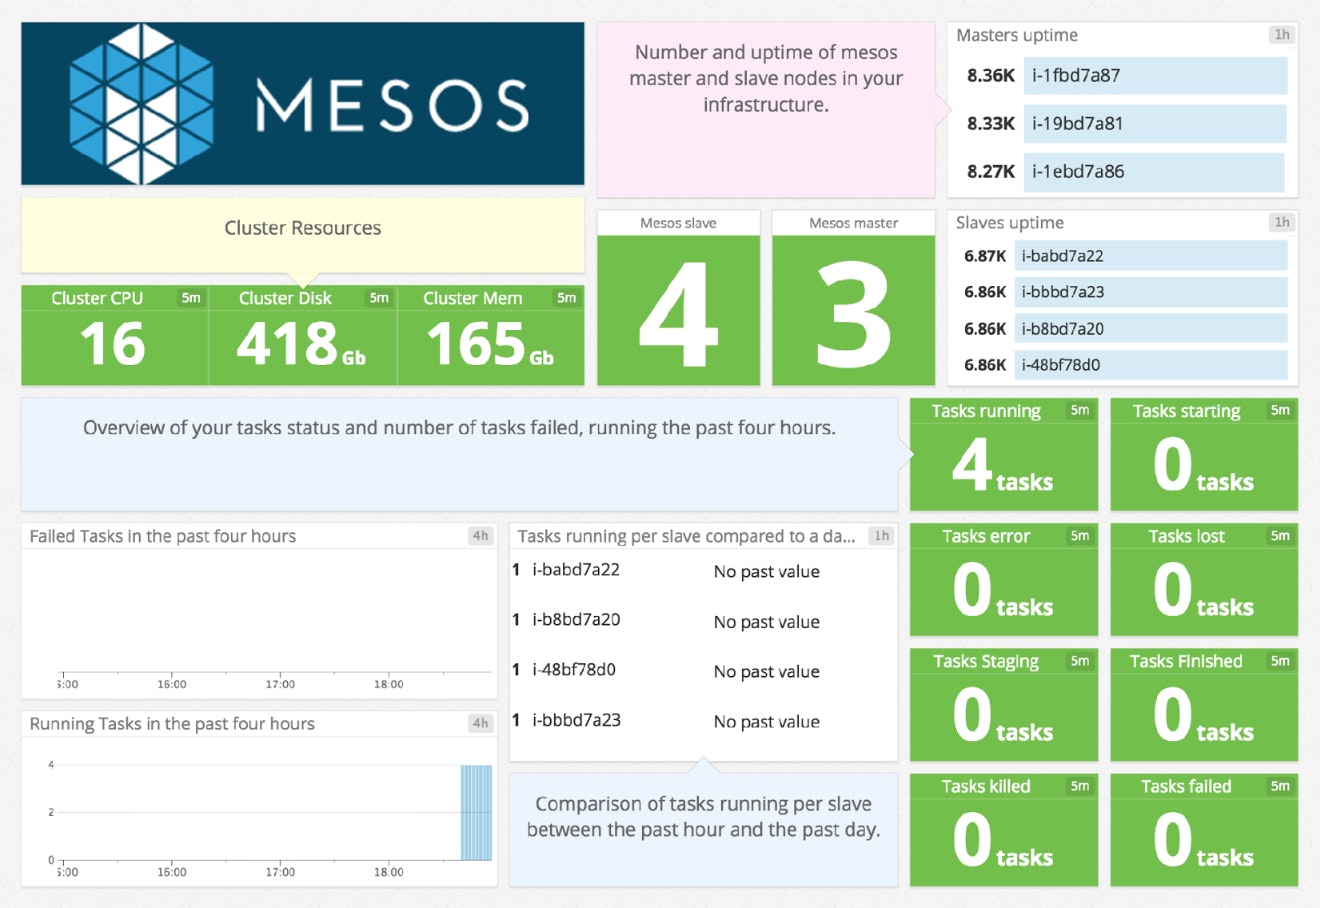
The Mesos dashboard, as shown below, gives you a handy, high-level view of all that data center abstraction we mentioned above. You can see at a glance, for example, that our cluster has three leader nodes and four agent nodes, and what the aggregate totals are for CPU, disk usage, RAM, etc.
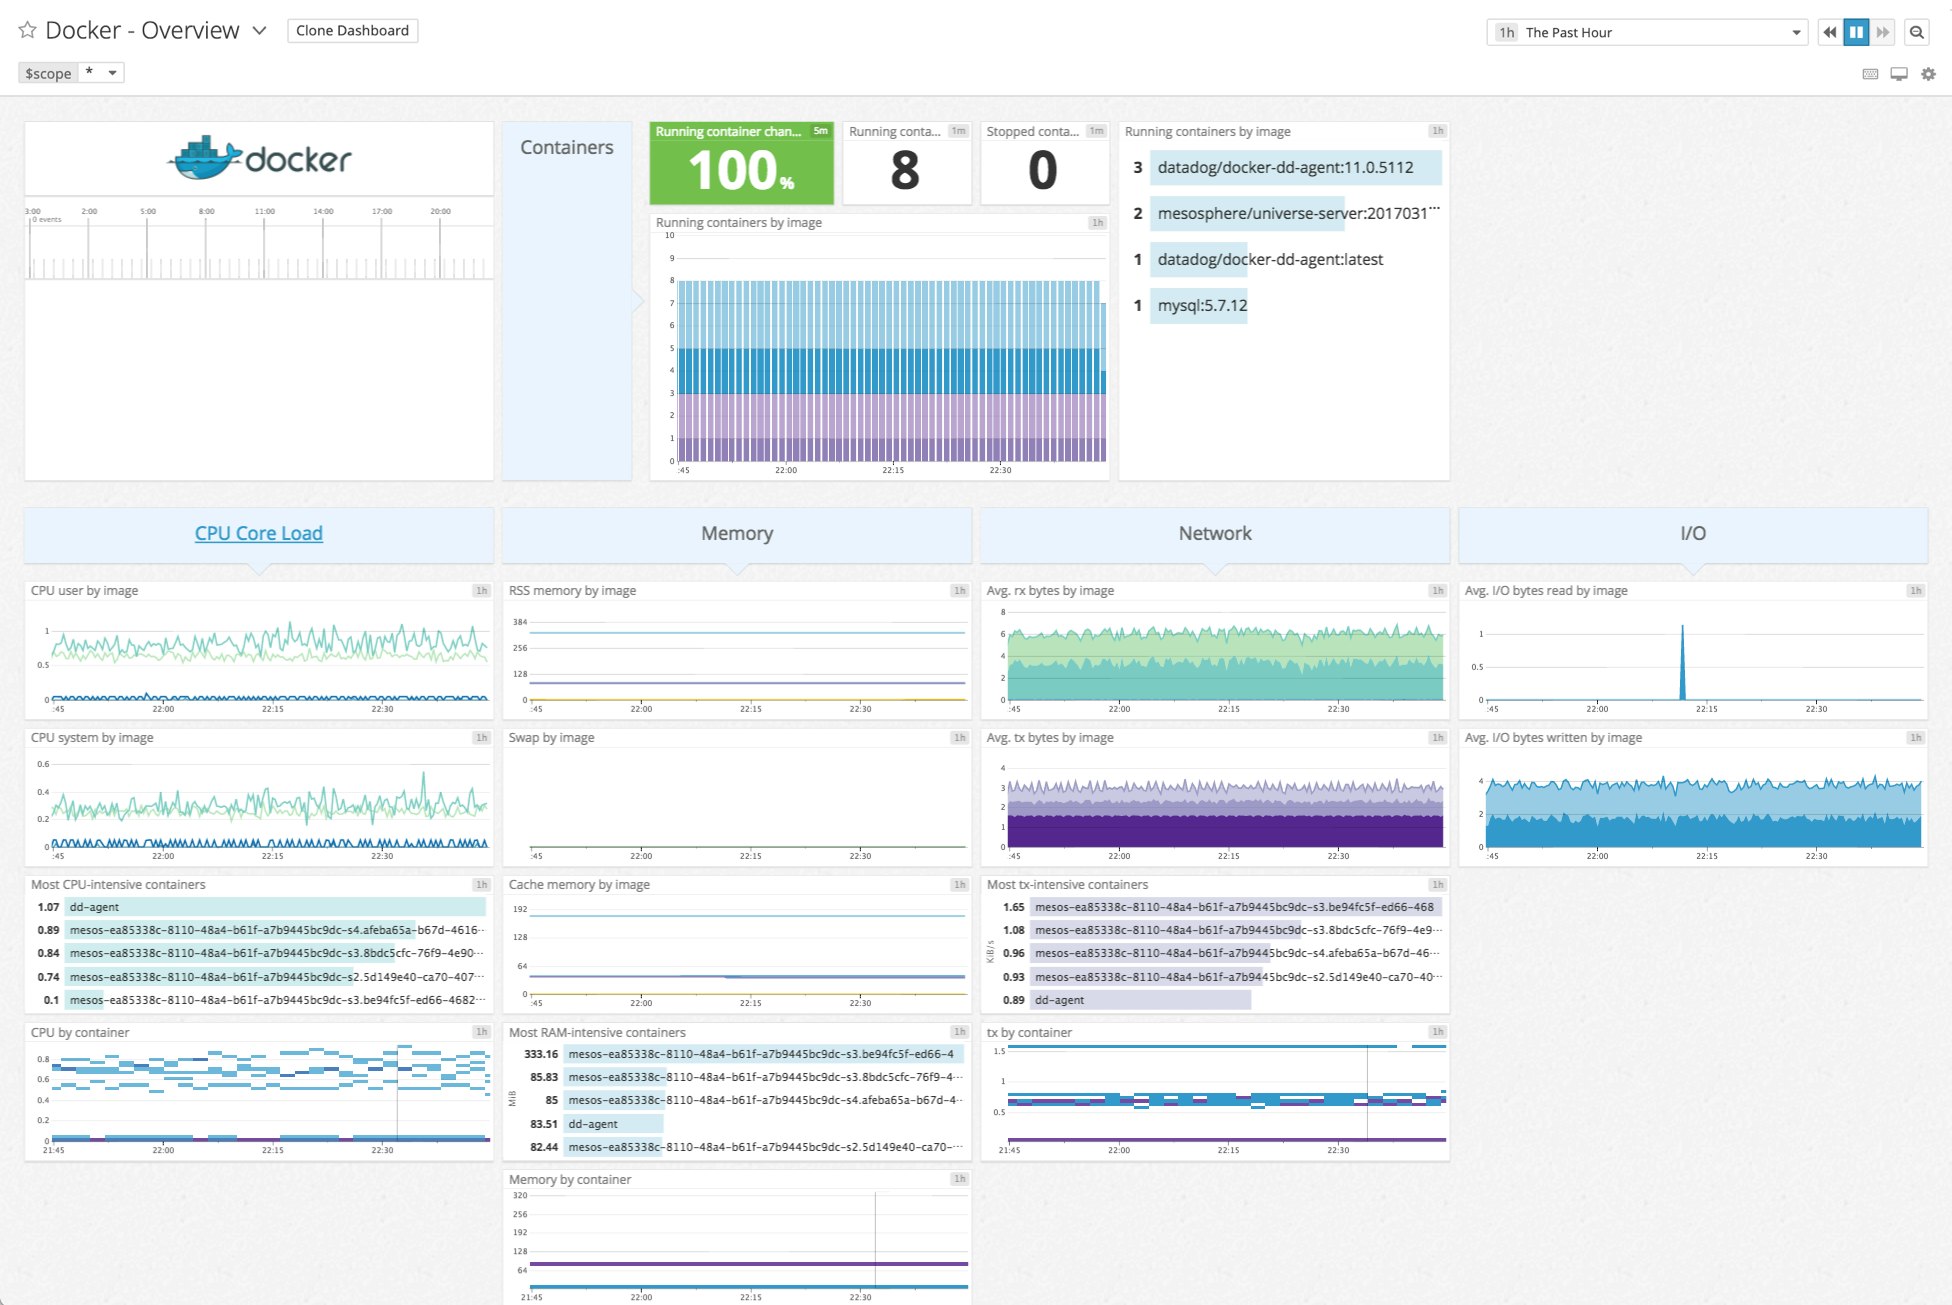
The Docker dashboard provides a slightly more granular view, breaking down resource consumption by Docker images and containers.
Enable additional integrations
Once you've set up Datadog on your cluster, you'll want to start collecting insights from the services and applications running there. Datadog has built-in integrations with more than 850 technologies, so you can start monitoring your entire stack quickly.
Automated monitoring with Autodiscovery
When you install the Datadog package on DC/OS, or use the instructions above for your leader nodes, Autodiscovery is enabled by default. This feature automatically detects which containerized services are running on which nodes, and configures the Datadog Agent on each node to collect metrics from those services.
For certain services, such as Redis, Elasticsearch, and Apache server (httpd), the Datadog Agent comes with auto-configuration templates that will work in most cases. (See the Autodiscovery docs for the full list.) If you're running one of those services, you should start seeing metrics in Datadog within minutes.
You can verify that the configuration is correct by running the Datadog status command on your agent node. If you're running Redis, for example, the status output should look something like the snippet below, indicating that the Datadog Agent has automatically started collecting metrics from Redis:
[agent-01]$ sudo docker psCONTAINER ID IMAGE COMMAND CREATED STATUS PORTS NAMES1c2b0457e6df datadog/agent:latest "/init" About an hour ago Up About an hour (healthy) 8125/udp, 8126/tcp mesos-73b54c7c-08d2-400b-aca6-bd27631be988af7d58faa91a redis:4.0 "docker-entrypoint..." About an hour ago Up About an hour 0.0.0.0:25863->6379/tcp mesos-01fadb05-cdd8-43ab-80a2-64a248a2ff74
[agent-01]$ sudo docker exec -it 1c2b0457e6df agent statusGetting the status from the agent.
==============Agent (v6.6.0)==============[...]
docker ------ Instance ID: docker [OK] Total Runs: 454 Metric Samples: 38, Total: 17,252 Events: 0, Total: 4 Service Checks: 1, Total: 454 Average Execution Time : 9ms
[...]
mesos_slave (1.2.1) ------------------- Instance ID: mesos_slave:fb1247cad33d1798 [OK] Total Runs: 454 Metric Samples: 37, Total: 16,798 Events: 0, Total: 0 Service Checks: 1, Total: 454 Average Execution Time : 112ms
[...]
redisdb (1.7.1) --------------- Instance ID: redisdb:d9be5f40fb6d98bb [OK] Total Runs: 454 Metric Samples: 33, Total: 14,982 Events: 0, Total: 0 Service Checks: 1, Total: 454 Average Execution Time : 2msMonitoring additional services with custom configs
For services that demand a bit more specificity in their configuration (for instance, a database that requires a password to access metrics), you can create monitoring configuration templates that Datadog will apply whenever it detects the service running on a node in your cluster. For information about creating custom configuration templates, including guidance on using a key-value store to securely manage them, see our Autodiscovery documentation.
Now that you're collecting metrics from your containerized services along with the underlying infrastructure, you can set sophisticated alerts, correlate metrics between systems, and build comprehensive dashboards that bring together data from all your core systems. You can also conduct open-ended exploration of your metrics and infrastructure to surface new insights.
Survey your infrastructure
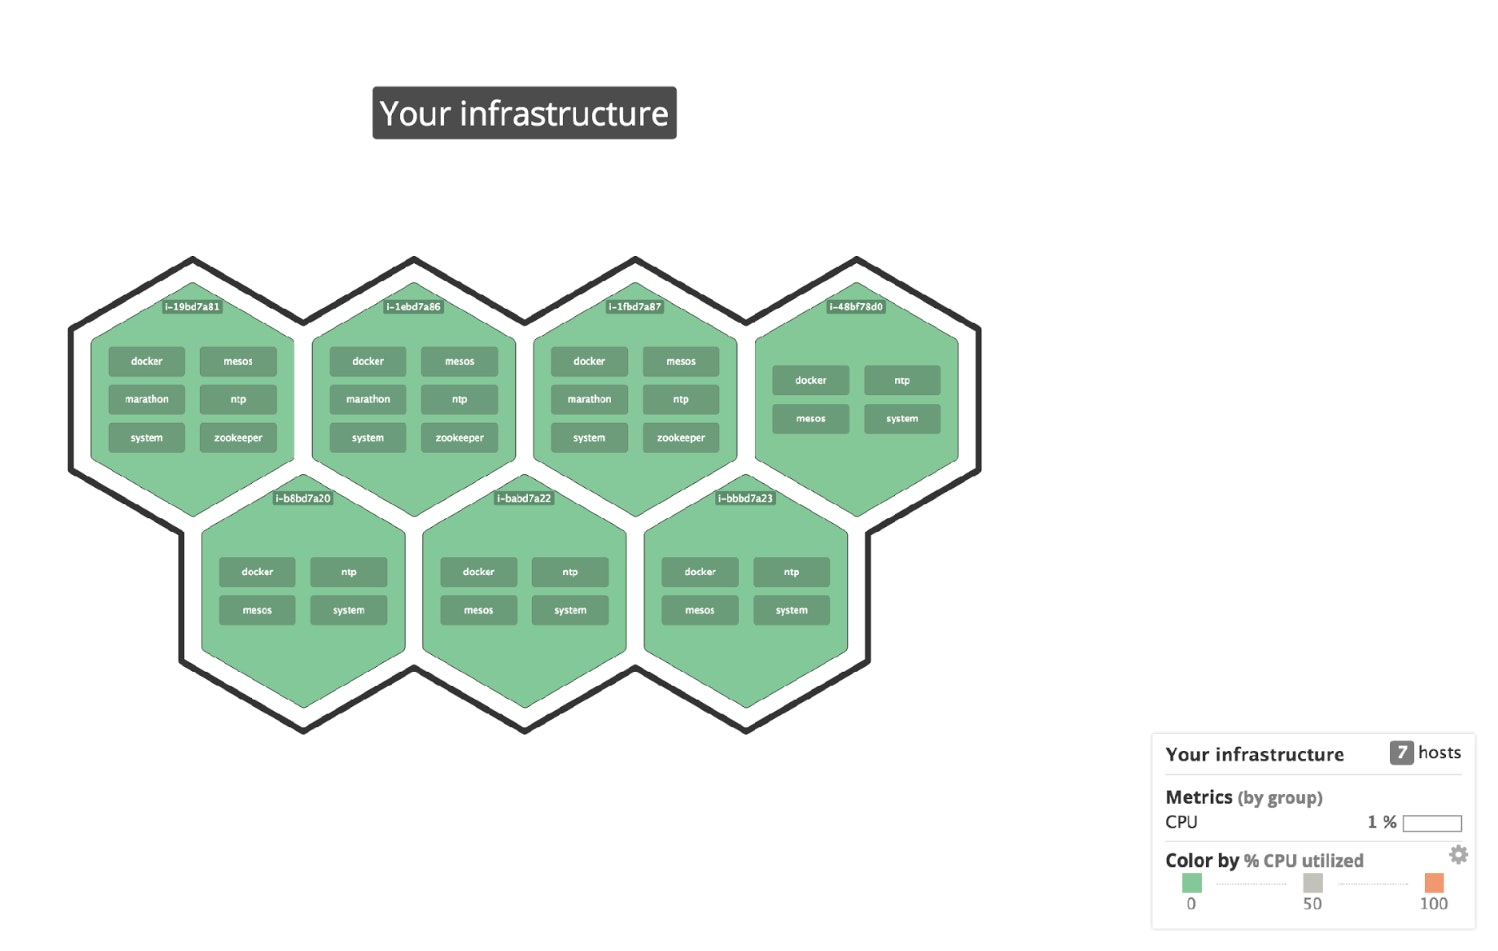
Host maps in Datadog let you explore your cluster from both high and low altitudes, and quickly determine which services are running, if resource consumption is within expected limits, or if any segment of your infrastructure is overloaded.
For example, you can view all the nodes in the cluster, both agents and leaders. (The latter group, as you can see in the screenshot, are running the extra, leading services: Marathon and ZooKeeper.)
If you want to focus on only the leader nodes, you can take advantage of Datadog’s extensive tagging support and filter only for role:mesos-master.
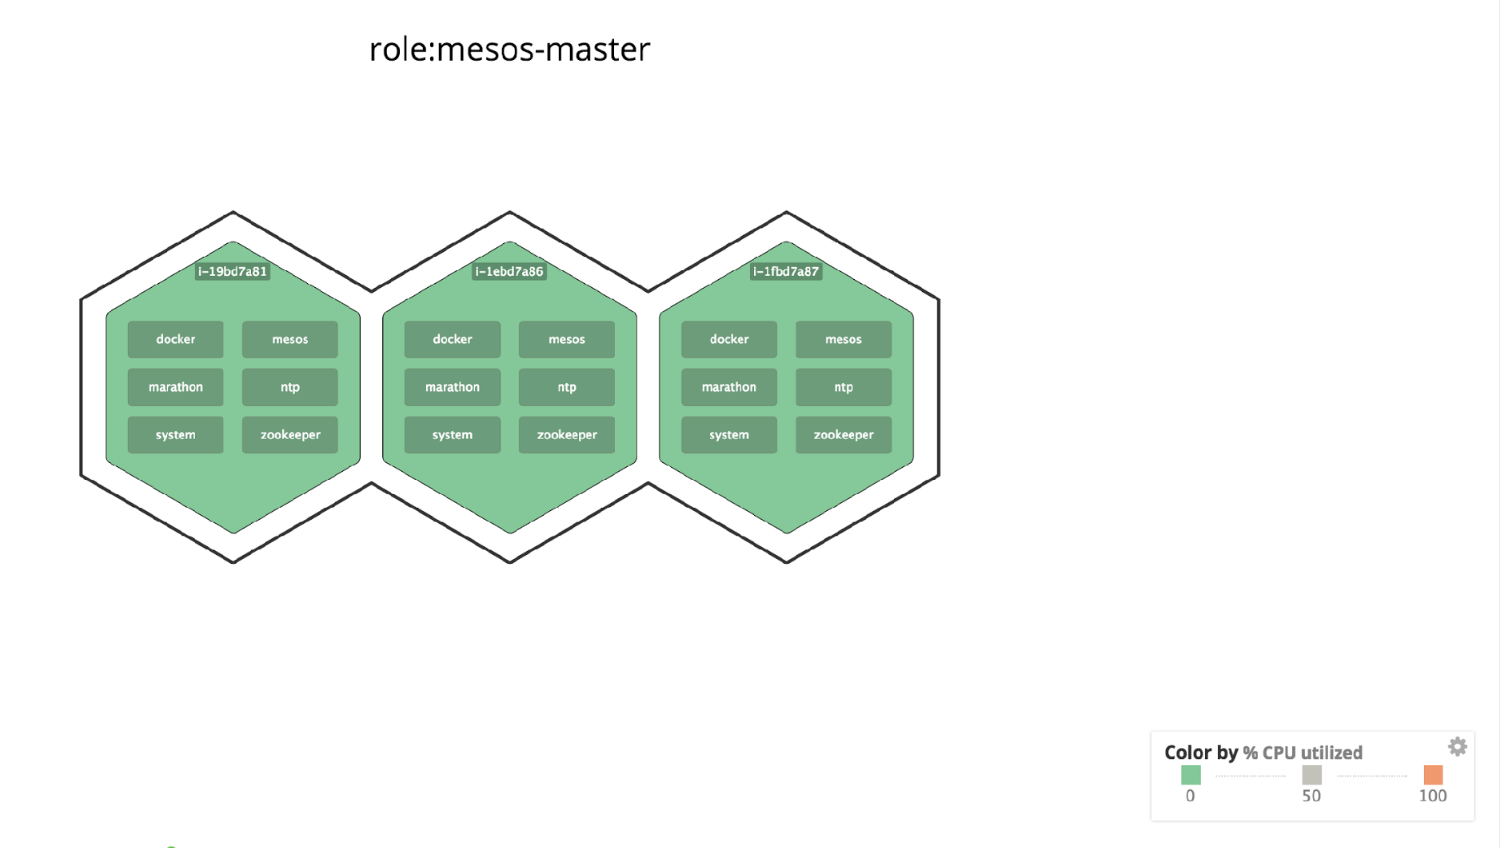
By default, host map node color is coded to CPU usage. So if a single leader node in your cluster began to consume excessive CPU cycles, you would see it painted as a red node, and you might then look for a hardware failure or rogue process on that node. (And if many leader nodes crept into the red, you might suspect that the cluster is under-provisioned and consider deploying more nodes.)
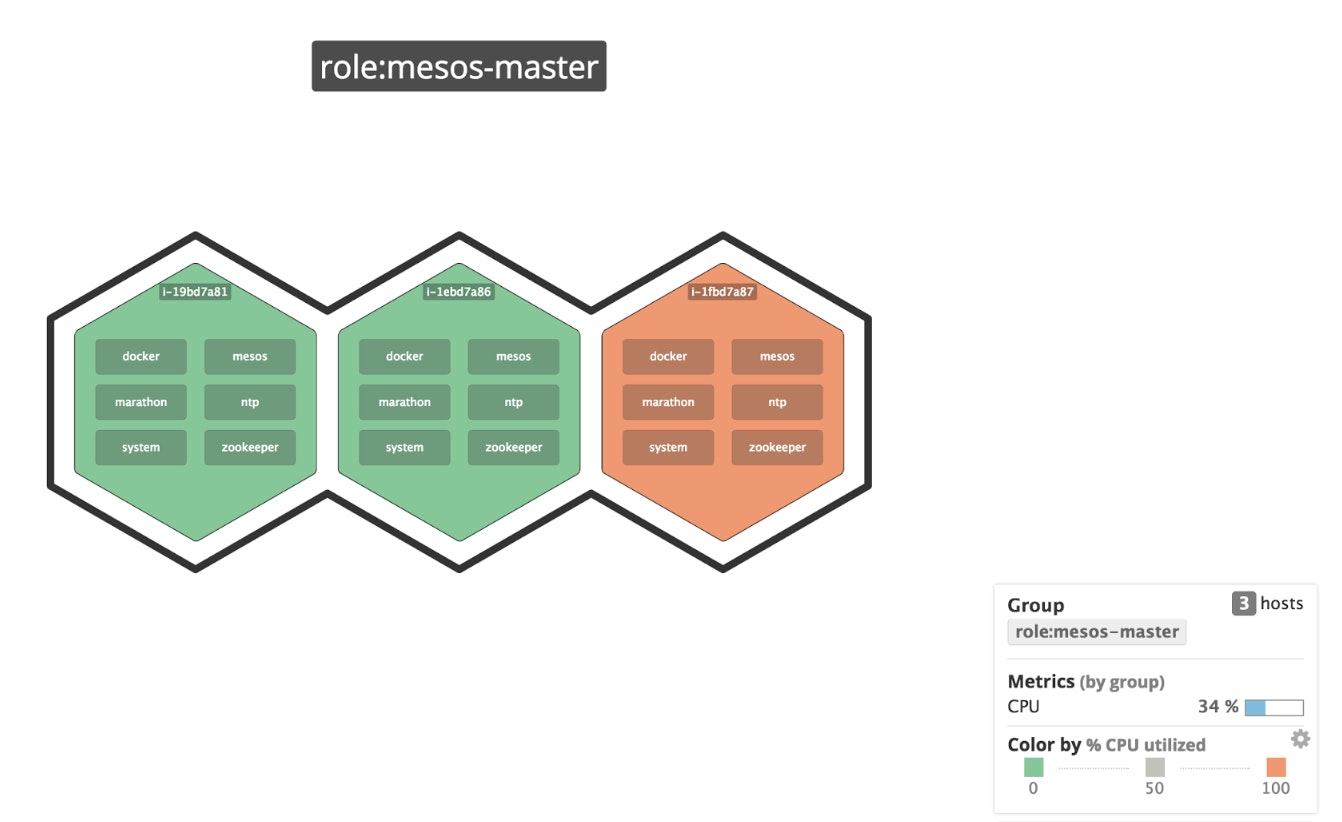
You can also color (or even size) the nodes by any available metric, whether from Mesos or from a Mesos-related component like Marathon or ZooKeeper.
Get some fresh air
Datadog alerts can also watch your cluster for you while you do things other than squint into bright screens. You can set a trigger on any metric, using fixed or dynamic thresholds, and receive instant notification via email or through third-party services like PagerDuty and Slack.
Time to get your hands dirty
We’ve only just touched on the many capabilities of Datadog for DC/OS cluster monitoring, but it’s more fun anyway to try them out for yourself.
As a first step, sign up here for a free 14-day Datadog trial.
Then, if you’re not using DC/OS yet, the getting started guide here explains how to spin up a simple test cluster in just 30 minutes or so on AWS. If you want to get started even faster, head here to try spinning up a pre-configured cluster from an AWS CloudFormation template.
Once your cluster is up, pop Datadog on your leader and agent nodes and start exploring the rich stream of cluster metrics now flowing into your Datadog account.


