Mallory Mooney
Technical issues, such as fatal crashes, are one of the biggest reasons why users uninstall mobile applications, so quickly identifying and resolving issues is vital for user retention. This can be challenging, particularly in the Android market, which has a wide variety of mobile devices and versions of the Android operating system. You need visibility into every issue so you can determine which crashes impact your application the most and efficiently resolve them.
In this post, we’ll look at how Datadog helps you:
- collect crash data from Android devices
- transform crash data for analysis
- surface and prioritize the most critical and widespread issues
- create intelligent alerts to instantly notify you of a crash
Collect crash data from your users’ Android devices
Understanding how users interact with your application can help you troubleshoot issues more effectively, so collecting application usage data like errors and user actions is a crucial first step. Datadog’s Real User Monitoring (RUM) Android SDK lets you collect RUM data from your application, giving you real-time insights into all user activity. This data includes:
- user sessions, which contain metadata such as each user’s device and geolocation
- view events, generated each time a user navigates to a different part of your application’s UI
- action events, which are any user interactions within your application (e.g., taps, scrolls)
- any errors triggered during a user’s interaction with your application
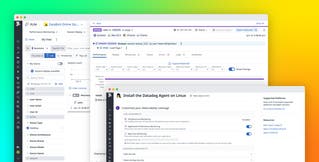
To start using Datadog’s RUM SDK, follow the in-app instructions to generate an application ID and a client token for a new application.
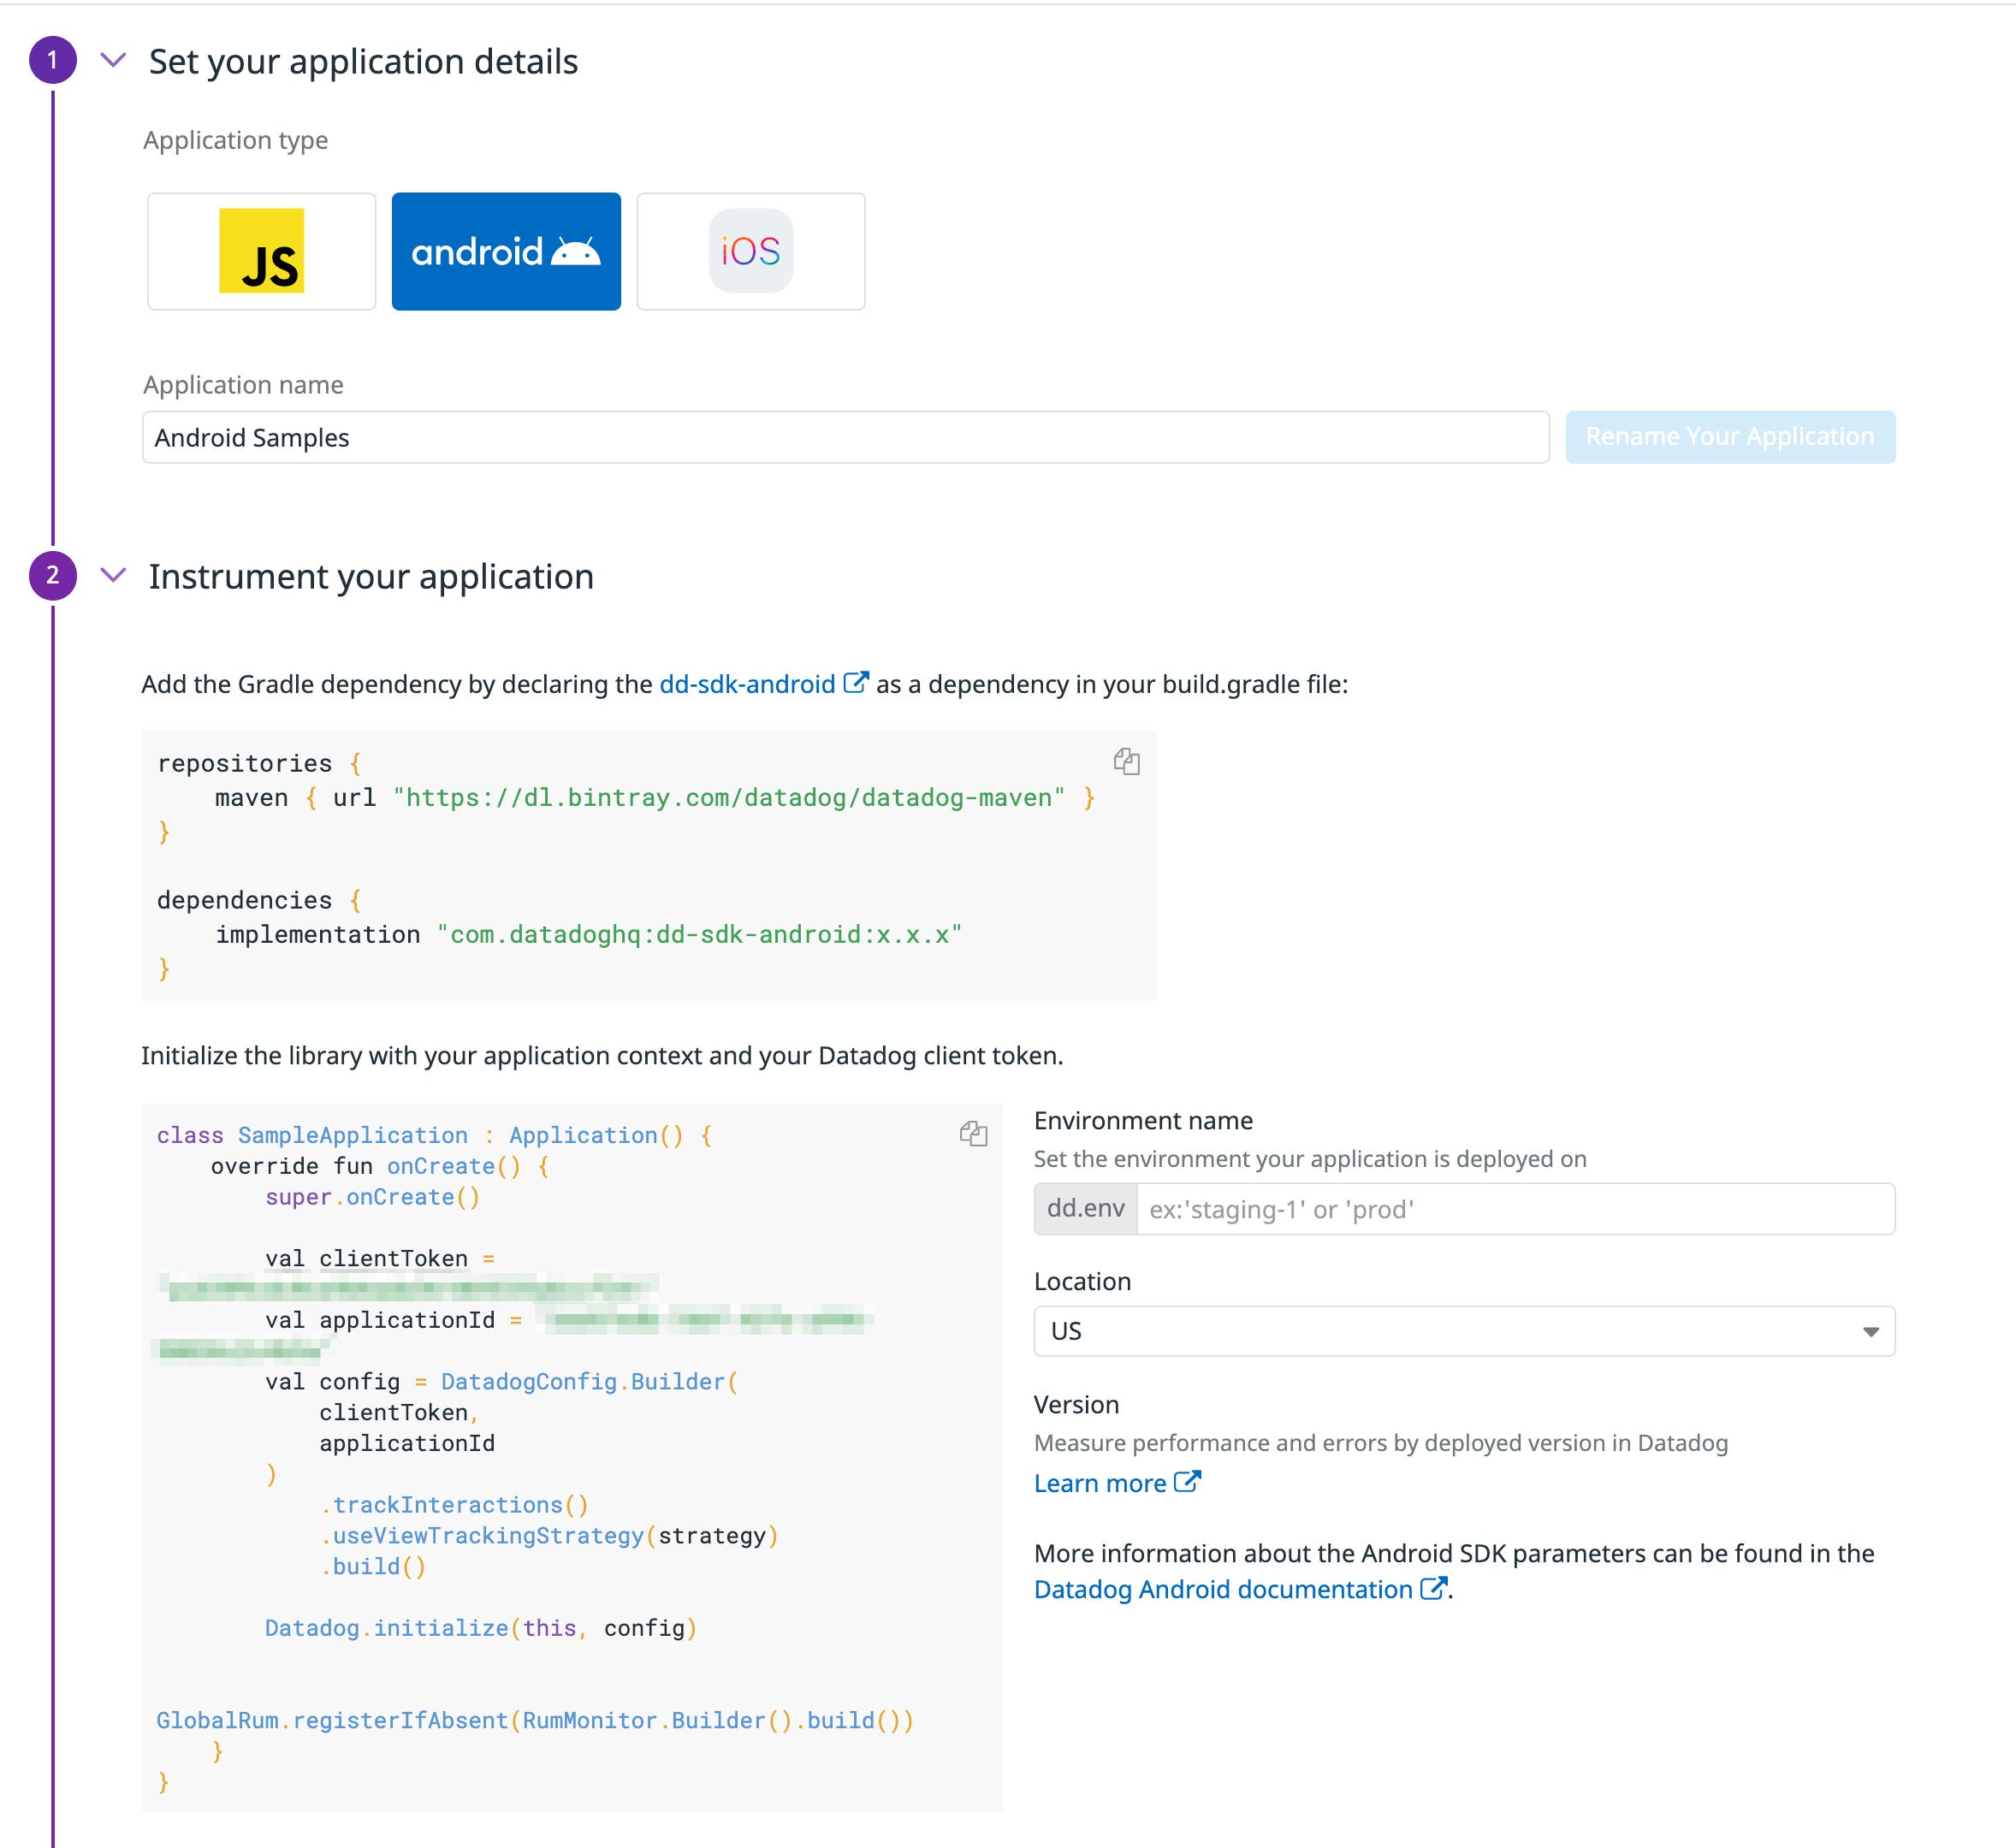
Then you can initialize your configuration to start reporting crashes by setting crashReportsEnabled to true in your Configuration.Builder class.
val config = Configuration.Builder( crashReportsEnabled = true, rumEnabled = true )Once you’ve registered your application in Datadog, see our documentation for more information about completing the setup process.
Whenever a crash occurs, the Android SDK captures it, and sends the data to Datadog. And, in cases where the user’s device is offline or inaccessible due to low battery or network issues, the SDK buffers and locally stores the crash data and then sends it to Datadog the next time the application is used.
Now that you’re collecting crash data, you need to ensure that it is in a human-readable format before you can view and analyze it in the Datadog UI, which we’ll look at in more detail next.
Decode your Android applications
Most Android applications are obfuscated when they are published in order to reduce their size for faster downloads and prevent other users from repurposing their source code. This means that any data collected from an application will also be obfuscated and unusable in that state. In order to use your application’s data, you will need to deobfuscate it, a process that restores an application’s source code to a more understandable form—similar to reversing the minification process for JavaScript in web applications.
When your compiler runs, tools such as ProGuard and R8 create a mapping file that maps line numbers from obfuscated code back to line numbers from the original source file. This mapping file is necessary for deobfuscation, which Datadog’s Gradle plugin simplifies by automatically retrieving the mapping file and uploading it to Datadog.
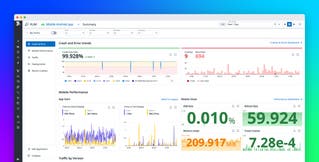
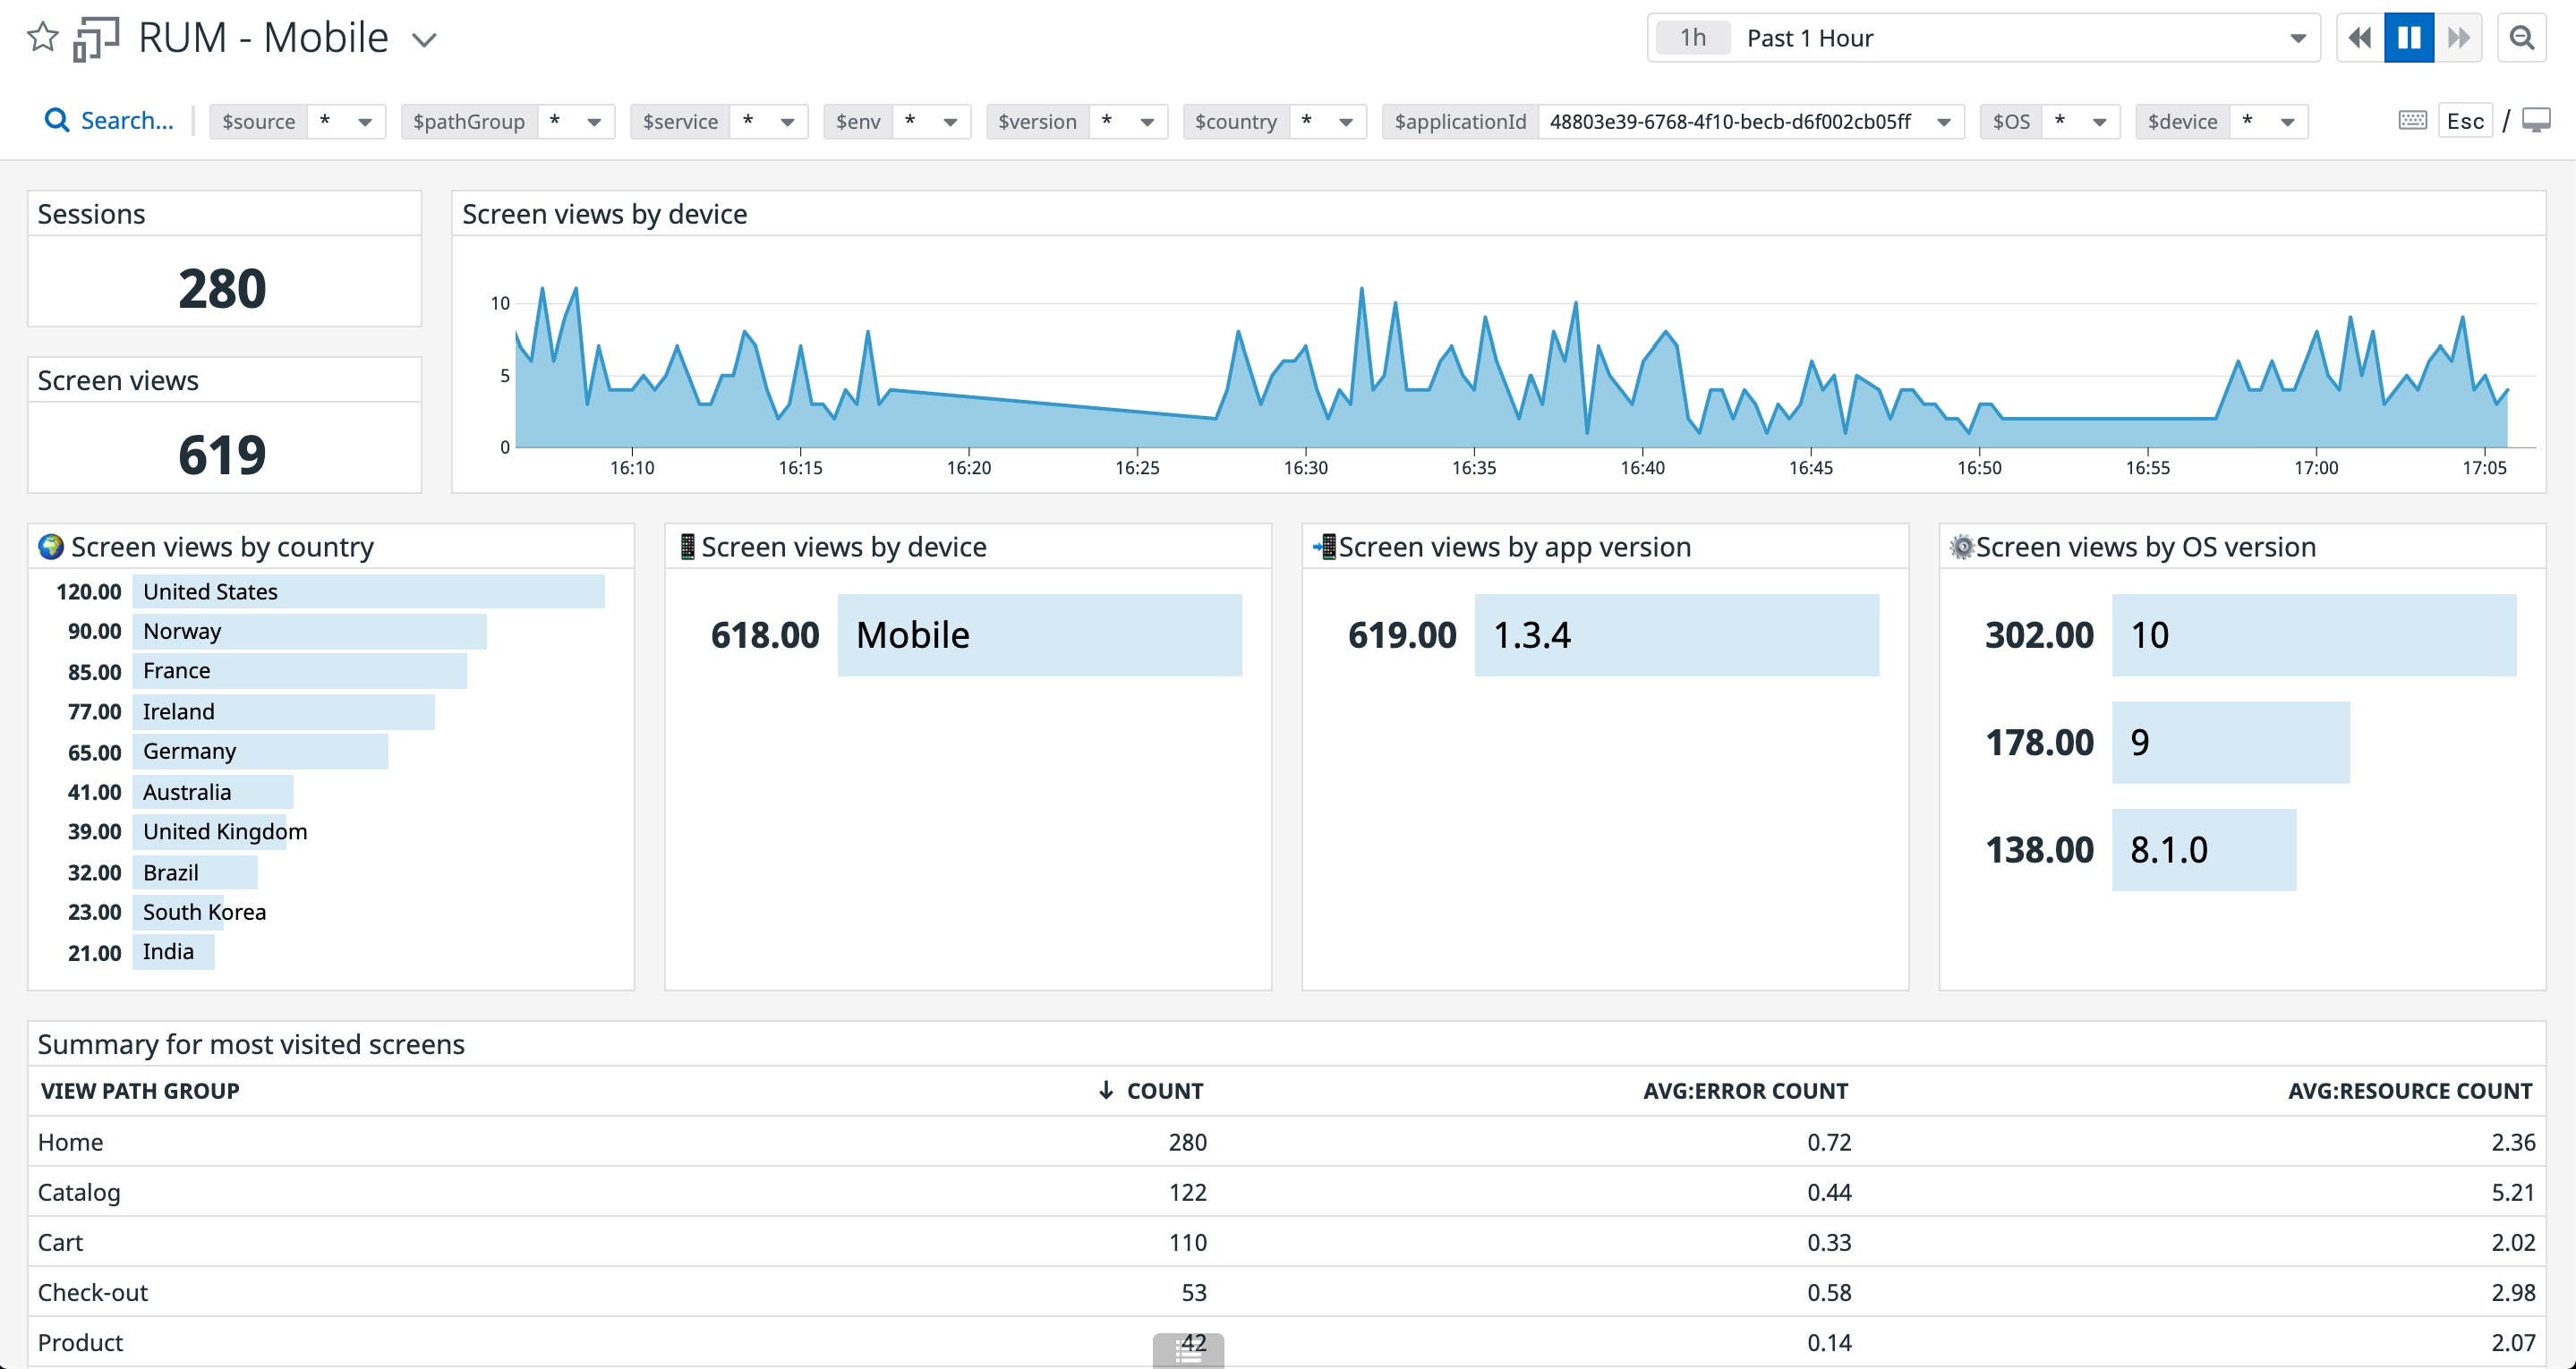
As with other types of RUM data, Datadog enriches crash data with meaningful metadata you can use to identify its root cause, such as information about the device and operating system, network availability, user actions, and the user flow that led to the crash. Datadog provides built-in RUM dashboards that you can use to visualize all of this data, giving you more context for troubleshooting problems with your application.
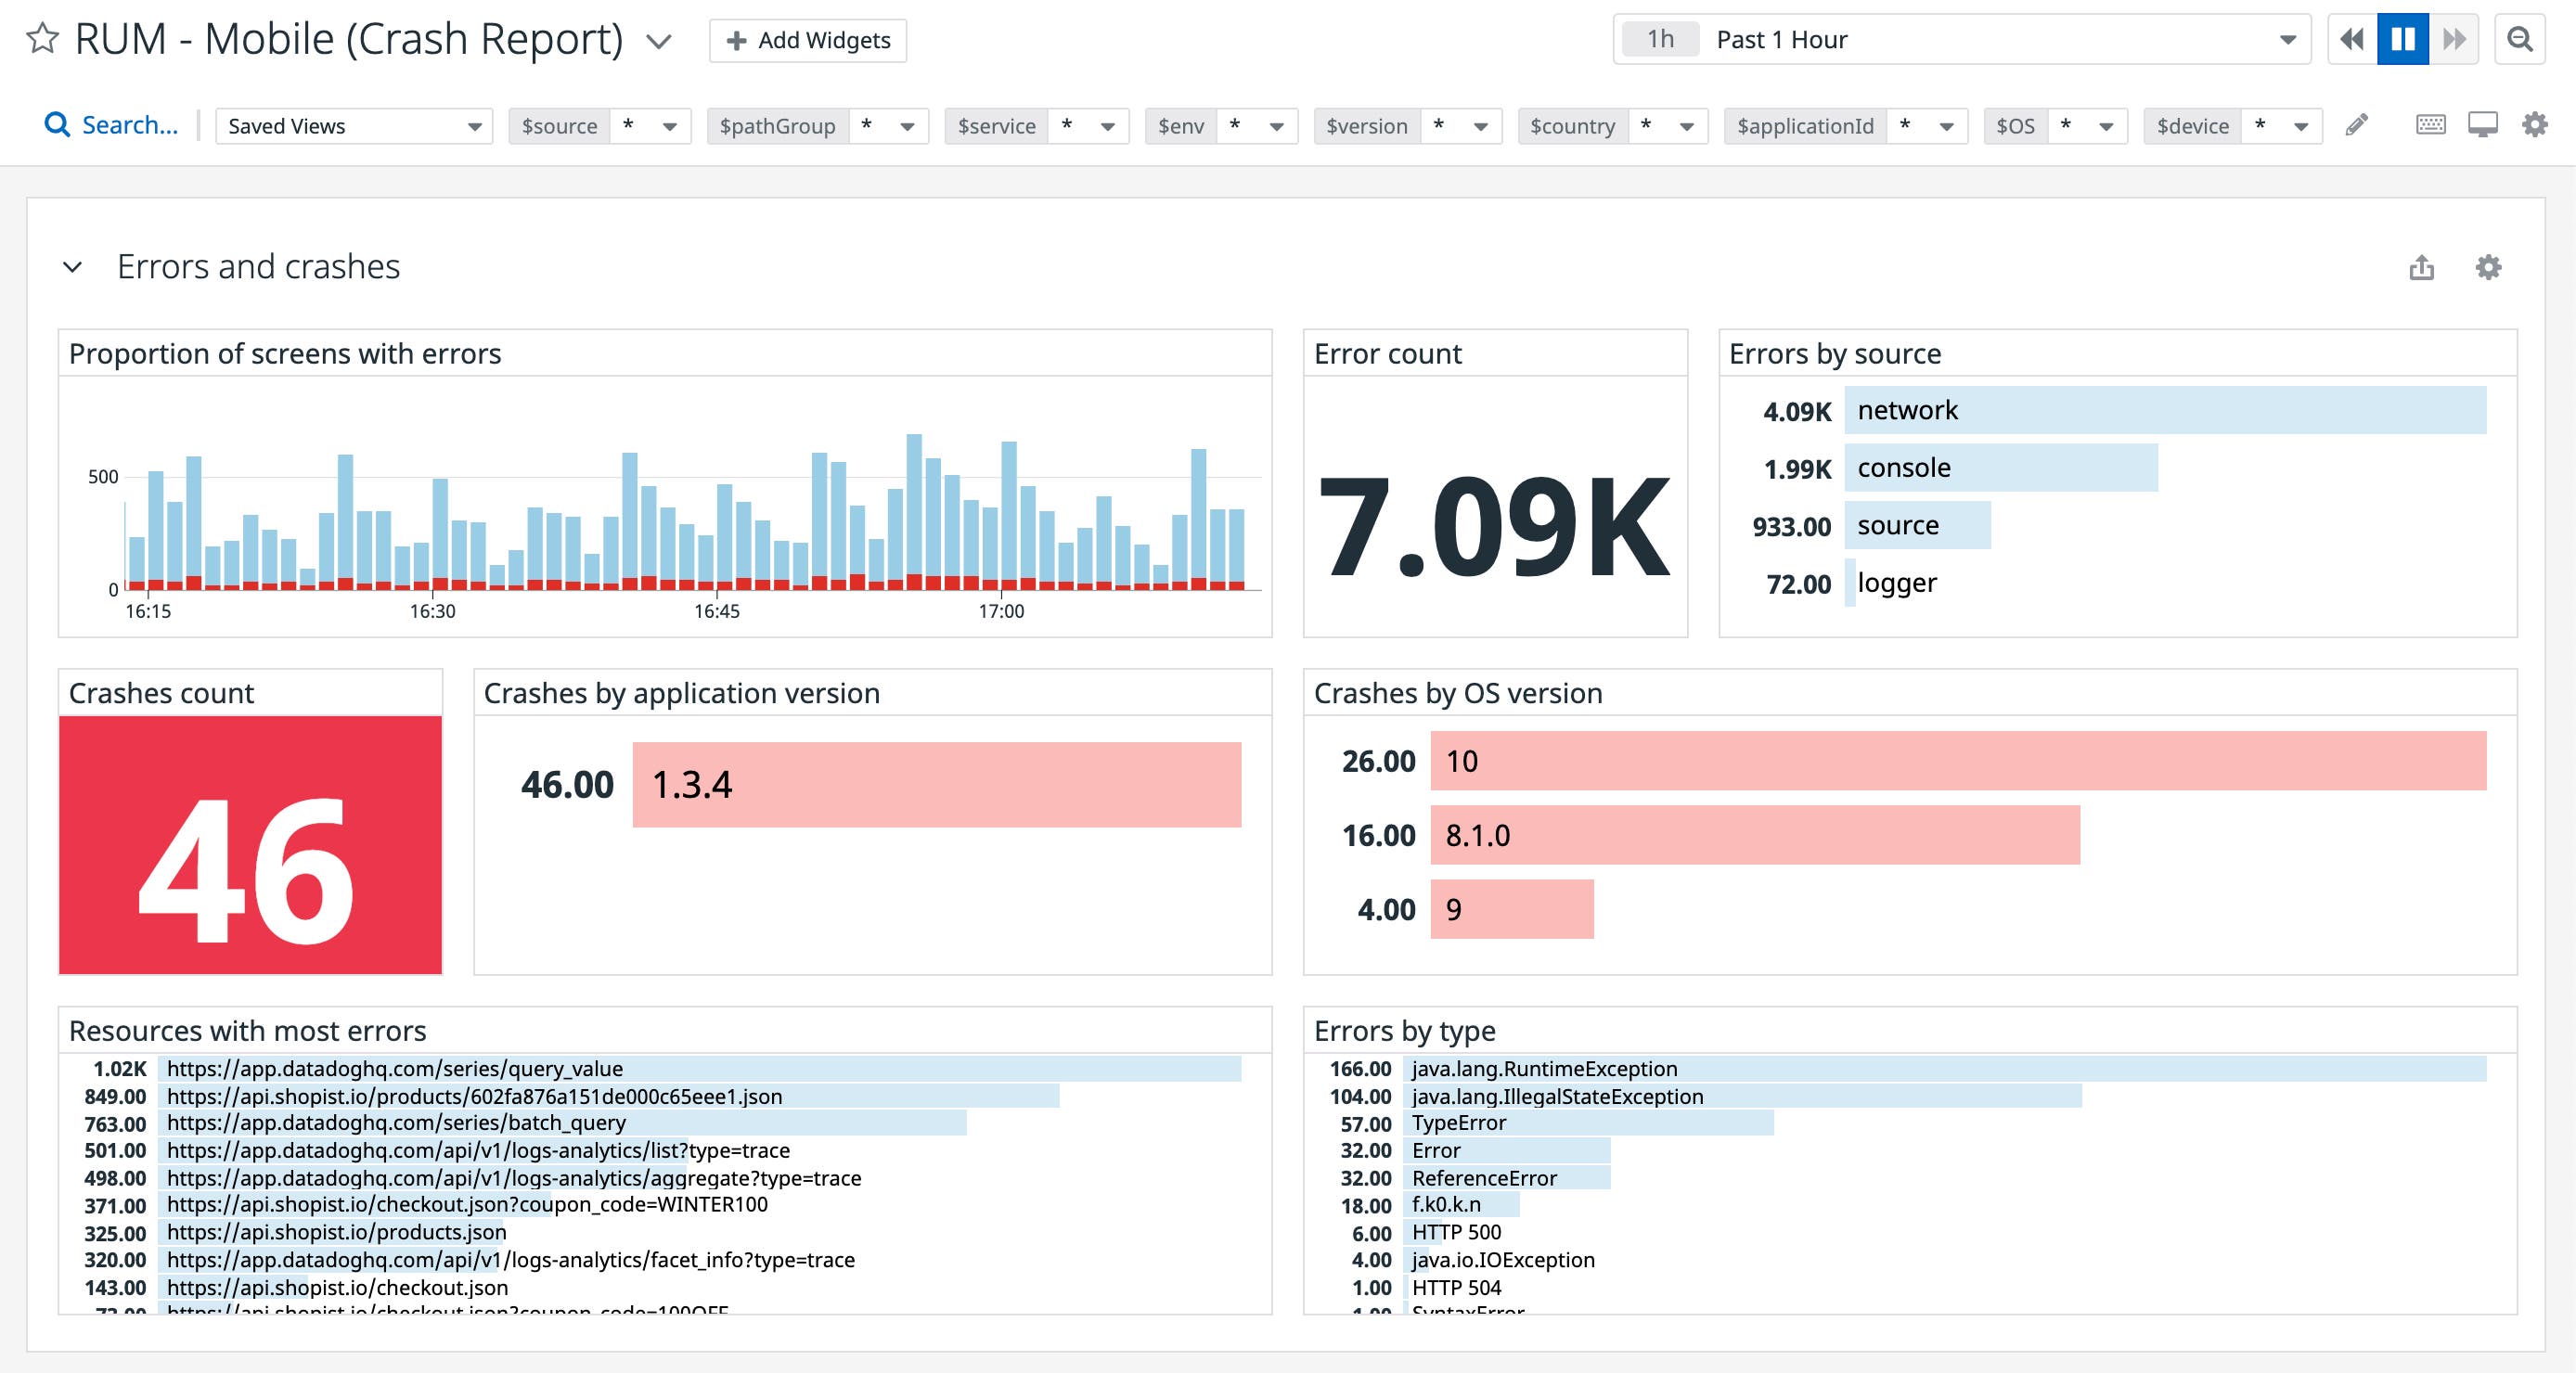
You can also build crash reports using Datadog’s RUM error dashboard in order to view all crashes or non-fatal errors at a glance, enabling you to get a better understanding of where and how they impact users the most.
Your application provides a wealth of RUM data, but knowing how to prioritize it is necessary for fixing crashes efficiently. Next, we’ll show you how Datadog helps you organize RUM data in order to quickly triage and respond to the most urgent application issues.
Fix Android crashes, starting with the most important ones
During heavy usage, your application may generate a large volume of errors that cause it to crash, such as I/O exceptions, runtime exceptions, and out-of-memory errors. With the wide range of Android devices and operating systems running different versions and build variants of your application, understanding the root cause of these errors is more challenging.
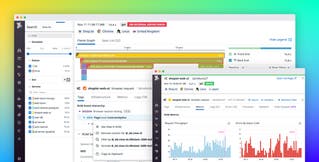
Datadog Error Tracking helps you reduce the noise and prioritize the most important errors captured by the Android SDK by grouping similar errors together into issues so that you can see which issues are impacting your users the most. Error Tracking also allows you to filter issues by different dimensions, such as a device’s operating system or the version of your application. For example, if multiple customers report a bug for the latest version of your application, you can filter by that specific version and quickly view all of the issues impacting it.
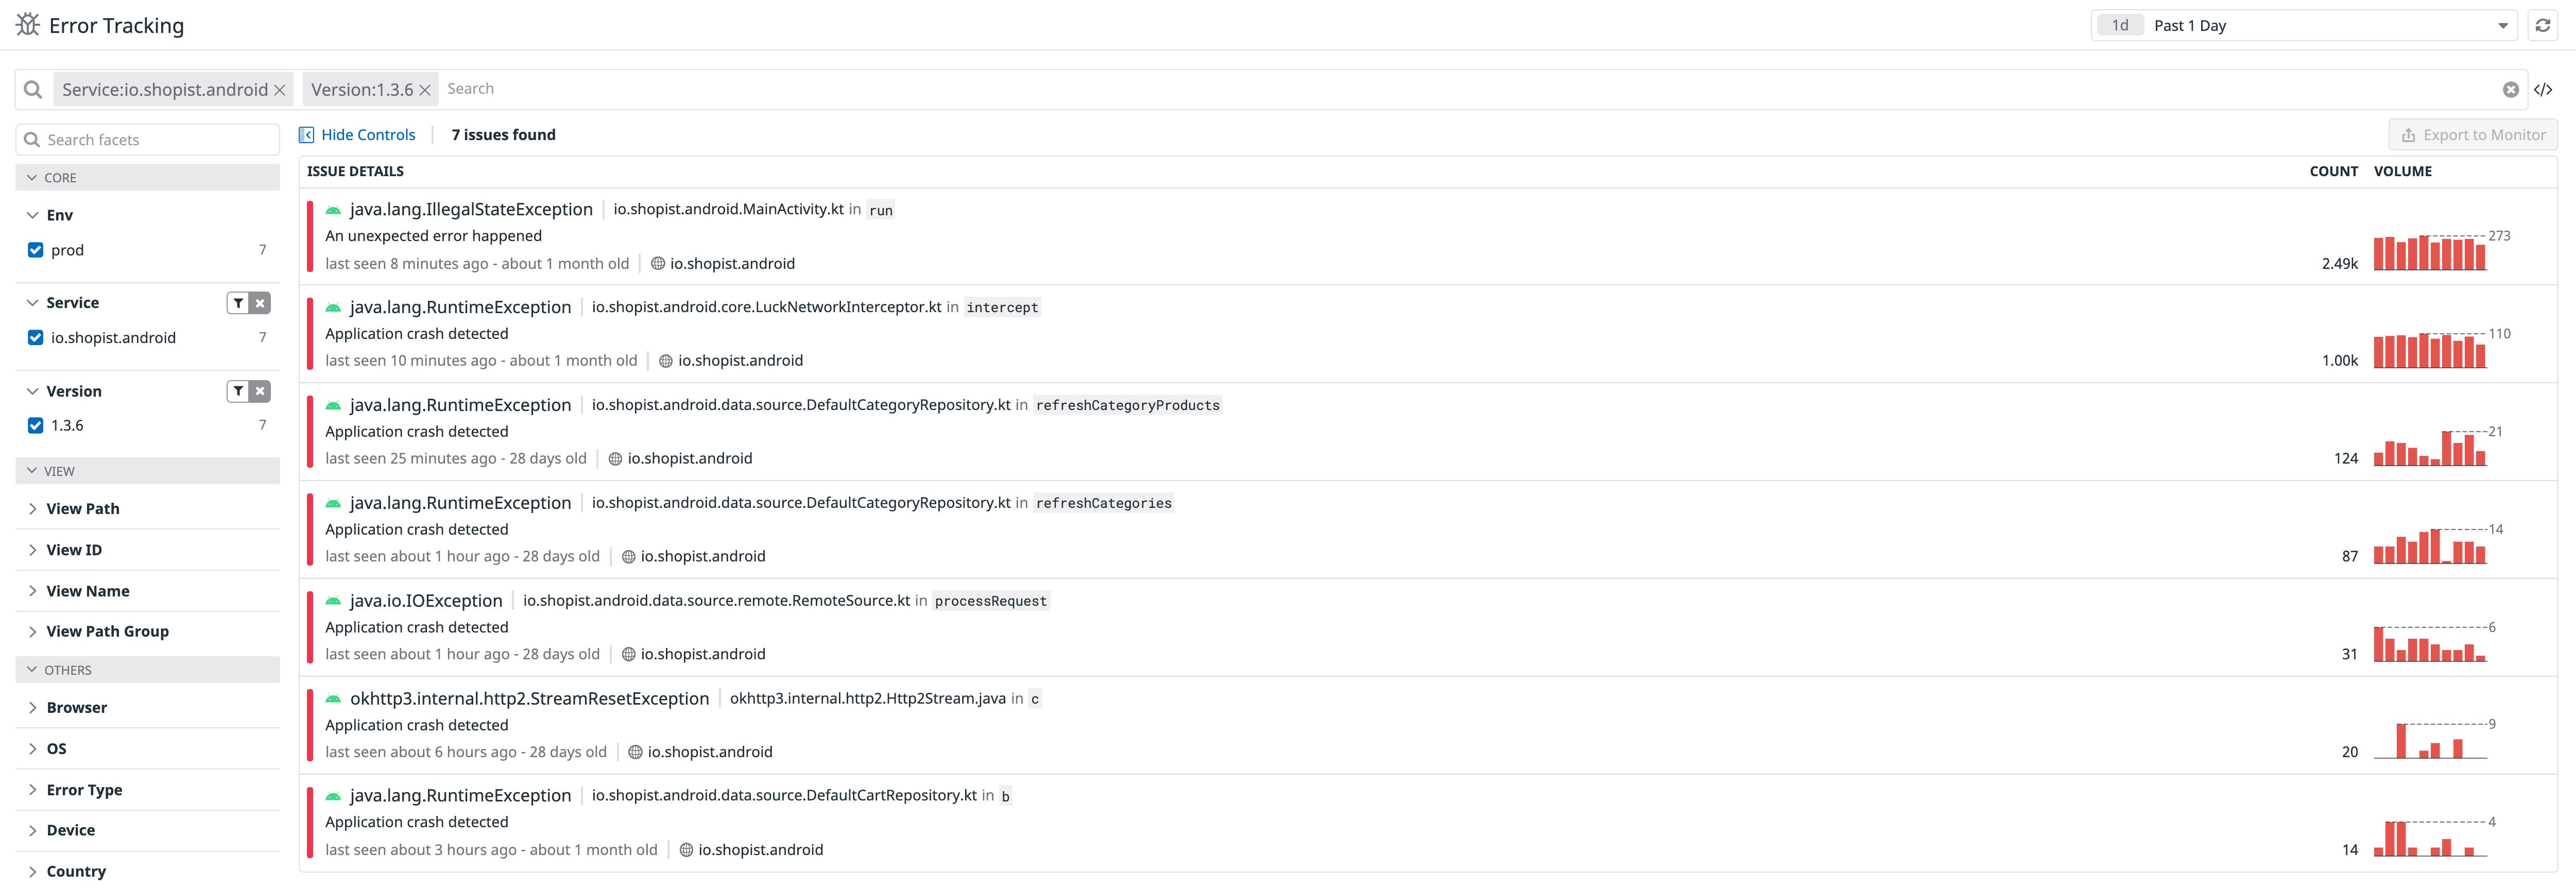
You can select any issue to see its frequency over time, which versions of your application were affected, the full stack trace of the error, and more details about user activity (e.g., views, device information, affected application versions). In the screenshot below, you can see that a runtime exception triggered a crash at the “Check-out” path group.
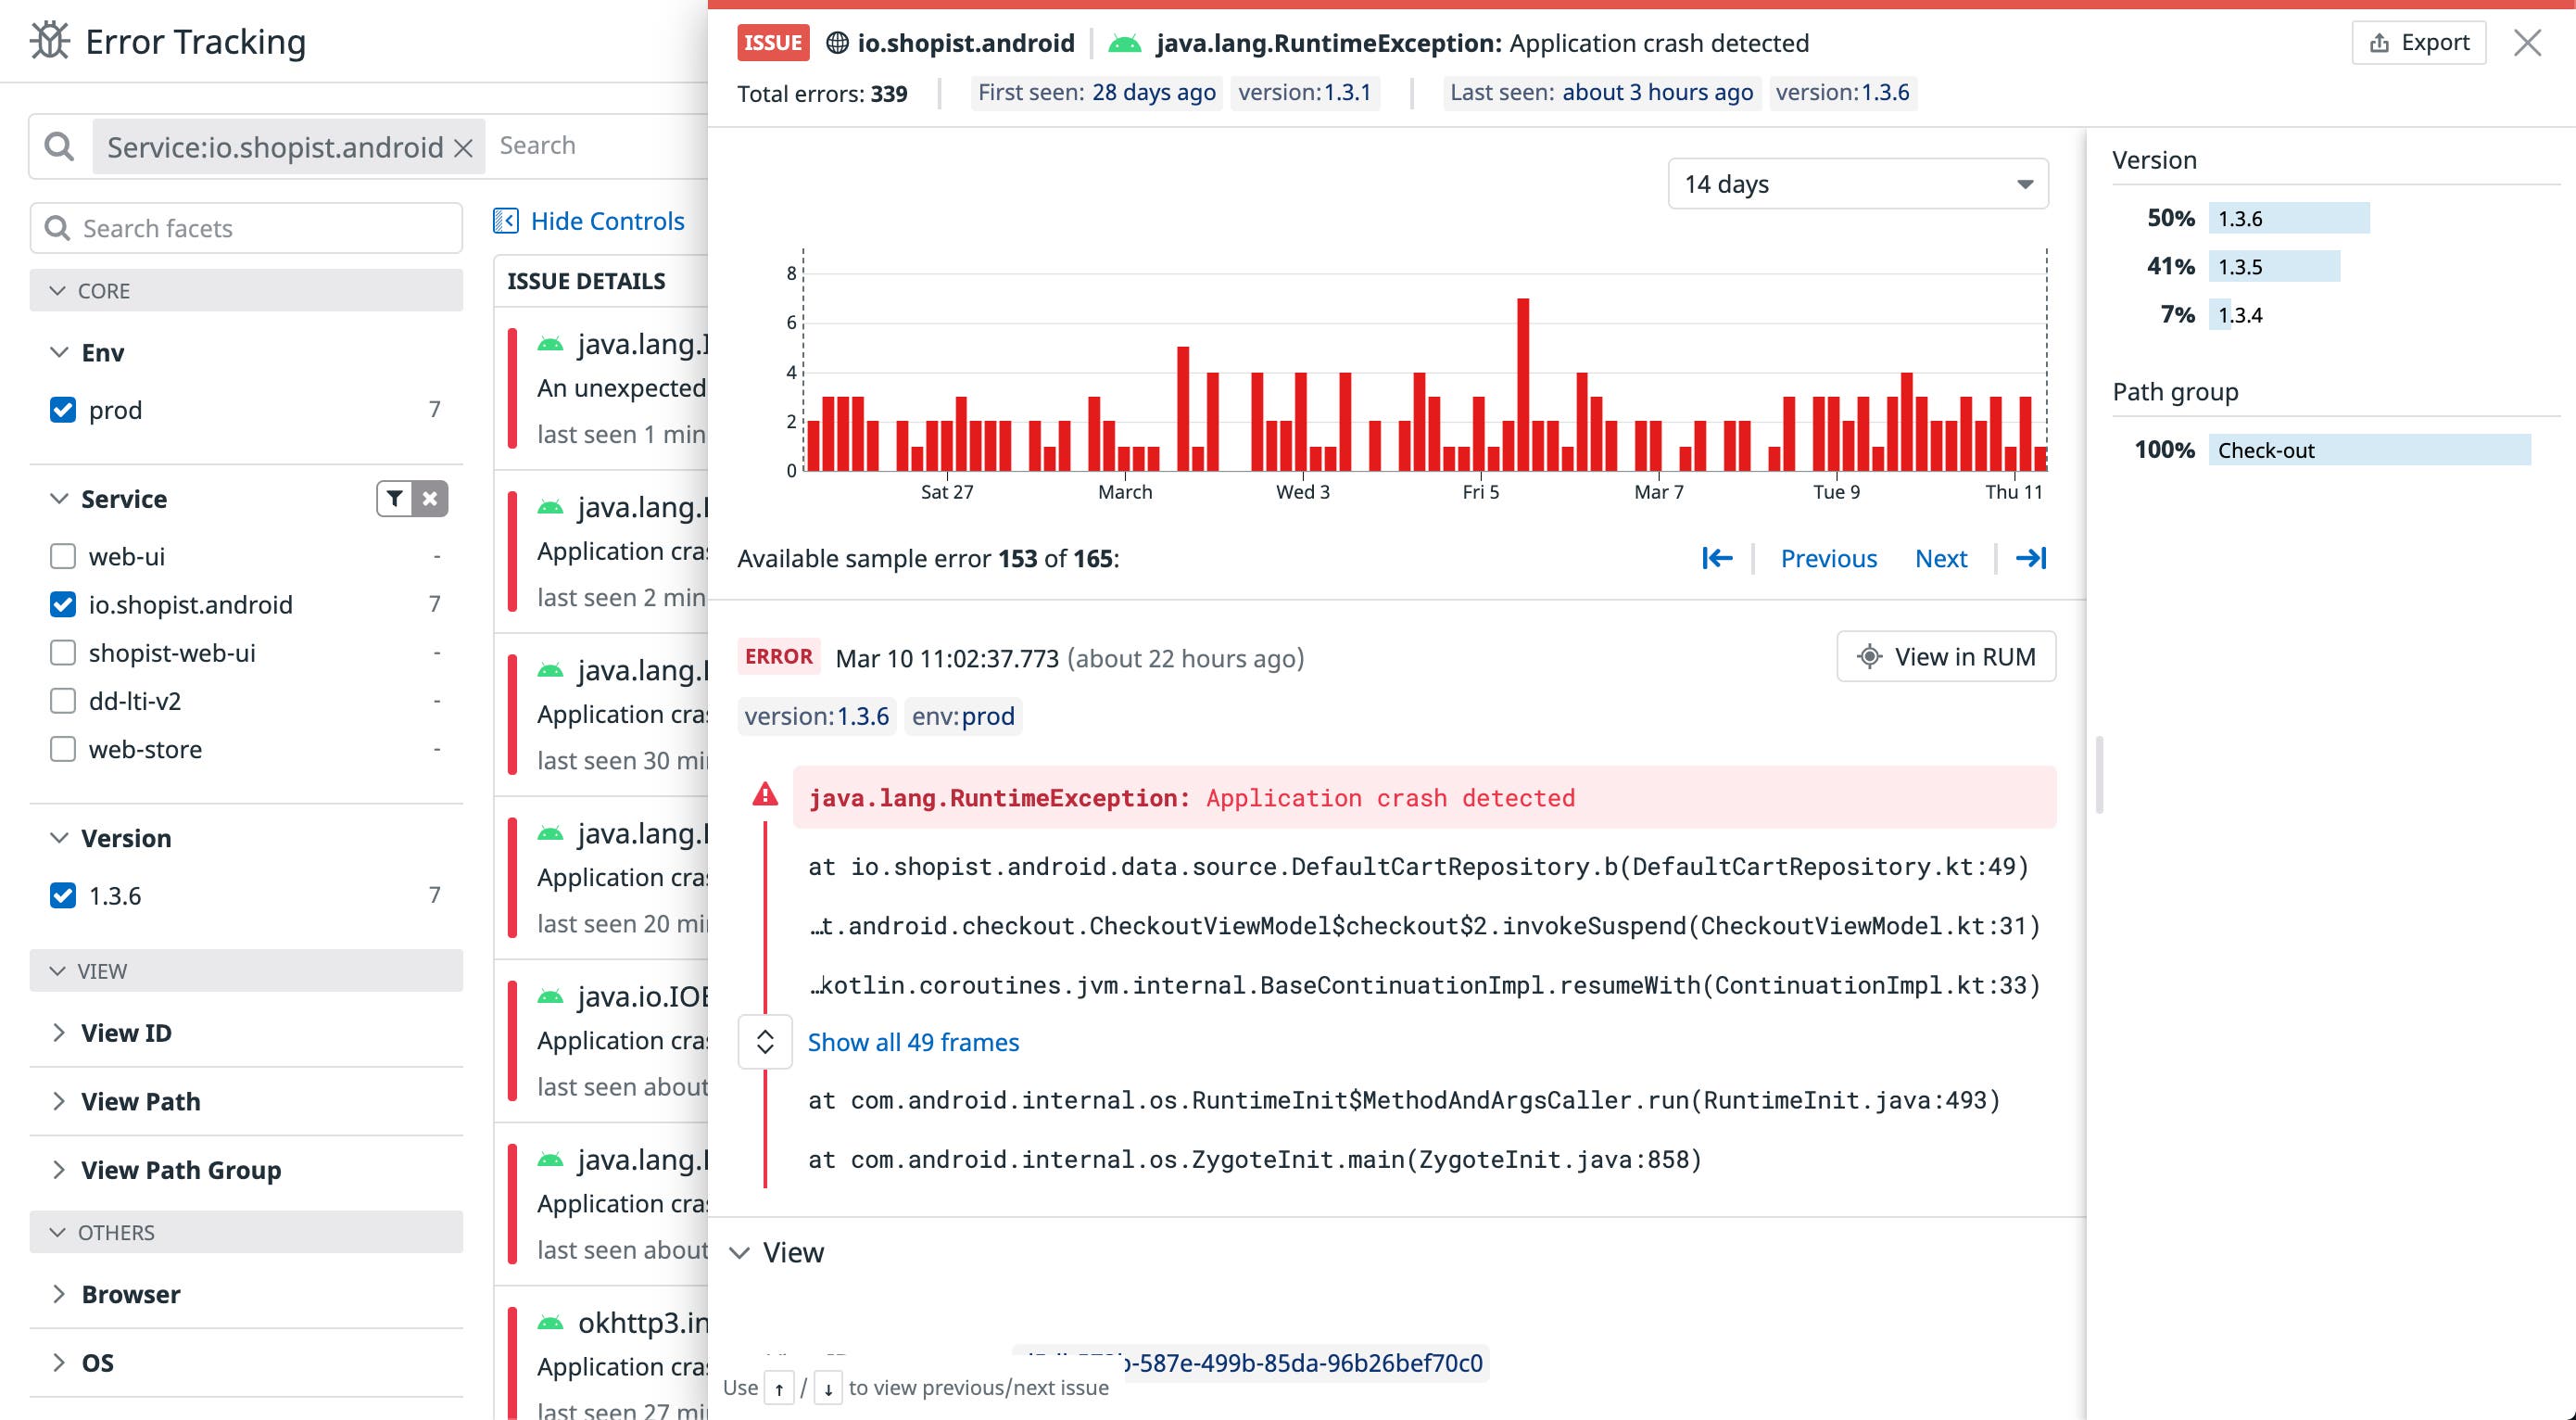
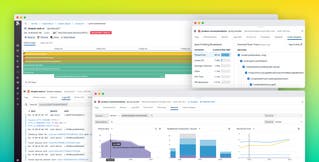
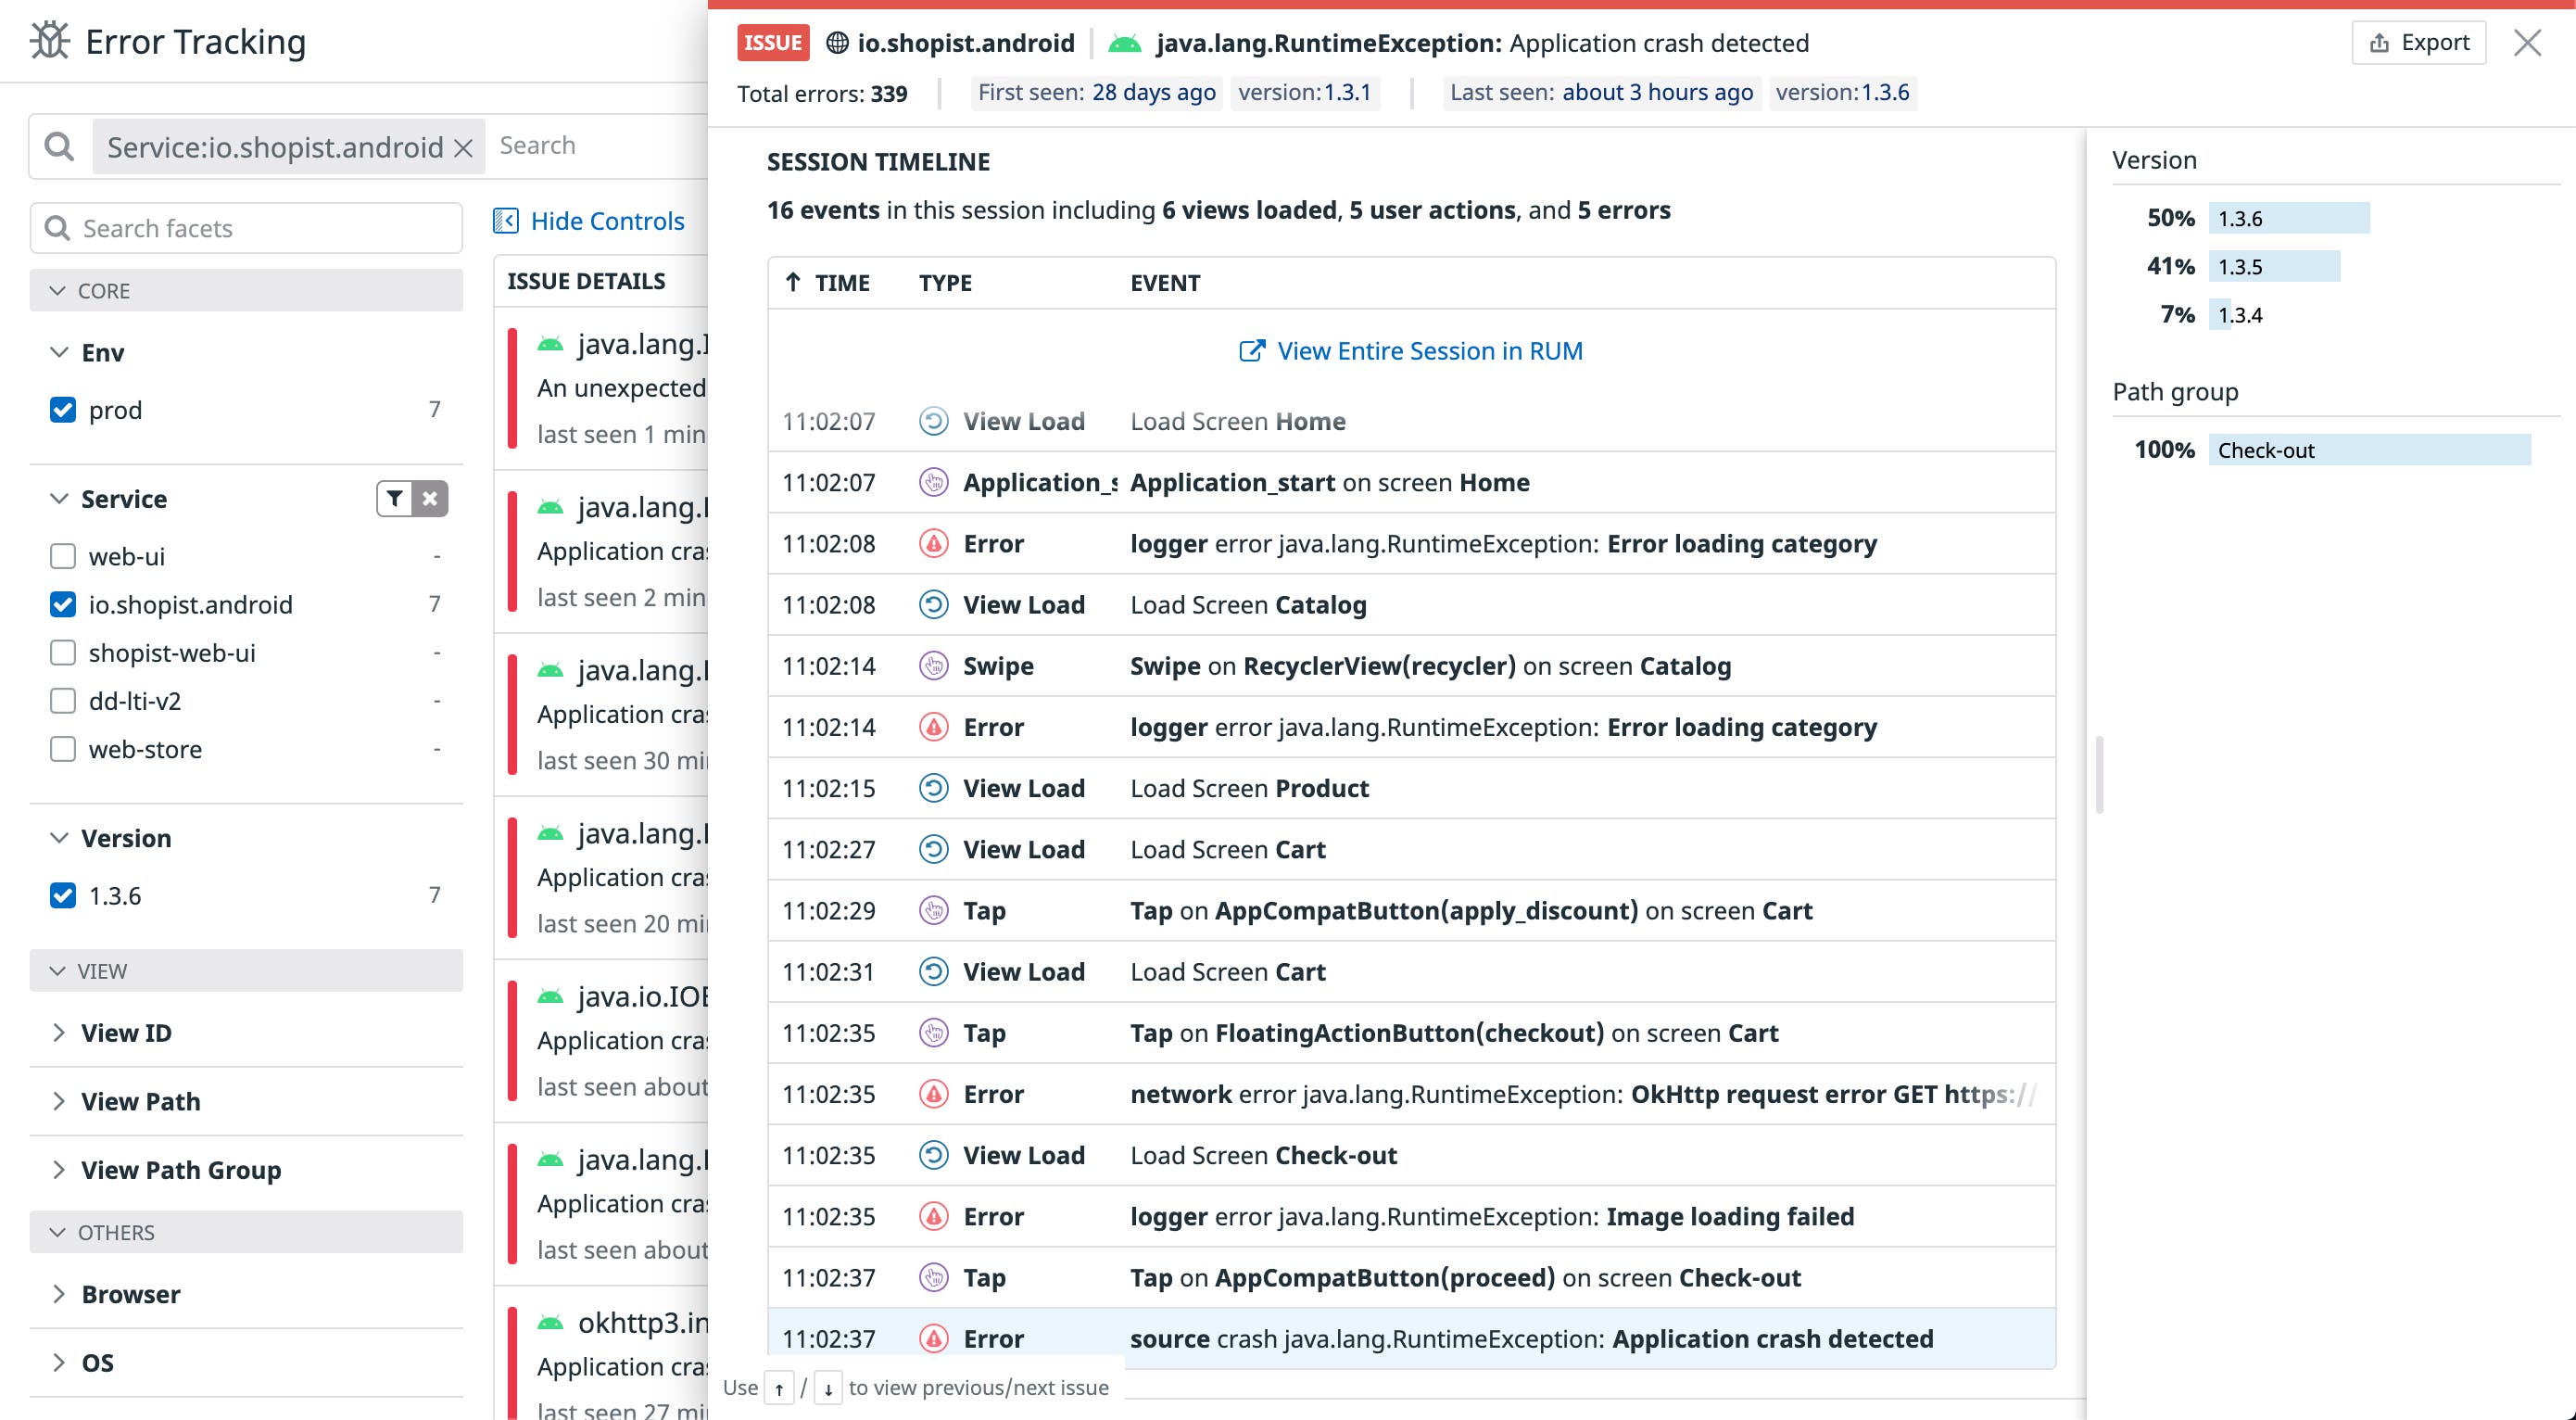
For more details about what led up to the crash, you can also view the full session timeline, as seen in the screenshot below. This gives you a complete history of the events before the crash, so you can better understand how to resolve the problem.
Issues like these severely impact your users’ experience, so you need to know when they happen as soon as possible. You can use alerts to instantly notify you of new issues, enabling you to address them before they become more critical or widespread.
Create alerts to immediately notify you of significant issues
Datadog offers intelligent alerting capabilities that you can customize to fit your needs in order to prioritize the most important issues while reducing alert fatigue. For example, you can create an alert that will notify you of every new issue that causes a crash on the application’s check-out path—the path attribute references the application’s view and is automatically captured by the SDK.
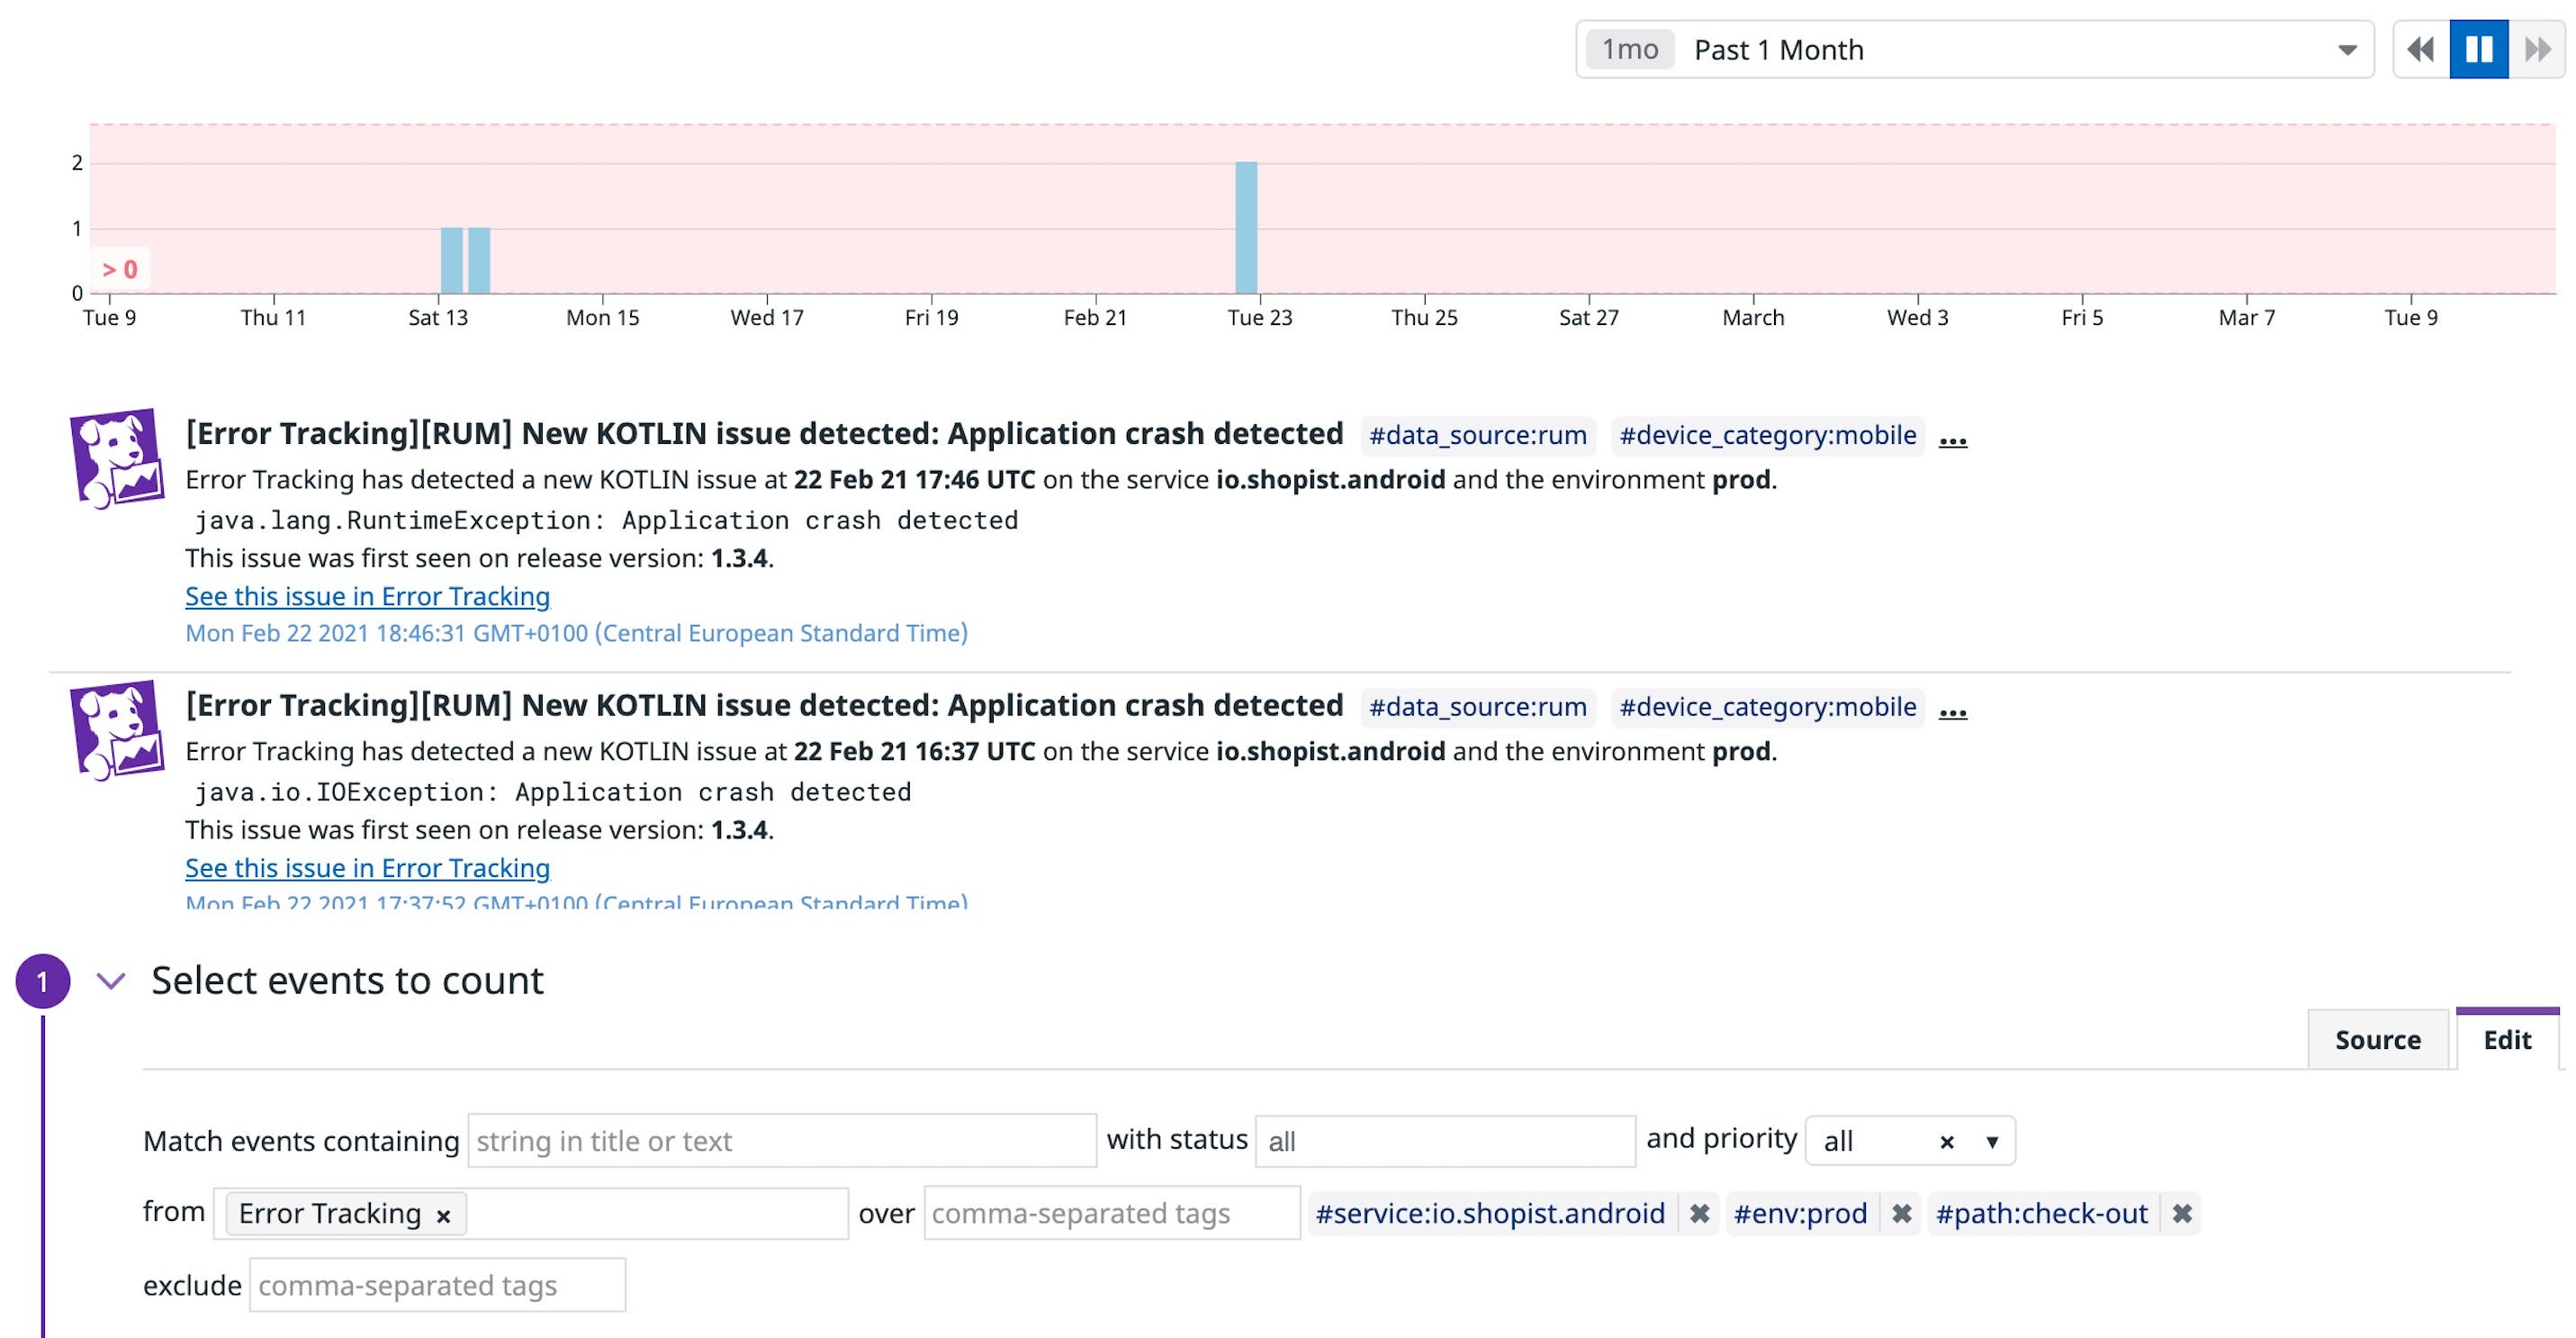
Alerts provide all of the context you need to troubleshoot the issue, enabling you, for example, to quickly remove the affected version from Google Play before more users install it.
Monitoring Android crashes with Datadog
Fatal crashes impact not only your users’ experience but also your application’s reach in a highly competitive mobile market. To ensure that your Android applications are performing optimally, you can use Datadog RUM and the Android SDK to collect, analyze, and resolve errors and fatal crashes—Error Tracking is built into RUM with no additional setup required. You can also use Datadog’s built-in RUM dashboards and Datadog APM to get end-to-end visibility across your entire application stack. Check out our documentation to learn more about collecting Android crash data, or sign up for a free 14-day trial today if you don’t already have a Datadog account.
