Alex Cuoci

Kai Xin Tai
As organizations build out their serverless footprint, they might find themselves managing hundreds or thousands of individual components (e.g., Amazon S3 buckets, Amazon DynamoDB tables, AWS SQS queues) for just a single application. At the same time, performance issues can crop up at any of these points, which means that having access to detailed observability data from your serverless functions is crucial for effective troubleshooting. But spinning up new services—and setting up monitoring for them—often involves writing boilerplate code for linking components, managing permissions, setting up logging, and other configuration tasks. Needless to say, reducing the friction in developing and monitoring applications is key for serverless to reach an ever broader developer base.
Deployment tools like the AWS Serverless Application Model (SAM) and AWS Cloud Development Kit (CDK) help developers take advantage of infrastructure as code and build applications in a clean and coherent way. To enable engineering teams to better grow with Datadog, we’ve built integrations with both of these tools to help you automatically collect metrics, traces, and logs from your Lambda functions, without any code instrumentation. By streamlining how you monitor your applications, Datadog reduces time to value and enables wider adoption of serverless across teams.
Bringing serverless observability closer to developers
As the ecosystem of serverless tools and services evolves, we are seeing a greater focus on improving the developer experience. AWS SAM, for instance, has become widely popular for allowing developers to easily build and deploy serverless applications. As an abstraction layer above AWS CloudFormation, AWS SAM allows you to specify all the components that make up an application (e.g., resources, functions, APIs) in a template—and use built-in command line tools to test, deploy, and manage your application. Similarly, AWS CDK lets you define application resources using familiar programming languages like JavaScript, .NET, and Python. Now, by referencing our CloudFormation macro in your AWS SAM or AWS CDK configuration, you can automatically wrap your Lambda functions to send observability data to Datadog, without altering your code.
With our macro, you can explicitly manage trace, log, and enhanced metric collection in one place using infrastructure as code. Datadog APM’s tracing libraries support the OpenTelemetry standard so you can start tracing without changing your existing instrumentation. The macro also manages the subscription of the Datadog Forwarder to AWS Lambda log groups, which means that you no longer need to manually configure triggers for log ingestion. Furthermore, our integration automatically configures the ingestion of enhanced Lambda metrics at a higher granularity than standard Amazon CloudWatch metrics, giving you even deeper insights into your workloads. By connecting your serverless traces, logs, and metrics, Datadog provides a context-rich picture of your application’s performance, allowing you to troubleshoot performance issues in real time.
Getting started with the macro
In this section, we’ll show you how to include the macro in your AWS SAM and AWS CDK configurations. This walkthrough assumes that you’ve cloned the Datadog CloudFormation macro repository and deployed the necessary macro resources, as detailed here.
AWS SAM
Start by setting up a new project in AWS SAM. In your project directory, you should see a template file (template.yml) that defines your application’s resources. Navigate to the Transform section and add DatadogCfnMacro under the default AWS::Serverless transform. Then, you can set configuration parameters, depending on the type of data you want to collect, as shown here:
Transform: - AWS::Serverless-2016-10-31 - Name: DatadogCfnMacro Parameters: # Send custom metrics via logs with the help of Datadog Forwarder Lambda function (recommended). Defaults to false. flushMetricsToLogs: true # Enable tracing on Lambda function using dd-trace, Datadog's APM library. Requires Datadog Log Forwarder to be set up. Defaults to true. enableDDTracing: true # When set, the macro will try to subscribe the Lambda's CloudWatch log groups to the Forwarder with the given ARN. forwarderArn: "arn:aws:lambda:<REGION>:<ACCOUNT-ID>:function:datadog-forwarder" # The name of the CloudFormation stack being deployed. Only required when a forwarderArn is provided and Lambda functions are dynamically named (when the `FunctionName` property isn't provided for a Lambda). stackName: !Ref "AWS::StackName" # When set, the macro will add a `service` tag to all Lambda functions with the provided value. service: "my-sam-app" [...]The Datadog Forwarder ships function logs, custom metrics, and traces to your Datadog account. You can configure this by adding the Forwarder ARN, as shown above.
If you’ve installed our AWS integration and provided Datadog with read-only access to Lambda, Datadog should already be collecting standard metrics from CloudWatch.
The Datadog Lambda Library works with the Datadog Forwarder to collect custom metrics, enhanced metrics, and distributed traces from your functions; our macro automatically configures the Lambda Library for Python and Node.js. Once you have the Lambda Library installed, you can enable flushMetricsToLogs, as shown in the example above, to send custom metrics to Datadog asynchronously via CloudWatch logs.
See the full list of configuration parameters here.
AWS CDK
If you’re using AWS CDK to deploy your application, add the Datadog CloudFormation macro to your Stack object constructor, as such:
from aws_cdk import core
class CdkStack(core.Stack): def __init__(self, scope: core.Construct, id: str, **kwargs) -> None: super().__init__(scope, id, **kwargs) self.add_transform("DatadogCfnMacro")
mapping = core.CfnMapping(self, "Datadog", mapping={ "Parameters": { "enableDDTracing": true, "flushMetricsToLogs": true, "stackName": self.stackName, "forwarderArn": "arn:aws:lambda:<REGION>:<ACCOUNT-ID>:function:datadog-forwarder", "service": "my-cdk-app", [...] } })Save the file, deploy your application, and you’re good to go!
See across your entire serverless stack
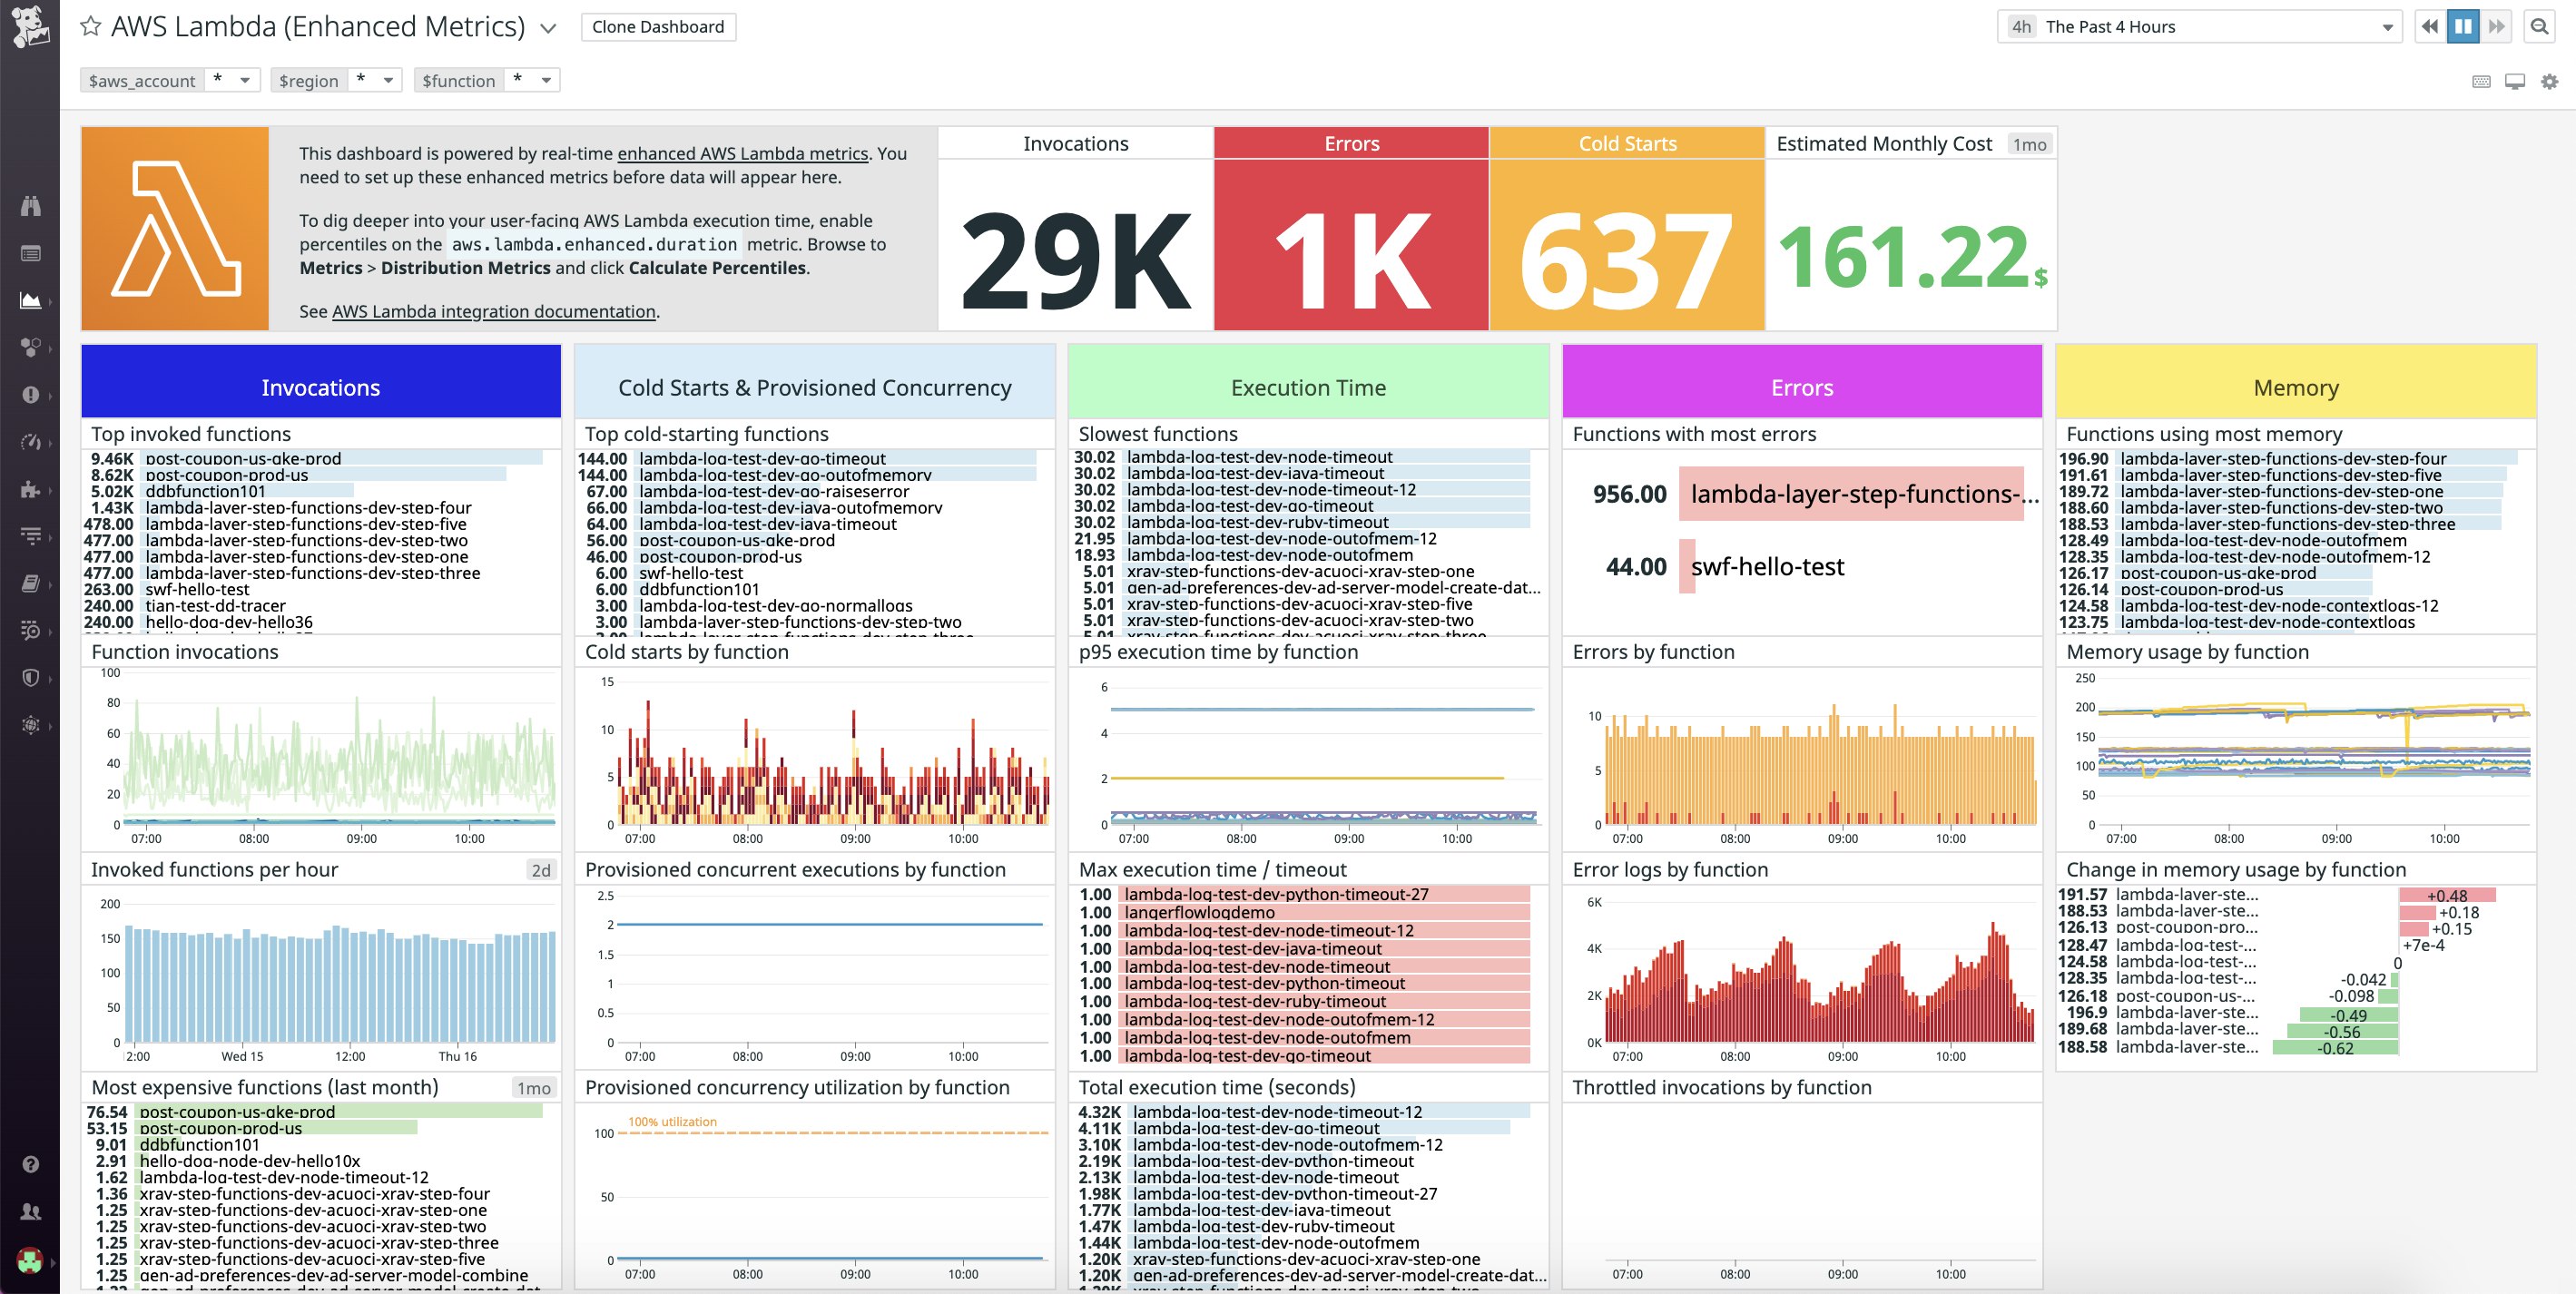
Within minutes, you can visualize key AWS Lambda metrics—such as invocations, duration, cold starts, and memory usage—on our out-of-the-box Lambda enhanced metrics dashboard. You can customize it to include custom metrics that are unique to your business (e.g., site traffic, cart size, revenue) and configure alerts—which we will discuss in the next section—that automatically notify you of any issues that are degrading your user experience.
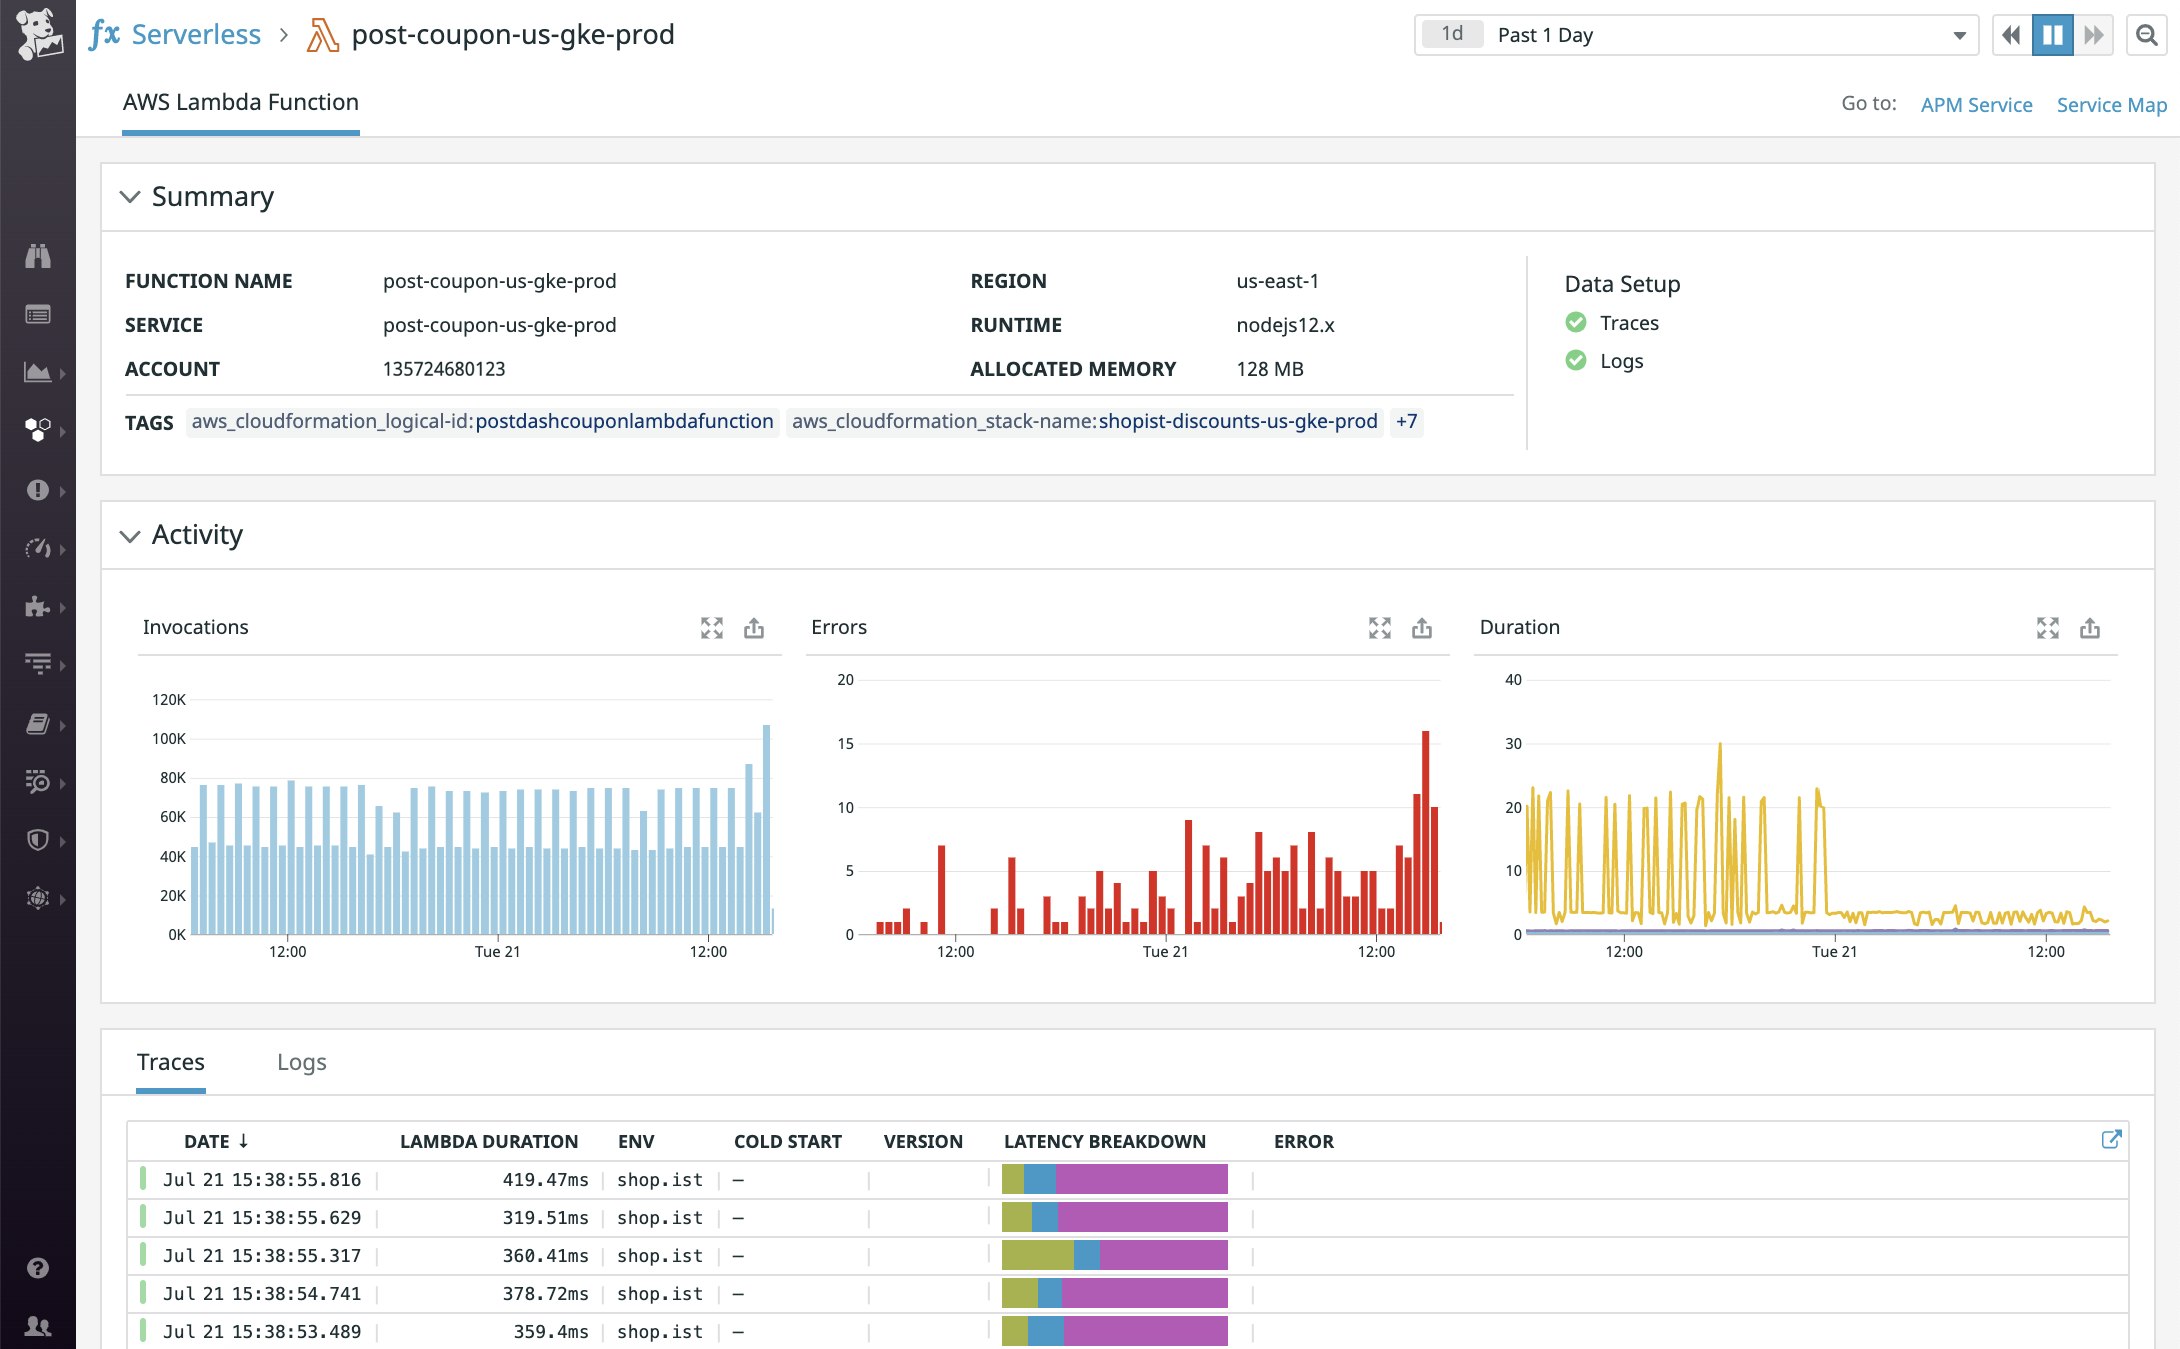
You can also navigate to the Serverless view, which provides a comprehensive view of all of the serverless functions running in your environment. From here, you can drill down to the functions from your AWS SAM applications with the lambda_createdby:SAM tag. Or, you can search and filter by any other combination of tags, such as AWS account, region, function name, and runtime.
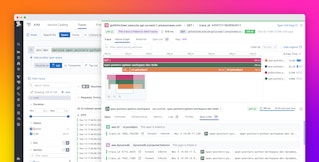
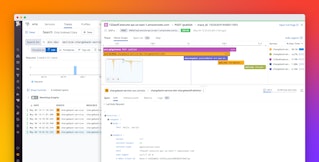
Clicking on a function brings up its key performance metrics, distributed traces, and logs. For instance, a distributed trace can help you visualize the full lifespan of a request as it flows across Lambda functions, hosts, containers, and other infrastructure components. You can then correlate any trace with related logs and metrics for greater context around any errors or slowdowns you are seeing. Read more about the monitoring capabilities built into the Serverless view here.
Manage your alerts, all in one place
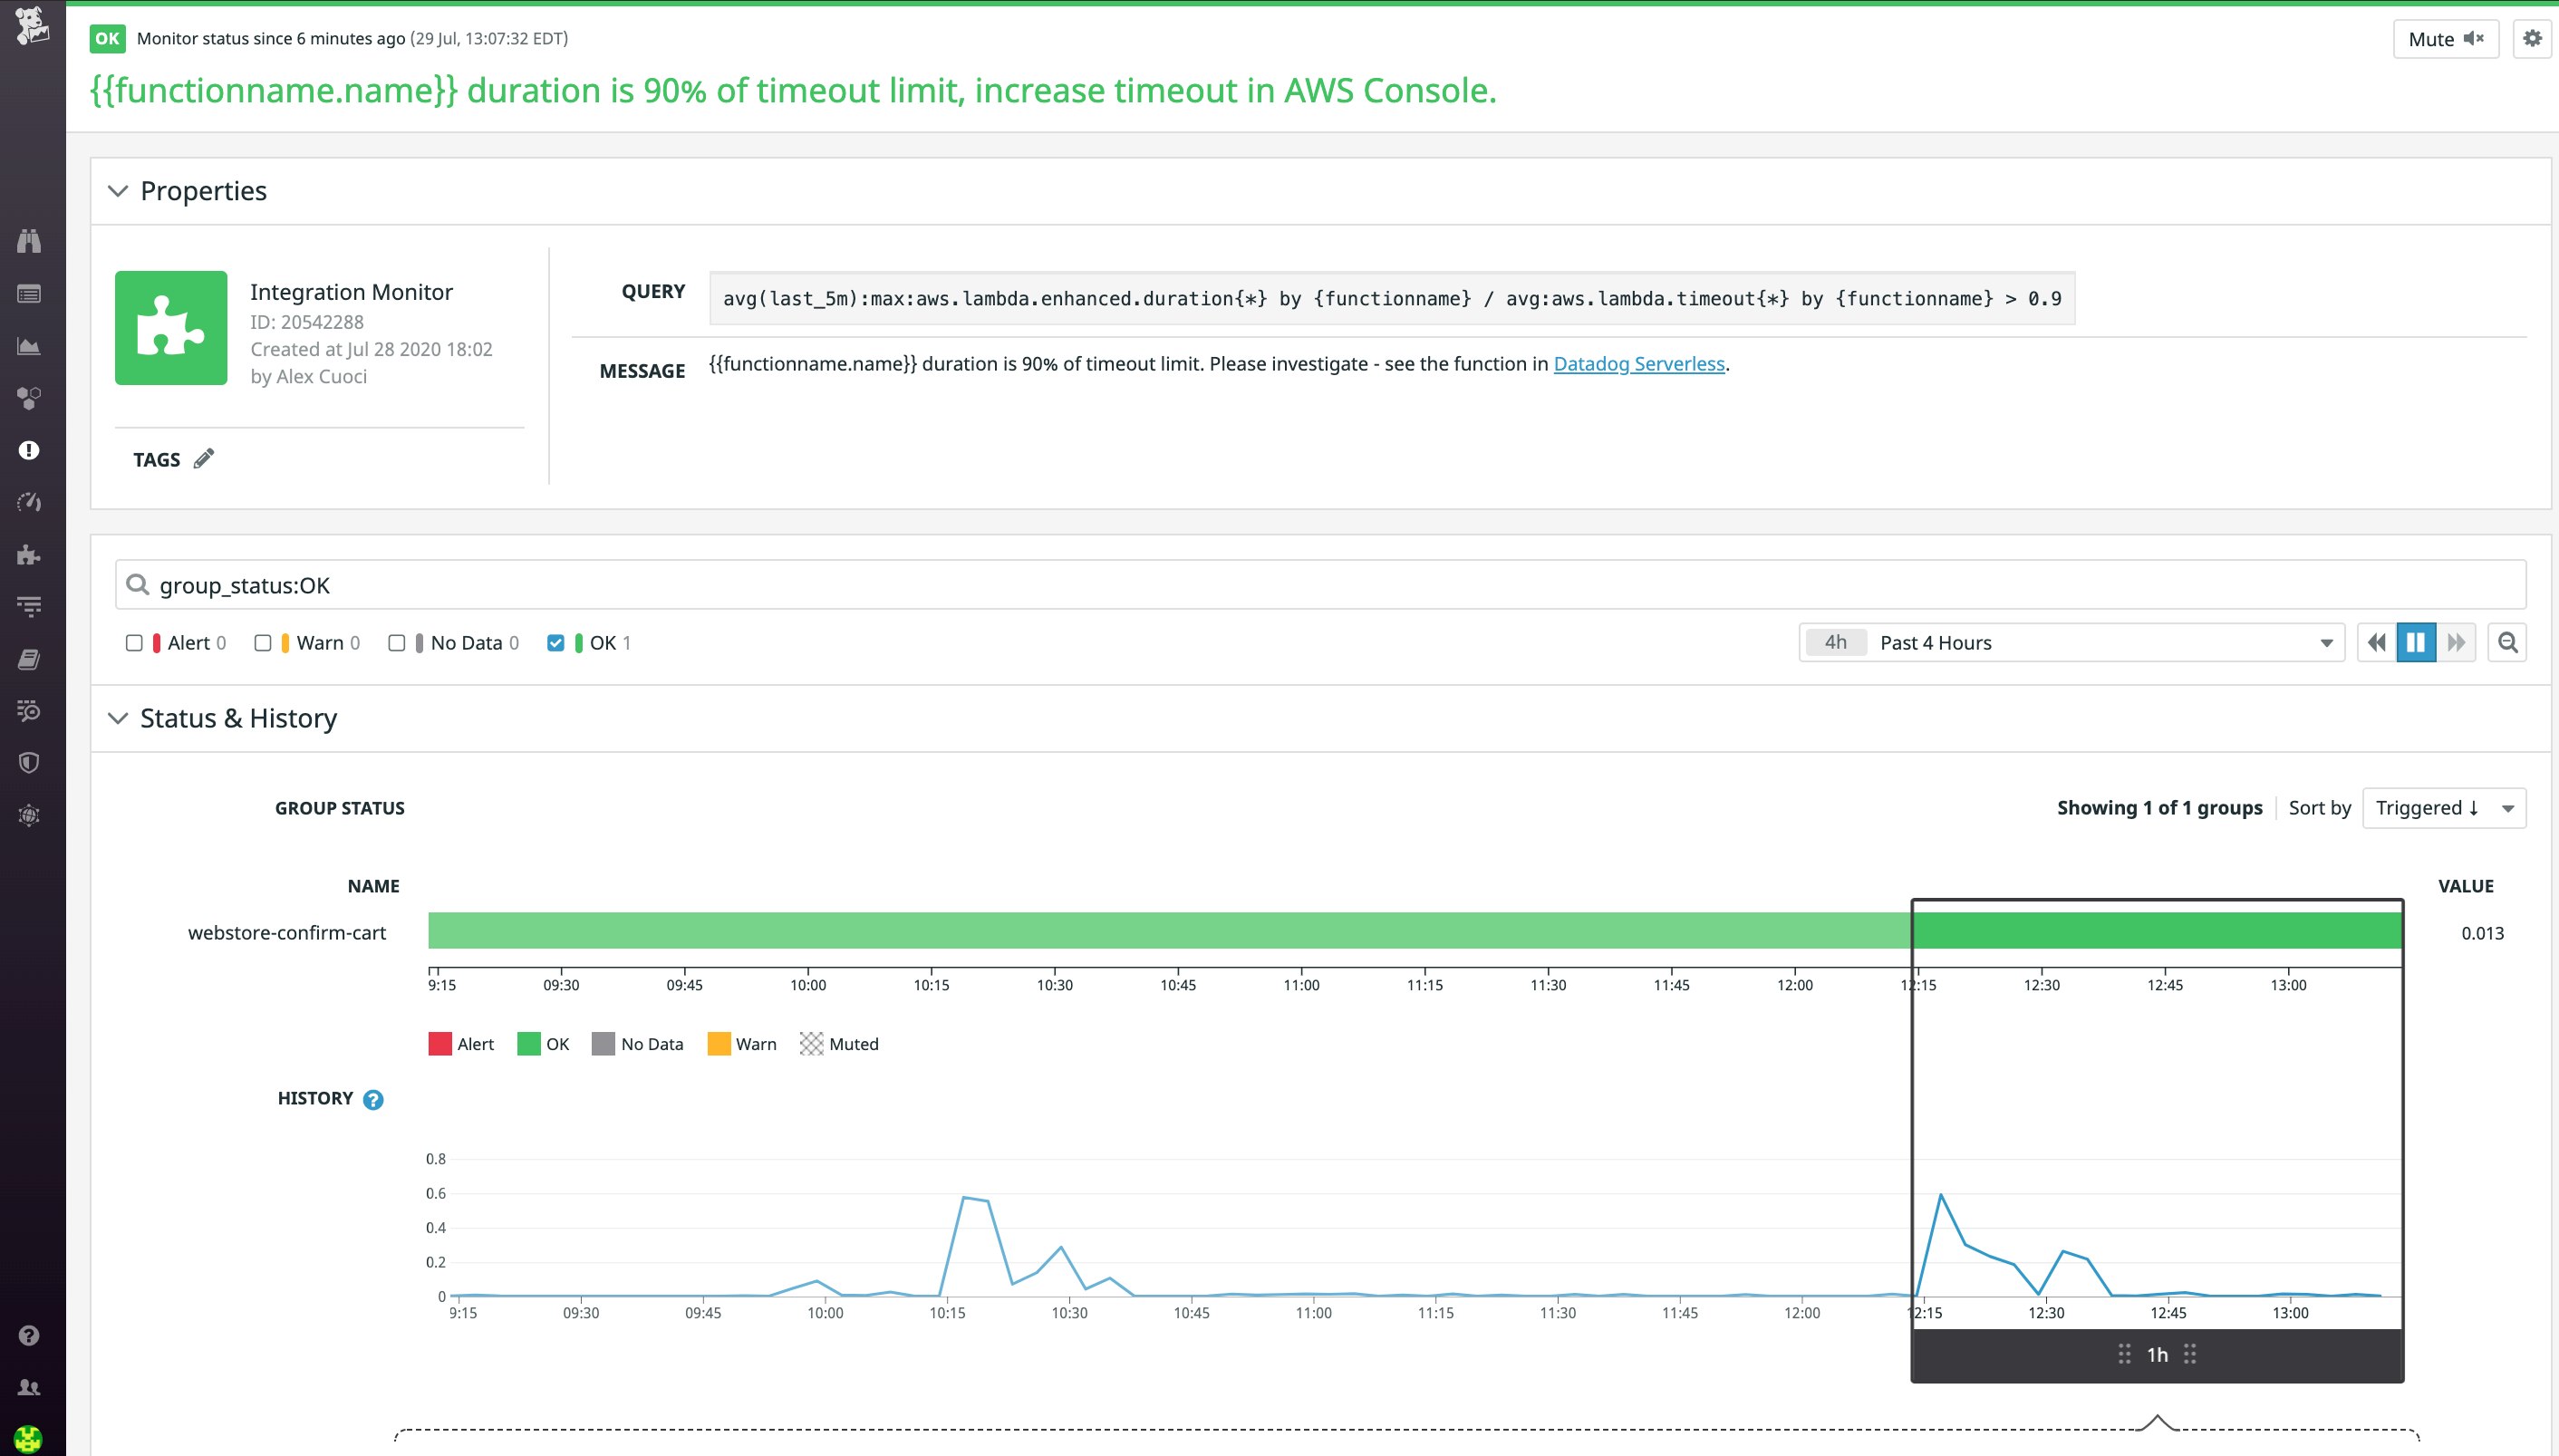
Now that you’re monitoring your Lambda functions with Datadog, it is a good idea to set up monitors to be automatically alerted of issues as soon as they arise. For instance, you might want to know each time you have a long-running function that is close to timing out so that you can look into optimizing your code or increasing the function’s timeout limit. Configuring monitors is simple and involves adding just a few extra lines to your AWS SAM template.
First, install the Datadog monitor CloudFormation resource (Datadog::Monitors::Monitor) using the AWS CLI, as detailed here. Then, define your monitor in the Resources section of your AWS SAM template (template.yml):
Resources: [...] MyTestMonitor: Type: Datadog::Monitors::Monitor Properties: Type: metric alert Query: 'avg(last_5m):max:aws.lambda.enhanced.duration{*} by {functionname} / (avg:aws.lambda.timeout{*} by {functionname} / 80 ) > 0.9' Name: "Function duration is 90% of limit, increase timeout in AWS Console." Multi: true Options: Thresholds: Critical: 0.9 Warning: 0.7 DatadogCredentials: ApiURL: https://api.datadoghq.com ApiKey: <DATADOG_API_KEY> ApplicationKey: <DATADOG_APP_KEY>In this example, we’re alerting on the function duration enhanced metric (aws.lambda.enhanced.duration), which we enabled earlier with the Datadog CloudFormation macro. Since it’s configured as a multi-alert, you will be notified as a function’s execution time gets closer to its timeout limit—once after it crosses the warning threshold and again after it passes the critical threshold—so you can dig into the issue before it impacts your customers. Learn more about the Datadog monitor CloudFormation resource, including additional properties here.
With our AWS SAM and CDK integrations, you can manage everything you need to get deep visibility into your serverless environment—from enhanced metrics and distributed traces to logs and monitors—all in one place. For many of our customers, this means adopting serverless across teams is more accessible, since key engineers spend little to no time instrumenting their applications, and more time solving customer problems.
Serverless monitoring, transformed
If you’re already using Datadog to monitor your serverless functions, applications, and cloud infrastructure, you can start using our CloudFormation macro with your AWS SAM and CDK applications today. Otherwise, sign up for a 14-day free trial.

