Bowen Chen

Nenad Noveljić
Continuous profiling has established itself as core observability practice, so much so that we’ve referred to it as the fourth pillar of observability. But despite the capabilities and growing adoption of continuous profiling, it can still be confusing to approach profiling as a newcomer and correctly apply it to different troubleshooting scenarios. For example, when using a flame graph to correlate memory issues to specific lines of code, you might see a wide span and think, “This function is hoarding memory,” which isn’t always true.
In this blog post, we’ll discuss a common misconception surrounding memory allocation and memory retention, and also when to visualize your flame graph using heap live size versus allocated memory. We’ve provided demo Python code for both topics, so you can try and recreate a demo example in your local environment to help further your understanding.
Memory allocation versus memory retention
You likely have some sort of alerting or dashboard configured to monitor your application’s memory usage. For Python applications, this may be memory usage grouped by container or monitoring the RSS of different processes. When these metrics steadily grow over time, it often indicates that objects are being held longer than intended, in which case you’ll need to investigate the data structures that are holding memory.
To illustrate this example, we have the following Python file allocator_vs_holder.py. In it, we create a list (cache) that holds several objects (obj) that are each allocated a large portion of memory. While this is a simplified representation, it reflects what you’d typically investigate when faced with an increased memory footprint: i.e., trying to surface the objects that are holding references (in this case, the bytearray obj instantiated in line 12 of our code).
import timefrom ddtrace.profiling import Profiler
cache = [] # This is the "holder" – it keeps references alive.
def allocate_then_return(n_bytes: int) -> bytearray: # "Allocator": creates the memory and returns it. return bytearray(n_bytes)
def make_and_hold(items: int, size: int) -> None: for _ in range(items): obj = allocate_then_return(size) # The *holder* is here: we keep references so objects stay live. cache.append(obj) time.sleep(0.05)
if __name__ == "__main__": Profiler().start() # Hold a few big objects (live heap goes up) make_and_hold(items=6, size=5_000_000) # ~30MB retained
# Keep process alive for a couple profile collections time.sleep(90)A common use case for the Datadog Continuous Profiler is to help troubleshoot these memory issues, and many developers may instinctively default to using the heap live size view to get a sense of the processes currently occupying memory in use. However, the common pitfall when using the heap live size view is assuming that the spans direct you to the retaining path when in reality, the spans point to where the memory is being allocated and not held.

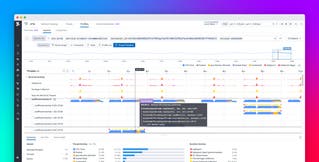
Consider the heap live size flame graph for the previous example. Typically, you might defer to the top of the call stack and be inclined to believe that this is the function holding memory. However, knowing our code, what we’re actually interested in is not the allocate_then_return function at the top of our call stack but rather line 12 of the make_and_hold function where obj is keeping our references live.
One method that can lead you to the memory retaining code is to investigate the retainer objects themselves. By adding debugging code to our main block, we can attempt to programmatically extract more information:
# Retained memory by type from pympler import muppy, asizeof all_objs = muppy.get_objects() items = [] for o in all_objs: try: items.append((asizeof.asizeof(o), type(o).__name__, repr(o)[:120])) except Exception: pass
for size, typ, rep in sorted(items, reverse=True)[:20]: print(f"{size/1024/1024:8.1f} MB {typ:20} {rep}")In this debugging code, we’re using muppy.get_objects, which is a function from Python’s Pympler library that returns a list of all currently tracked Python objects. Using our print function, we can sort the largest objects currently held in memory and try to gather clues regarding their size, type, and content. Using the output, we can determine that the memory holder is a list of bytearrays, which enables us to tie it tocache. Python garbage-collects an object when there are no longer any references to it, but since cache is a global variable, it holds persistent reference to each item in its list. Therefore, we can conclude that the memory retaining code in this example is line 14, where cache appends each bytearray and establishes the reference.
50.6 MB module <module '__main__' from '/Users/nenad.noveljic/Python/allocator_vs_holder.py'> 28.6 MB list [bytearray(b'\x00\x00\x00\x00\x00\x00\x00\x00\x00\x00\x00\x00\x00\x00\x00\x00\x00\x00\x00\x00\x00\x00\x00\x00\x00\x00\x0 4.8 MB bytearray bytearray(b'\x00\x00\x00\x00\x00\x00\x00\x00\x00\x00\x00\x00\x00\x00\x00\x00\x00\x00\x00\x00\x00\x00\x00\x00\x00\x00\x00 4.8 MB bytearray bytearray(b'\x00\x00\x00\x00\x00\x00\x00\x00\x00\x00\x00\x00\x00\x00\x00\x00\x00\x00\x00\x00\x00\x00\x00\x00\x00\x00\x00 4.8 MB bytearray bytearray(b'\x00\x00\x00\x00\x00\x00\x00\x00\x00\x00\x00\x00\x00\x00\x00\x00\x00\x00\x00\x00\x00\x00\x00\x00\x00\x00\x00 4.8 MB bytearray bytearray(b'\x00\x00\x00\x00\x00\x00\x00\x00\x00\x00\x00\x00\x00\x00\x00\x00\x00\x00\x00\x00\x00\x00\x00\x00\x00\x00\x00 4.8 MB bytearray bytearray(b'\x00\x00\x00\x00\x00\x00\x00\x00\x00\x00\x00\x00\x00\x00\x00\x00\x00\x00\x00\x00\x00\x00\x00\x00\x00\x00\x00 4.8 MB bytearray bytearray(b'\x00\x00\x00\x00\x00\x00\x00\x00\x00\x00\x00\x00\x00\x00\x00\x00\x00\x00\x00\x00\x00\x00\x00\x00\x00\x00\x00When to use heap live size vs. allocated memory
At this point, you’re probably wondering, “If the heap live size view is showing me where allocations occur, how does it differ from my profiler’s allocated memory view, and how do I determine which view to use?” In short, the heap live size only displays allocated memory for functions that are still in use, while the allocated memory view helps you visualize memory allocations regardless of whether the objects remain in use or if they were subsequently freed by garbage collection. Determining when to use which of these views is typically based on the nature of the issue you’re investigating.
To provide an illustrative example, consider the following code in which we have two functions: grow_heap, which adds large byte arrays to a persistent list, and heavy_churn, which allocates memory and frees it almost instantly.
import timefrom ddtrace.profiling import Profiler
bag = []
def grow_heap(): # Grow to a stable plateau by retaining big objects for _ in range(8): cache.append(bytearray(4_000_000)) # ~32MB total time.sleep(0.05)
def heavy_churn(): # High allocation rate; most objects die quickly for _ in range(300_000): _ = bytearray(1024)
if __name__ == "__main__": Profiler().start() grow_heap() # increases live heap heavy_churn() # spikes allocations without growing heap much time.sleep(90)grow_heap is very similar to our previously discussed example, in that the code creates a growing, persistent memory footprint. For this issue, we recommend using the heap live size view, because you want to find out what functions are using live memory (and remember to investigate the memory holder and not allocator). Looking at the corresponding code profile, the heap live size view directs us to line 9 in our grow_heap function, which is where the large byte arrays are allocated and then added to the list.

Similarly, the heap live size also lets us troubleshoot increases in memory footprint following events such as new deployments, traffic spikes, or changes to infrastructure. The Datadog Continuous Profiler’s compare feature enables you to perform a side-by-side comparison of memory profiles from different time periods and visualize how the memory footprint of different functions have changed over time.
Not all memory issues revolve around growing memory footprints. Often, your hosts and applications can suffer from high CPU usage and increased garbage collection latency as a result of heavy churn (when objects are frequently allocated and freed). In these cases, we’re less concerned with the live objects in our heap and more interested in the code that is creating objects. Using the profiler’s allocated memory view, we can visualize the spans that are allocating the most memory per minute. In this case, the top of our call stack directs us to line 20 in our heavy_churn function, which is where byte arrays are continuously allocated and freed.

Get Started with Datadog today
Profiling memory issues isn’t always as simple as investigating the span at the top of the stack, or even following the call stack as we did in this example. Often, the memory retaining path does not overlap with the call path that allocates memory, and surfacing it requires a deep understanding of the source code you’re investigating. To help simplify your investigation, Datadog is currently developing native solutions to identify memory retaining code paths for Java and .NET.
To start profiling your Python applications, check out our documentation for the Datadog Continuous Profiler, or explore our other blogs and guides on code profiling. If you’re new to Datadog, sign up for a 14-day free trial.


