


Paul Gottschling

Yair Cohen
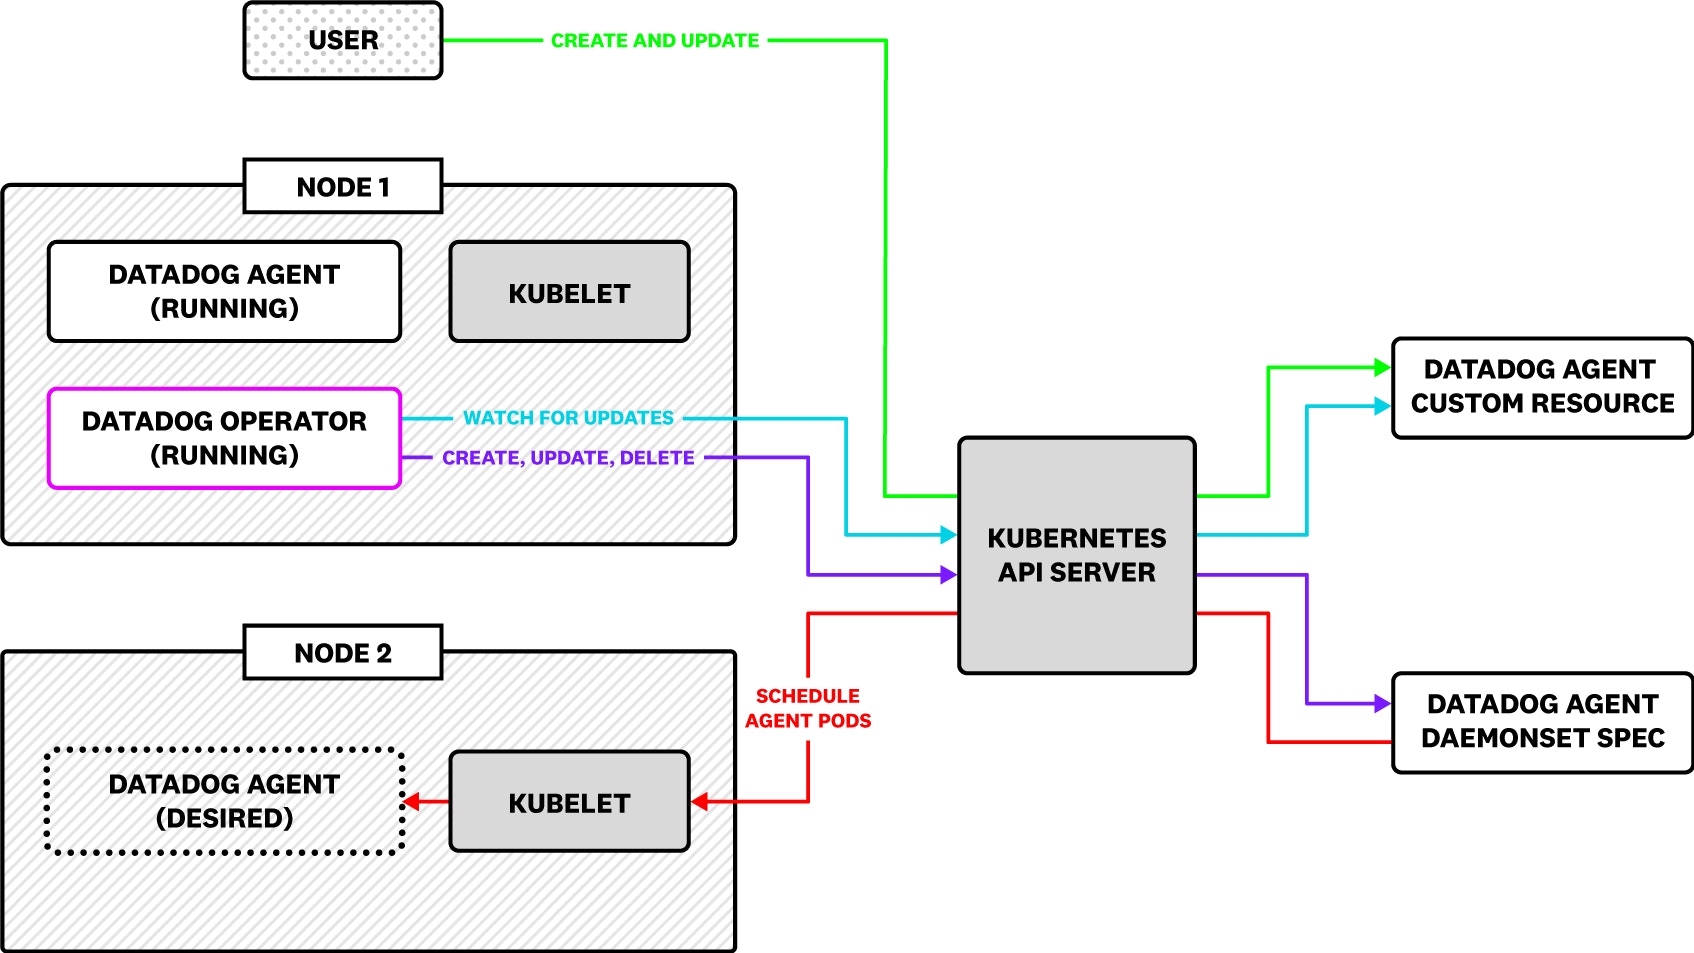
As more environments run on Kubernetes—including our own— Datadog has been making it easier to get visibility into clusters of any scale. To minimize load on the Kubernetes API server , the Datadog Agent runs in two different modes. The node-based Agent queries local containers or external endpoints for data, while the Cluster Agent fetches cluster-level metadata from the API server. You can also use the Cluster Agent to ensure that a single node-based Agent is querying an endpoint for data. (This is called a cluster check, and you can assign cluster checks to dedicated node-based Agents called Cluster Checks Runners.)
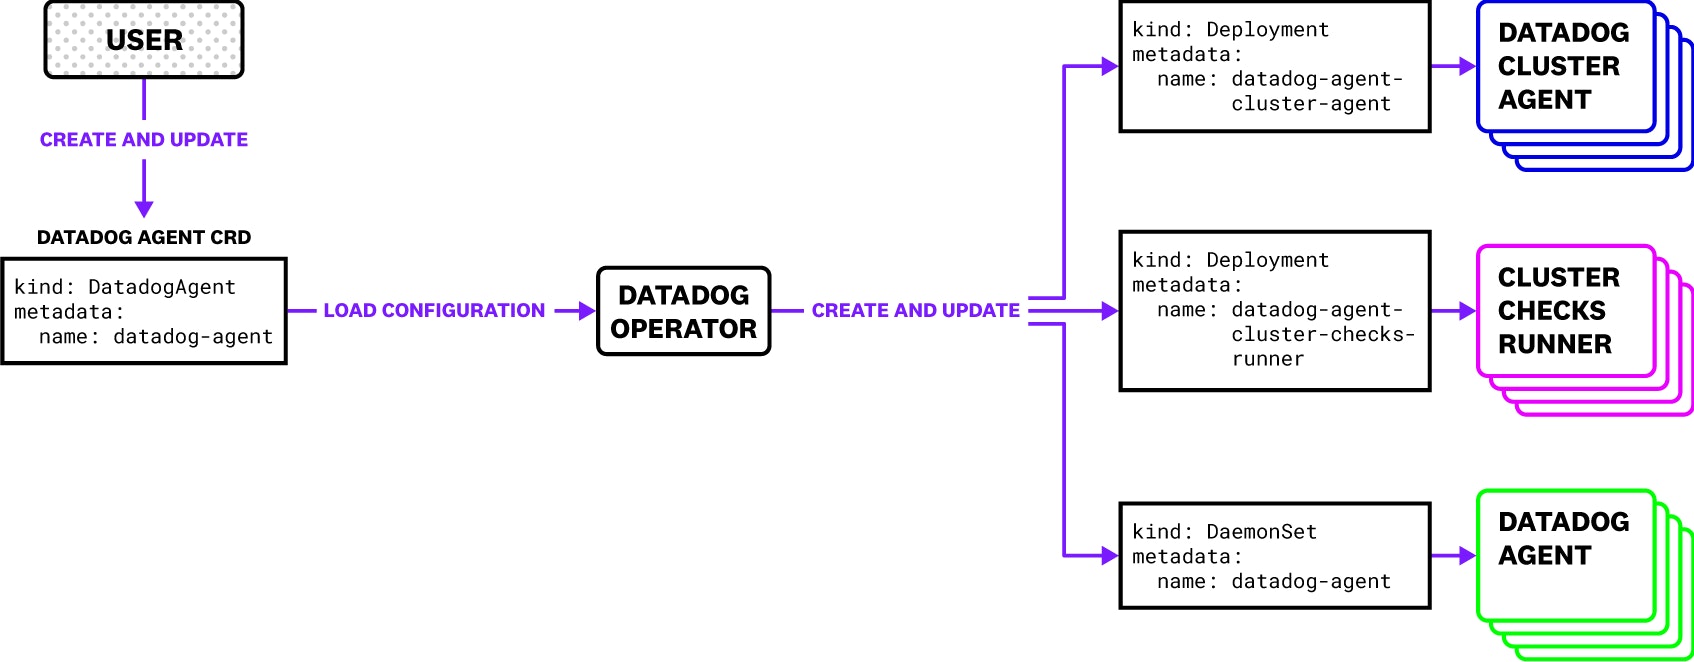
To make it even easier to monitor Kubernetes with Datadog, we introduced the Datadog Operator. With the Operator, you can use a single Kubernetes manifest to deploy the node-based Agent, Cluster Agent, and Cluster Checks Runners. We’re excited to announce the release of Datadog Operator version 0.2.0. Since the initial release, we’ve added support for the APM, Logs, and Process Agents, plus the System Probe to collect Network Performance Monitoring data. The latest Datadog Operator also submits metrics to help you track the status of each Agent (among other improvements).
The Operator automatically keeps Agents up to date with your configuration, and makes it straightforward to track the current status of each Agent. On top of that, the Datadog Operator has received Red Hat OpenShift Operator Certification, meaning that it has been tested to work with OpenShift and screened for security risks.
How the Datadog Operator works
In Kubernetes, an Operator is a design pattern for automating management tasks in your cluster. Operators track the state of custom resources against a desired state by periodically querying the Kubernetes API server—as a result, Operators are well suited for managing custom resources declaratively. While Helm charts are useful for deploying applications on Kubernetes in a reusable way (including our own chart for the Datadog Agent), Kubernetes Operators help you manage the state of your custom resources after deployment.
In the case of the Datadog Operator, you can apply a single Custom Resource Definition (CRD) to deploy the Datadog Agent, Cluster Agent, and cluster check runners. The Operator tracks the statuses of these resources, compares them to the desired statuses, and updates them accordingly. (Our example configurations show how to set up the Datadog Operator for common use cases.)
Configure Agents with ease
The Datadog Operator enables you to configure your Agents without worrying about the details of deploying them. If you change the configuration for any kind of Agent—for instance to use a newer container image, enable process monitoring, or configure an integration—the Operator keeps track of which Agents need to be updated, and applies changes accordingly.
As a result, the Datadog Agent CRD becomes a single source of truth for your entire Agent configuration, simplifying the process of monitoring your Kubernetes clusters. And because the Agent CRD uses Kubernetes’ built-in validation, you can make sure that your Agent configuration is properly formatted without manually checking Agent pods for issues.
By configuring all Datadog Agents with a single CRD, you can seamlessly enable the Cluster Checks Runners. This will allow Kubernetes to optimize the resource utilization of Datadog Agents in your cluster by scheduling Agents that monitor local containers separately from Agents that monitor cluster-level applications and external services.
Keep your Agents reporting
The Datadog Operator allows you to find out how many Agents are running in your cluster. You can run the following command to see the current status of the node-based Agent, Cluster Agent, and Cluster Checks Runners (a blank status message for one kind of Agent means that you have not enabled it yet):
$ kubectl get dd
NAME ACTIVE AGENT CLUSTER-AGENT CLUSTER-CHECKS-RUNNER AGEdatadog-agent True Running (4/4/4) Running (2/2/2) 38mThe response will show the status (e.g., Running, Updating, or Failed) of each kind of Agent launched in your cluster, followed by the counts of desired, ready, and up-to-date Kubernetes resources (e.g., (2/2/2)). For DaemonSets like the Datadog Agent, these are counts of nodes running the expected pod. For Deployments like the Cluster Agent and Cluster Checks Runners, these are counts of the pods themselves.
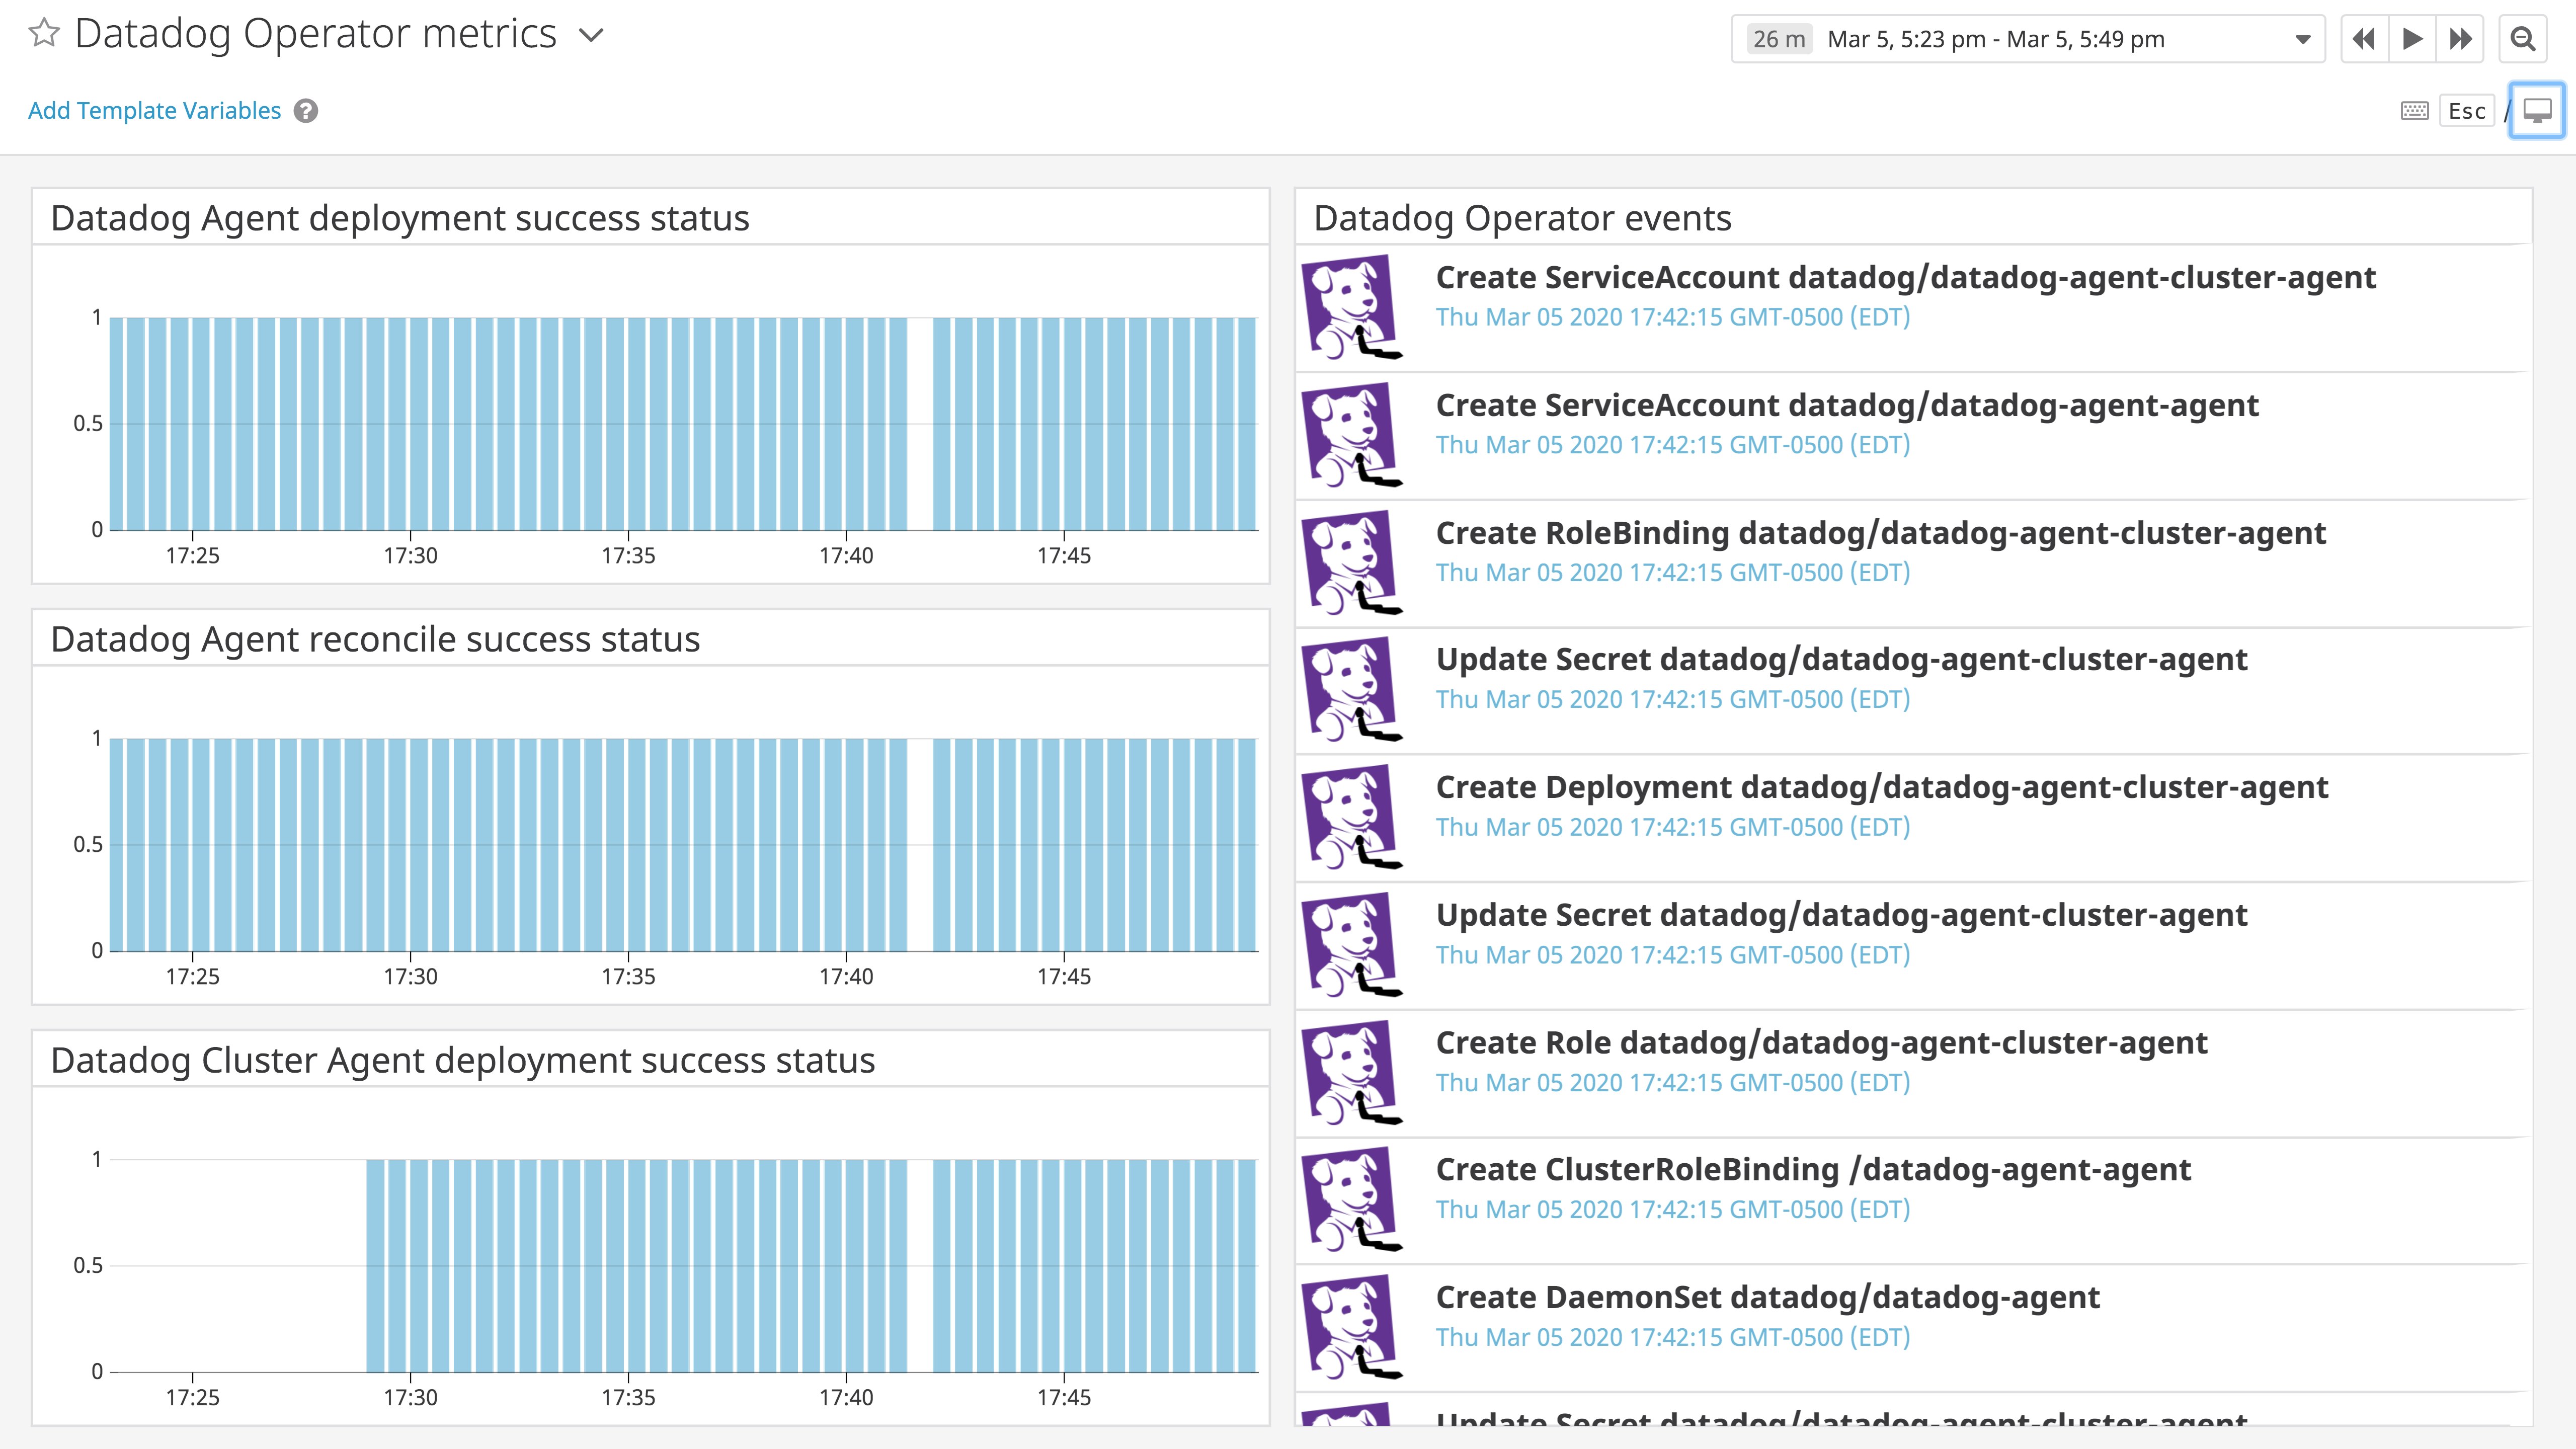
You can also track the status of each kind of Datadog Agent over time. The Datadog Operator sends metrics to Datadog indicating when all desired Agents, Cluster Agents, and Cluster Checks Runners have deployed, as well as when the Operator has finished reconciling the state of your cluster with your desired configuration. If you’re not seeing a constant value of “1” in the <AGENT_TYPE>.deployment.success or datadog.operator.reconcile.success metrics after changing your Agent configuration, you’ll know to examine your Kubernetes cluster for possible issues with running the Agent.
More agency for your monitoring
With the Datadog Operator, you can manage all of your Agents from one configuration file, making it even easier to collect data from your Kubernetes clusters. The Datadog Operator is open source, and we welcome your contributions. You can deploy the Datadog Operator by following our guide, installing it from OperatorHub.io, or using the Red Hat Ecosystem Catalog. If you are looking for a more powerful Kubernetes monitoring platform, but don’t yet have a Datadog account, sign up for a free trial.


