Mary Jac Heuman

Miranda Kapin
Being able to track and aggregate data by region is important when monitoring your application. It can provide visibility into where errors and latency might be occurring, where security threats might be originating, and more. Now, you can use Datadog geomaps to visualize data on a color-coded world map. This helps you understand geographic patterns at a glance, including where users are experiencing outages, app revenue by country, or if a surge in requests is coming from one particular location. This provides key business and application performance insights and also helps you make informed decisions about where to focus any troubleshooting efforts.
You can use geomaps to visualize your frontend metrics from Datadog RUM out of the box. You can also map data from any of your log and custom metrics that contain an attribute with a value in the standard country ISO code format. In this post, we’ll look at how you can use geomaps to visualize:
- RUM metrics to monitor frontend performance globally
- application log data for security insights
- log-based custom metrics to detect business patterns and guide development
Monitor worldwide user experience
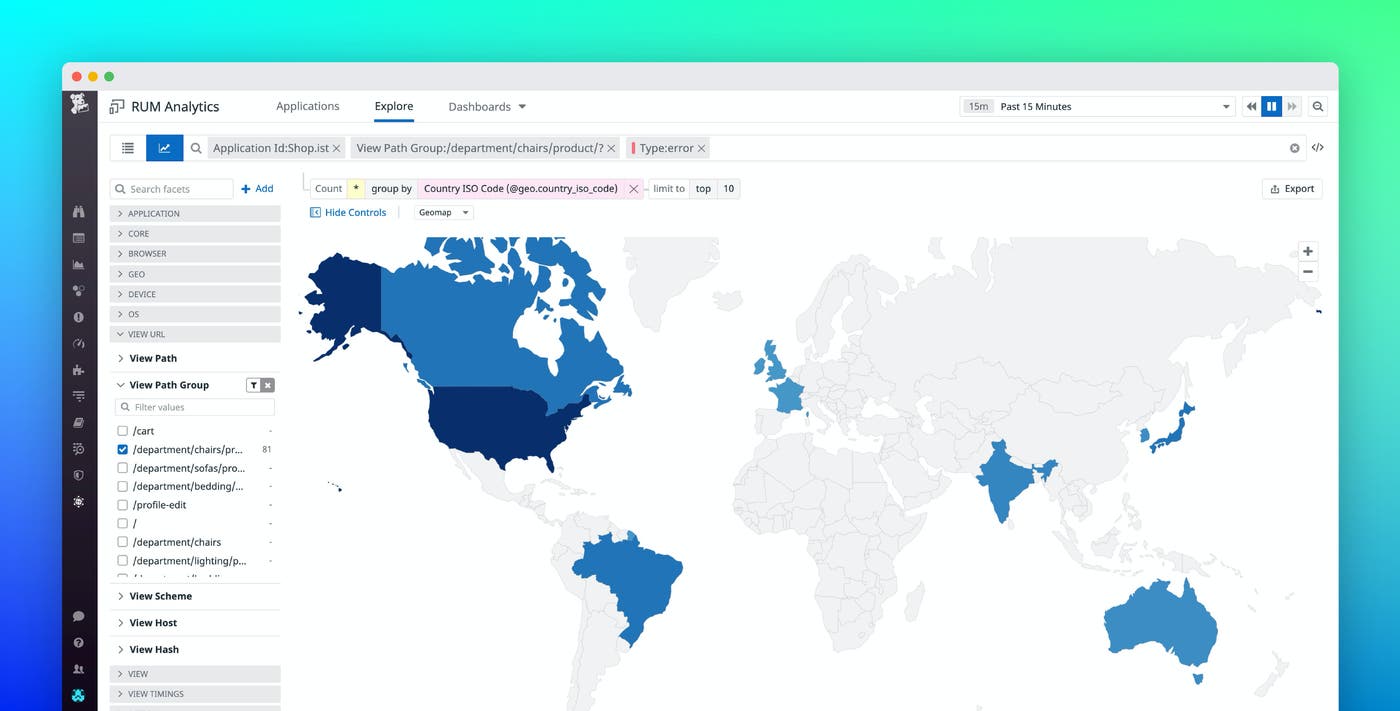
Geomaps are fully integrated with Datadog RUM, which means that you can use RUM Analytics to visualize frontend metrics, such as requests, latency, and errors, that impact user experience. Datadog automatically records the geographic location for all incoming RUM metrics, so you can group any RUM data by country ISO code (@geo.country_iso_code) to visualize it using a geomap.
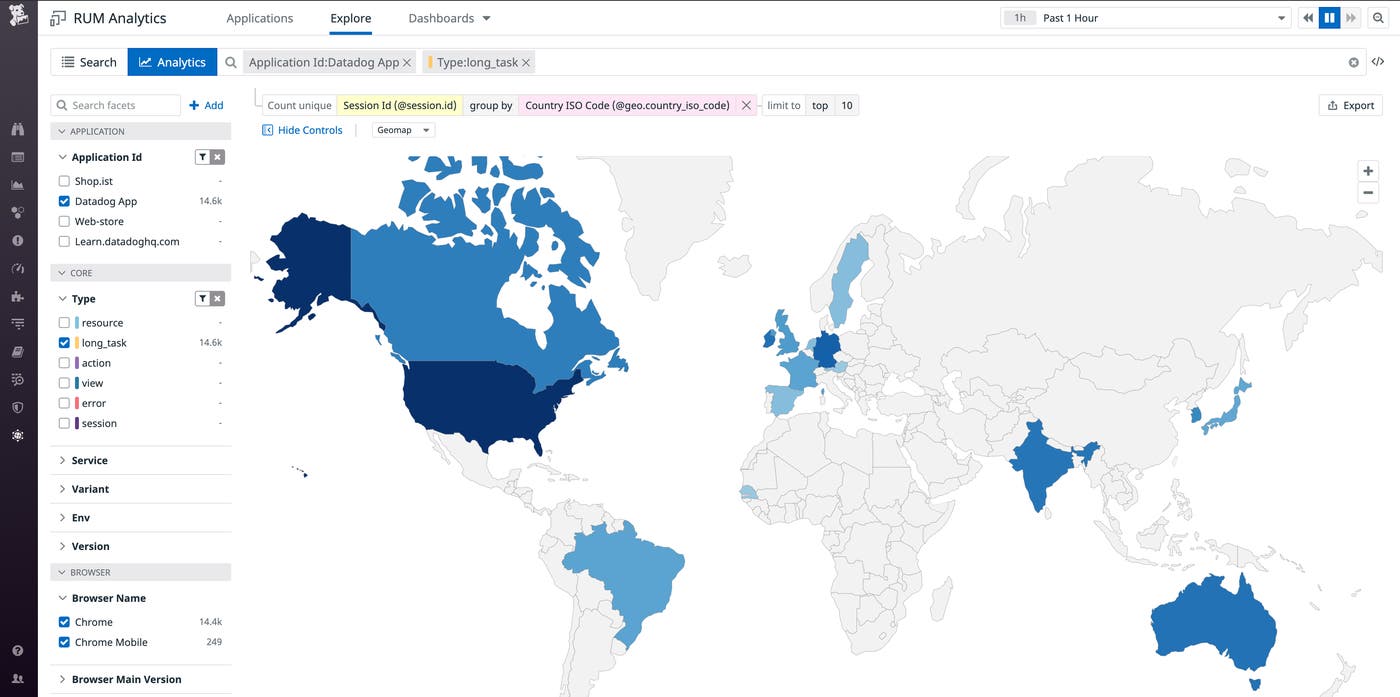
The below example shows the distribution of unique user sessions (@session_id) generating the most long_task events, which happen when a task blocks the main thread for at least 50 ms and could indicate high latency and degraded user experience.

Once you’ve identified the top countries with users experiencing long_tasks, you can dive deeper by examining the RUM events to see which services are showing slowdowns. At that point, you might consider allocating more resources to the servers handling those services in the regions experiencing issues. You can then export the map to one of your dashboards as a widget so you can monitor it, or use it to create an alert that will trigger, for example, if any users in a region experience too many long_tasks.
Get key security insights
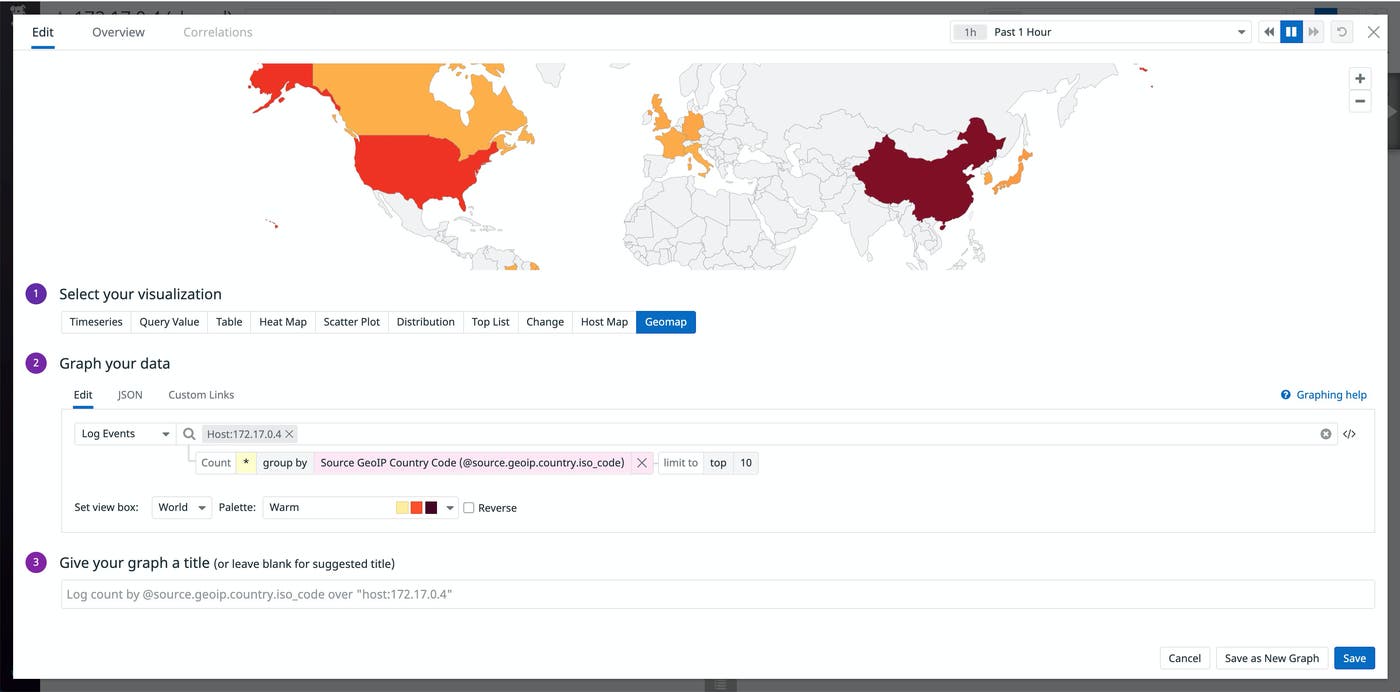
When monitoring for security threats, mapping log data can help you recognize patterns and detect unusual activity. You can add geomap widgets to your dashboards to visualize log events that have a country ISO code attribute. You can use Datadog’s GeoIP parser as part of a log processing pipeline to automatically parse out the appropriate country code based on a log’s IP address. Then, you’ll be able to group your logs by the country ISO code and visualize the data in a geomap.

This makes it easy, for example, to track the origin of incoming requests to private endpoints. If you notice requests coming from certain origins unfamiliar to your team, it could indicate an attack on your application.
Make maps to fit your needs
Generating custom metrics from your application logs lets you monitor and alert on key data that you can then visualize using a geomap for insight into geographic trends. For example, if you have an online store that logs the amount of each transaction, you could create a custom metric to track overall revenue. Using the GeoIP parser, you can extract out each transaction’s ISO country code. This makes it easy to use a geomap to visualize revenue by country, and helps drive business decisions based on regional patterns.
Visualize your data with geomaps today
Monitoring data based on geographic region is key to understanding patterns in your application’s behavior and usage, whether it’s to track user experience, look for potential security threats, or guide important business decisions. Datadog’s geomap visualization lets you easily parse country-specific data at a glance, so you can monitor and alert on it alongside data from more than 1,000 other technologies.
See our documentation to get started. Or, if you’re not yet signed up with Datadog, start your free trial today.


