
Bowen Chen

Vignesh Palaniappan

David Iparraguirre
If you’re a Datadog customer, you’re likely using our platform to gain visibility into your infrastructure and applications and to troubleshoot using logs, metrics, and traces when issues arise. To support these efforts, you’ll want access to the most granular telemetry signals and intuitive workflows that streamline your investigation.
The Datadog Agent is the key component that helps enable this level of visibility. The Agent expands beyond the monitoring capabilities of our integrations by collecting metrics at higher frequencies, storing them at higher resolution, and enriching the telemetry it collects. Agent-based monitoring also enables you to take advantage of features such as custom metrics that monitor data specific to your businesses and applications and correlated traces that can be used to accelerate your investigations. In this post, we’ll discuss these features, as well as how Datadog Fleet Automation can centrally simplify the installation, configuration, and management of your fleet of Agents across different platforms and deployment tools.
Collect more granular telemetry with the Datadog Agent
Agentless monitoring, such as collecting metrics only from cloud provider integrations, can help teams get up to speed with their base-level monitoring needs—but it often falls short when you need granular insights into your infrastructure, such as during outages or incidents that impact customers. Host metrics from major cloud providers are sampled at intervals anywhere from one to five minutes, depending on the service and configuration—for example, CloudWatch host metrics are averaged over five minutes by default. This relatively long time interval can create gaps in monitoring and slow down your team’s time to respond when they receive metric-based alerts. For instance, resource spikes that last a few minutes but then briefly recover may get averaged out across the five-minute sampling intervals and delay your monitors in notifying the appropriate response team.
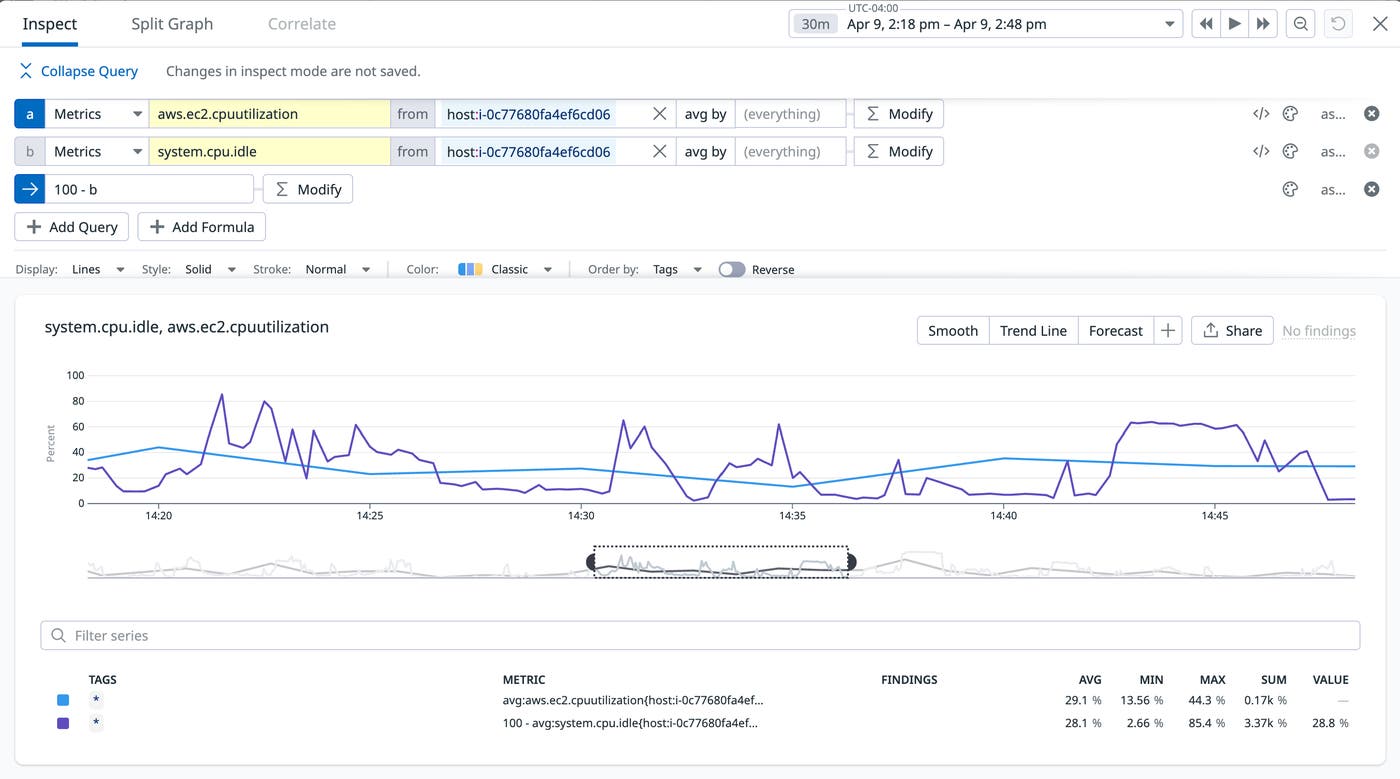
A lack of highly granular metrics can also slow down your broader incident response effort. For example, if you scale up a resource you believe is bottlenecking a customer request path, it may take longer for responders to verify that these changes are effective because your latency and error metrics are averaged over longer timeframes. In comparison to cloud provider integrations, Datadog stores all metrics at one-second resolution, and the Datadog Agent samples host metrics at 15-second intervals, so you can receive insights into your hosts more frequently and at a more granular level.
If Datadog is unable to connect to your cloud provider’s API, you may experience gaps in metrics for certain high-resolution and real-time data. This can result in false-positive or false-negative monitor evaluations—which can create alert fatigue on the one hand or fail to alert your responders to real outages on the other—as well as incorrect SLOs, since Datadog will perceive the gaps as service downtime. However, when you install the Agent, your hosts are protected against network issues via the Agent’s built-in support for data buffering. For example, if your network becomes unavailable, the Agent will store collected metrics in memory and once your network is restored, the Agent will send the stored data to the Datadog platform, preventing any loss of granular telemetry. We recommend that you take advantage of these Agent benefits alongside your current usage of cloud provider integrations so you can continue to inherit cloud provider tags and help Datadog automatically detect new resources, such as hosts that have yet to be configured with the Agent.
Correlate telemetry across different data types
The Agent automatically tags telemetry with unified service tags so you can group telemetry by service, environment, and version without any configuration required. This enables you to quickly configure dashboards and monitors to visualize and alert on the health and performance of individual services, troubleshoot new code deployments using version tags, and drill into your hosts’ resource utilization across environments and availability zones.
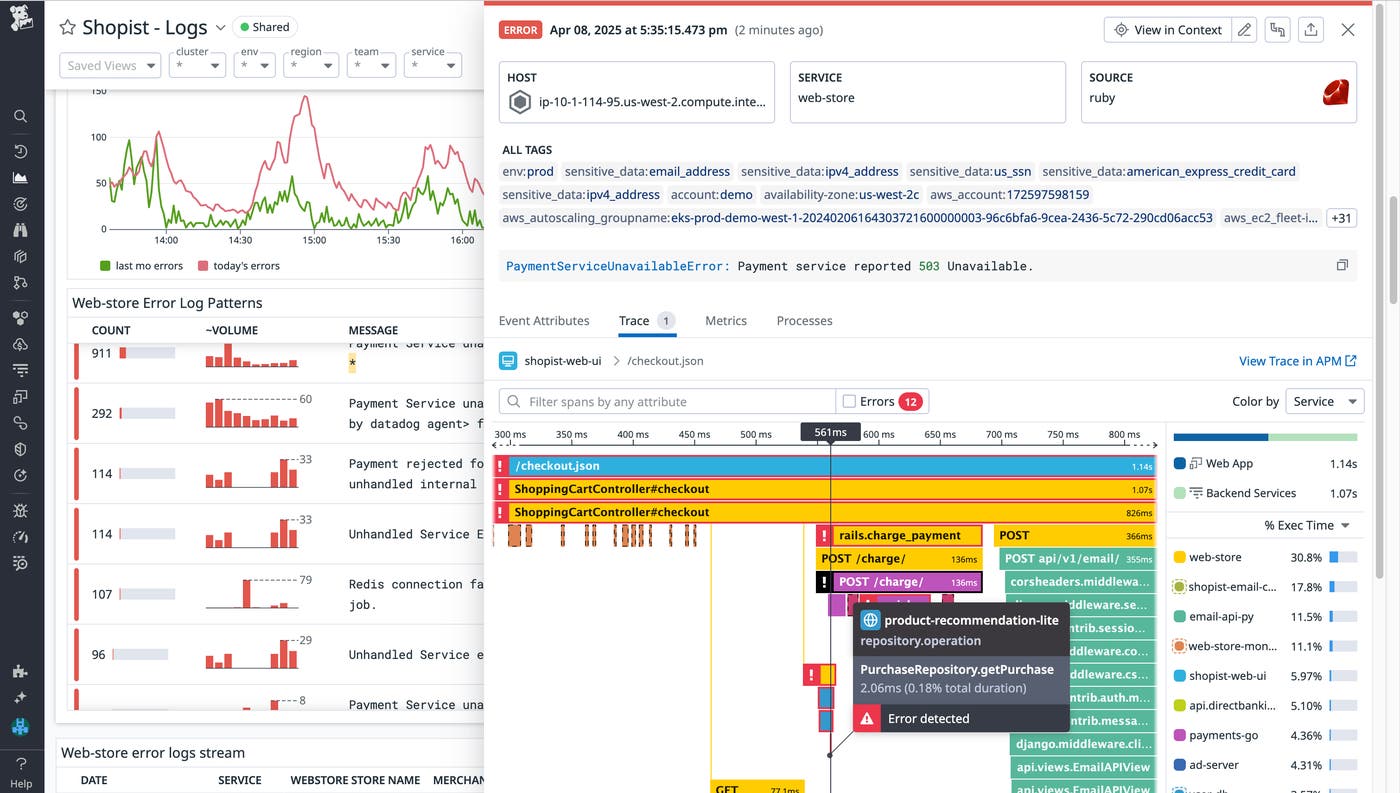
In addition, when you enable Datadog APM, the Agent will automatically inject trace IDs into your logs and metrics, enabling you to correlate different telemetry types to assist in your investigations. For example, if you notice error logs on a dashboard configured to monitor your web application, you can inspect the error log to view a correlated trace within the same window, giving you more context into why the server error is occurring without having to rebuild your query in a separate trace explorer. In the example below, we’re able to trace a 503 error returned by our web store’s payment service to the PurchaseRepository.getPurchase() function using the trace correlated to the error log.
Collect Custom metrics
The Agent offers over 180 available integrations, including Redis, Apache, and MySQL, that automatically collect key metrics, such as cache memory usage, web server request rates, and database query transactions. However, you may want custom metrics that cater to your specific applications. The Agent makes this possible via DogStatsD. You can quickly install DogStatsD in your clients using a package manager and instantiate it with only a few lines of code. You can then configure DogStatsD to collect custom metrics like counts, rates, gauges, histograms and distributions. Consider the following example, in which you are running a web store that collects payments using Stripe. Using the code snippet below, you can create a custom metric that monitors when a customer checkout using Stripe fails. This also enables you to create monitors that alert on this metric, so responders can quickly address this issue before failed checkout conversions begin to accumulate and impact your business income.
statsd.increment('Shopist.transactions.failed', tags=["env:prod", "payment_provider:stripe"])While you can submit custom metrics to Datadog via the HTTP API, DogStatsD presents a more resource-efficient method—especially for high-frequency applications—by consuming less CPU. The Agent will also automatically group metrics before sending them to Datadog as opposed to submitting metrics via API, which requires you to manually batch or aggregate data to avoid hitting rate limits. You can learn more about the different ways to send custom metrics to Datadog in our documentation.
Easily install, manage, and configure the Datadog Agent
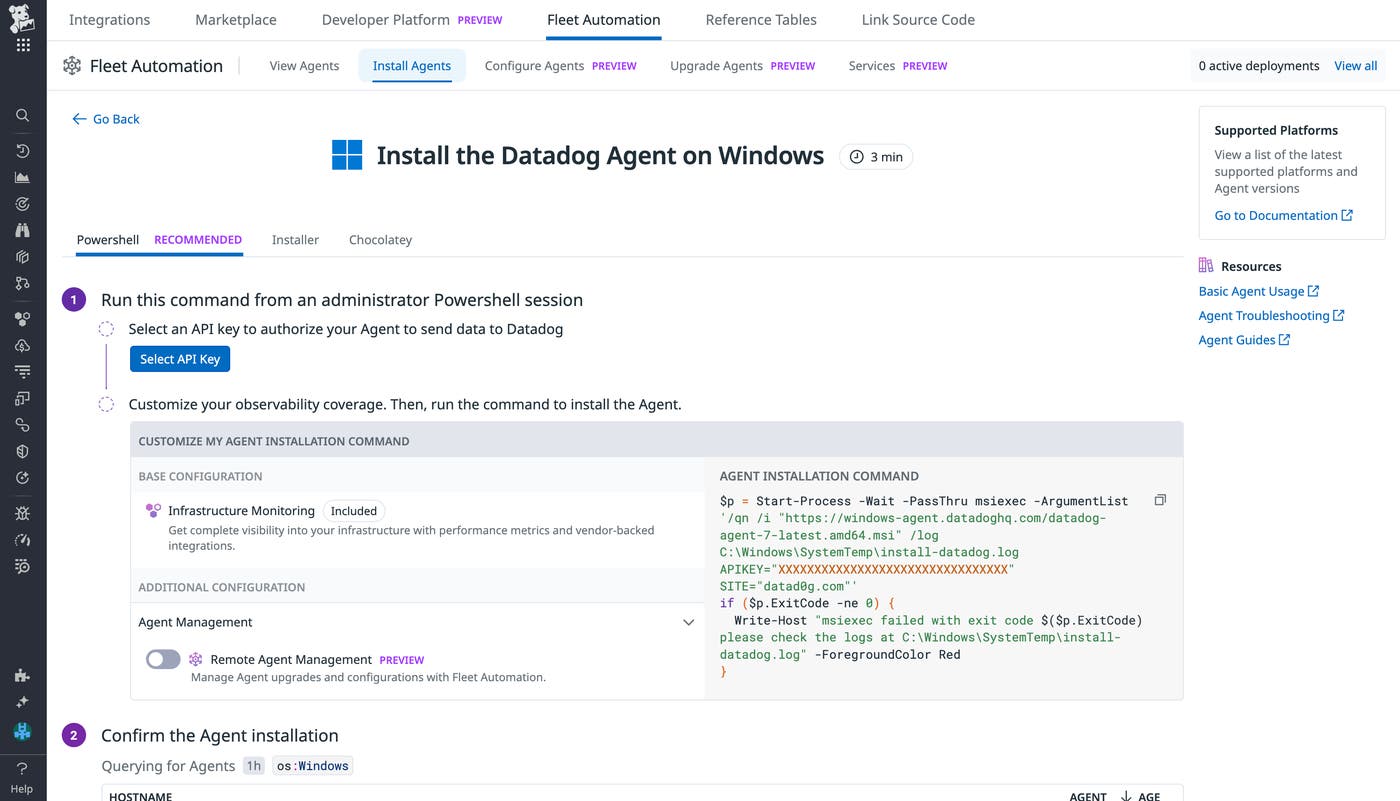
Installing the Datadog Agent is now easier than ever by following our in-app instructions found in the Agent Installation Page. The app provides step-by-step setup instructions based on your infrastructure and preferred deployment tooling, eliminating any guesswork involved if you’re new to the installation process. You can select additional Agent configurations you’d like to set up at install time—such as APM instrumentation, Cloud Security, Network Performance Monitoring, and more—and Datadog will automatically adjust the installation command to include these changes. After you’ve run the installation instructions, newly detected Agents will be immediately visible within the installation page, enabling you to verify that the installation was successful.
Installing the Agent at scale
Datadog supports Agent installation at scale through different methods, depending on your tech stack. For containerized environments, you can use the Datadog Operator or our Helm charts to install the Agent as a Kubernetes DaemonSet that runs on all nodes within your cluster. This ensures that every new node that is spun up in your cluster—whether this is done manually or via autoscaling—will automatically run the Datadog Agent. Your Agent configuration is centrally defined, whether it’s via the Datadog Operator’s Custom Resource Definition or the Helm chart’s values.yaml file, so each node’s Agent maintains functional parity.
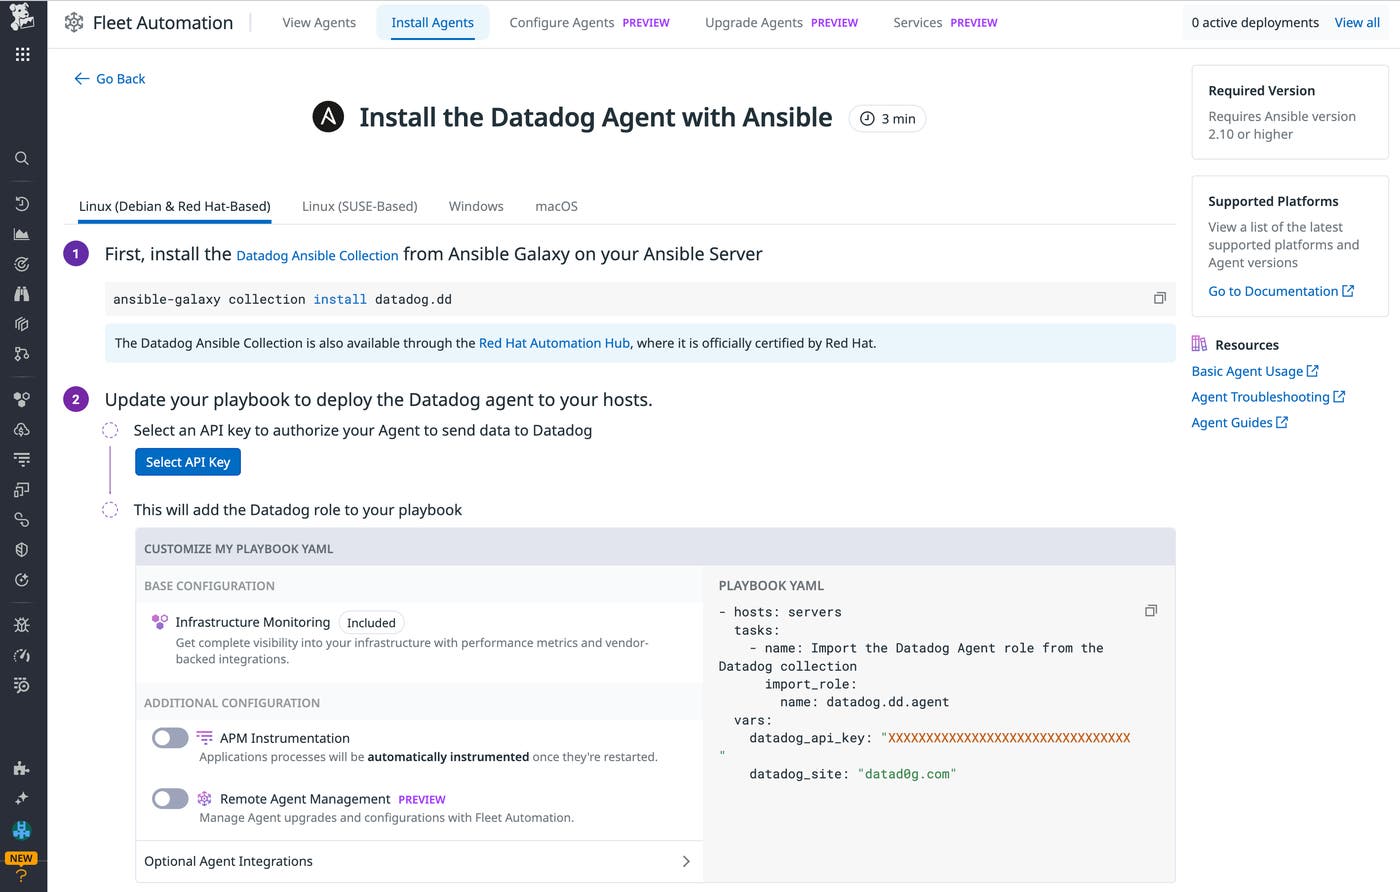
For non-containerized environments, you can also install the Datadog Agent at scale on your virtual machines (VMs) and physical hosts using configuration management tools such as Ansible, Chef, or Puppet or by running our install script. After you provision VMs, your configuration management tool will connect to these VMs and install agents, applications, and runtime dependencies that your VMs need. By using the Ansible role for the Datadog Agent, you can automate agent installation across different teams and environments and ensure that each new VM is created with the correct Agent settings. You can learn more about automating Agent installation with Ansible in this blog post.
Alternatively, if your organization relies on cloud providers such as AWS and Azure to provision hosts, you can take advantage of tools such as AWS Systems Manager (SSM), Microsoft Arc, and EC2 Image Builder to easily install the Datadog Agent on cloud-provided hosts. Our offerings for AWS SSM and Microsoft Arc provide a one-click workflow for you to deploy the Datadog Agent on AWS Azure hosts, while our EC2 Image Builder component for the Datadog Agent enables you to build a custom Amazon Machine Image with the Agent pre-installed.
Management and configuration
Once the Agent is installed on your hosts, you need an efficient workflow to manage its configuration and uniformly apply updates across services and environments.
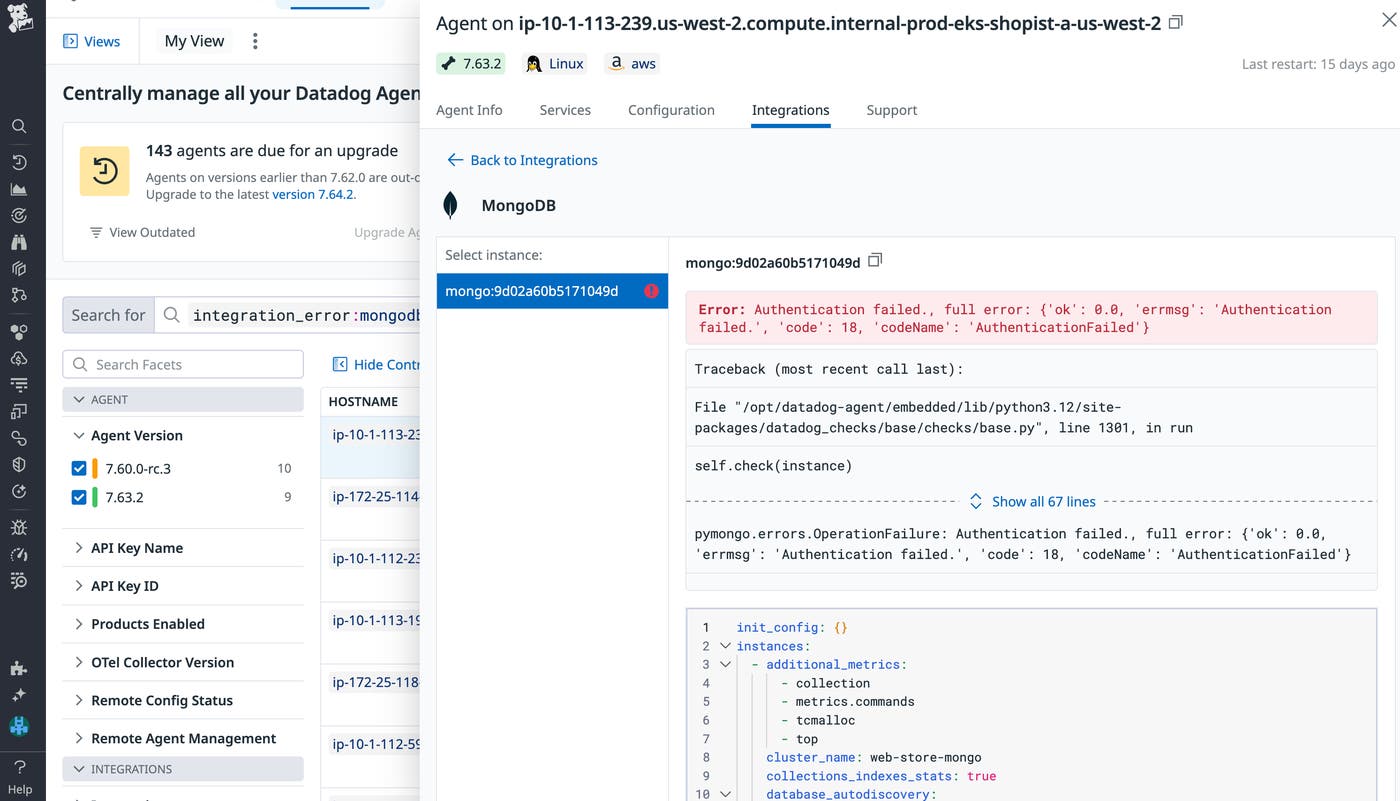
Datadog Fleet Automation gives you a centralized view into all of your Datadog Agents and helps you quickly identify outdated Agent versions, Agents reporting integration issues, and hosts without an Agent. If you’re planning to transition to Agent-based monitoring, Fleet Automation is an invaluable tool to help you verify and troubleshoot Agent behaviors, as well as identify gaps in observability coverage. By inspecting an Agent, you can gain more context into the Datadog features it has installed, view its active Agent configurations to confirm changes in your deployment, and validate that its API key is secure and up-to-date. In the example below, Fleet Automation highlighted several Agents reporting issues with their MongoDB integration. By filtering our Agents to those experiencing these integration issues, we can then inspect them for a full traceback that gives us context into why the integration failed.
Traditionally, if you’re planning on upgrading your Agent to a new version, you’ll need to update host permissions, rerun the Agent installation script, reconfigure your configuration management tool, and other variable checks to make sure the versioning is consistent. However, with Remote Agent Management (available in Preview), you can upgrade and configure your Agents across all environments directly within the Datadog platform. From Fleet Automation, you can also create and deploy configurations to your fleet of Agents scoped by tags and host information. For example, in the screenshot below, we’ve enabled APM, processes, and logs for all Agents that are installed on hosts tagged with environment: dev.
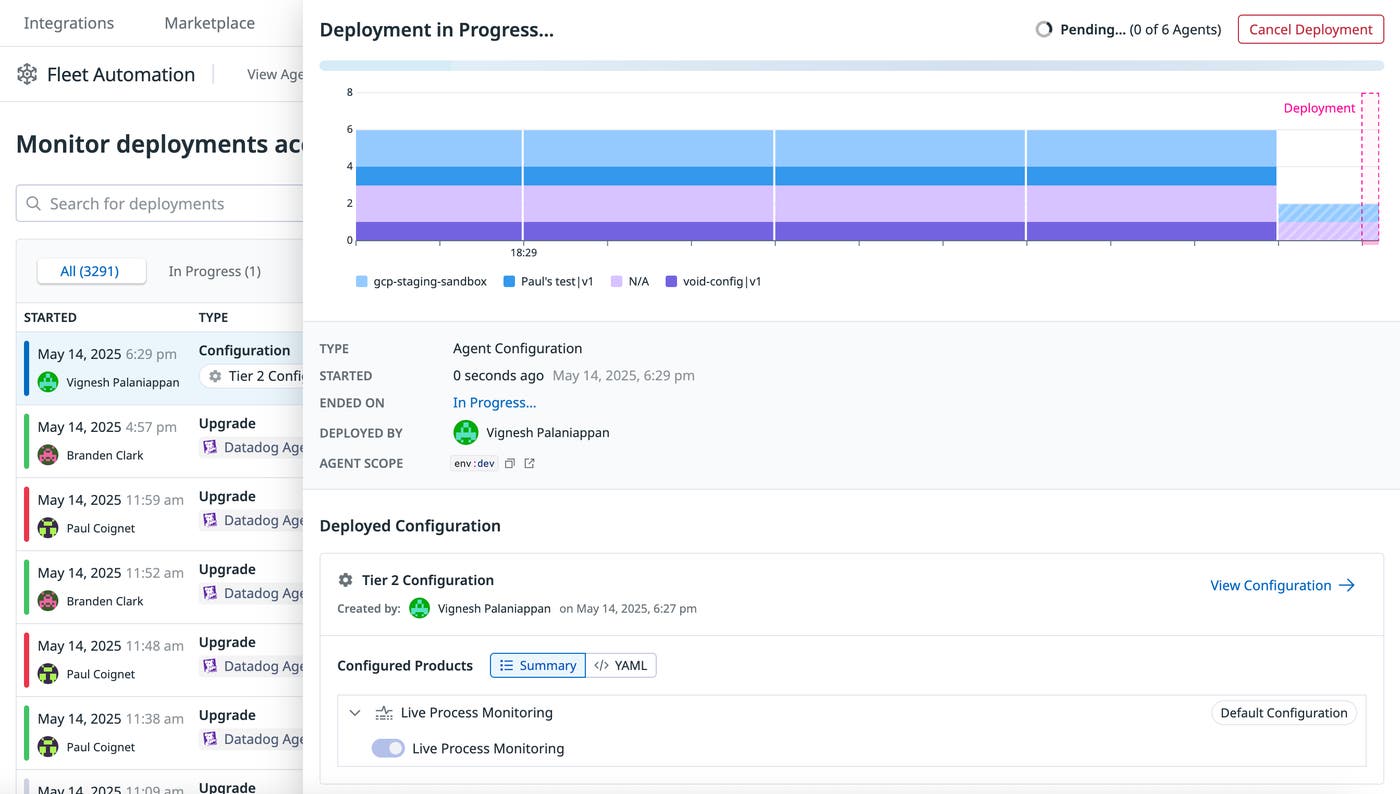
Managing your Agents from the same central platform where you visualize your telemetry removes an additional layer of management complexity, and it can also provide visual confirmation of whether upgrades and changes to your Agent configuration were successfully completed or applied. With Audit Trail you can also view historical changes to Agent configurations (including information on who made each change), API keys, Agent installs, and upgrades made across your fleet of Agents. This reduces the number of tools your developers need to manage, ensures that changes to your Agent configuration and versioning are uniformly applied across different platforms and environments, and enables you to quickly identify and address gaps in observability by easily setting up Datadog products and integrations.
Is the Agent and the data it collects secure?
Our engineering and security teams go to extreme lengths to make sure that the Agent application is secure, as is the data it collects and sends to the Datadog platform. Our solutions—including the design of the Datadog Agent—are compliant with all industry-standard benchmarks and frameworks. If your organization is required to comply with Federal Information Processing Standards (FIPS), consider adopting the Datadog FIPS Agent, which is natively compliant with FIPS and bypasses the use of a FIPS proxy. If your organization needs to comply with regulatory frameworks that require sensitive data to be scrubbed before it leaves your premises, you can also use Datadog Observability Pipelines to redact sensitive log data on-premises before sending telemetry to downstream locations like Datadog.
In terms of data security, the Datadog Agent submits data it collects to the Datadog platform via TLS-encrypted TCP connections by default. Newer versions of the Agent can be configured to require a minimum version of TLS to support the use of strong cryptography if you have more strict security requirements. Traffic will always be initiated by the Datadog Agent to the Datadog platform; the Datadog platform will never initiate a network session back to the Agent. If you would like to inspect the Agent’s implementation in greater detail, you can view its source code in the Agent’s public GitHub repository.
Get started with Agent-based monitoring
The Agent is the key feature to enhancing your visibility into your systems, and it’s easier than ever to install using our in-app installation walkthroughs. If you encounter issues with the Agent following installation, you can send a flare from the Datadog app that will automatically gather all of your Agent’s configuration files and logs (while removing sensitive information) and send it to our support team for troubleshooting. If you are currently instrumenting your applications with OpenTelemetry (OTel) or use the OTLP ingestion in the Datadog Agent, you can benefit from the expanded support we offer through the the Datadog Distribution of the OTel Collector (DDOT Collector). You can learn more about how the DDOT Collector provides comprehensive interoperability in our blog post.
If you don’t already have a Datadog account, sign up for a free 14-day trial today.

