Nicholas Thomson

Ryan Warrier
Running data processing workloads successfully and efficiently requires careful job management—whether tuning performance, tracking failures, optimizing query logic, or managing costs. Historically, teams also had to handle infrastructure decisions like cluster size and runtime configuration, all of which impacted execution time and reliability. To reduce friction and accelerate iteration, Databricks now offers serverless compute for workflows, which has seen significant adoption. Many teams are migrating their Databricks workloads to serverless for improved performance, fast start-up times, and cost saving.
But even with the adoption of serverless, the challenges of job management remain: Jobs can still fail, queries can still be suboptimal, and costs can still creep. For serverless jobs, you still need to track things like job execution, efficiency, and failures so you can understand where latency, errors, and costs are coming from.
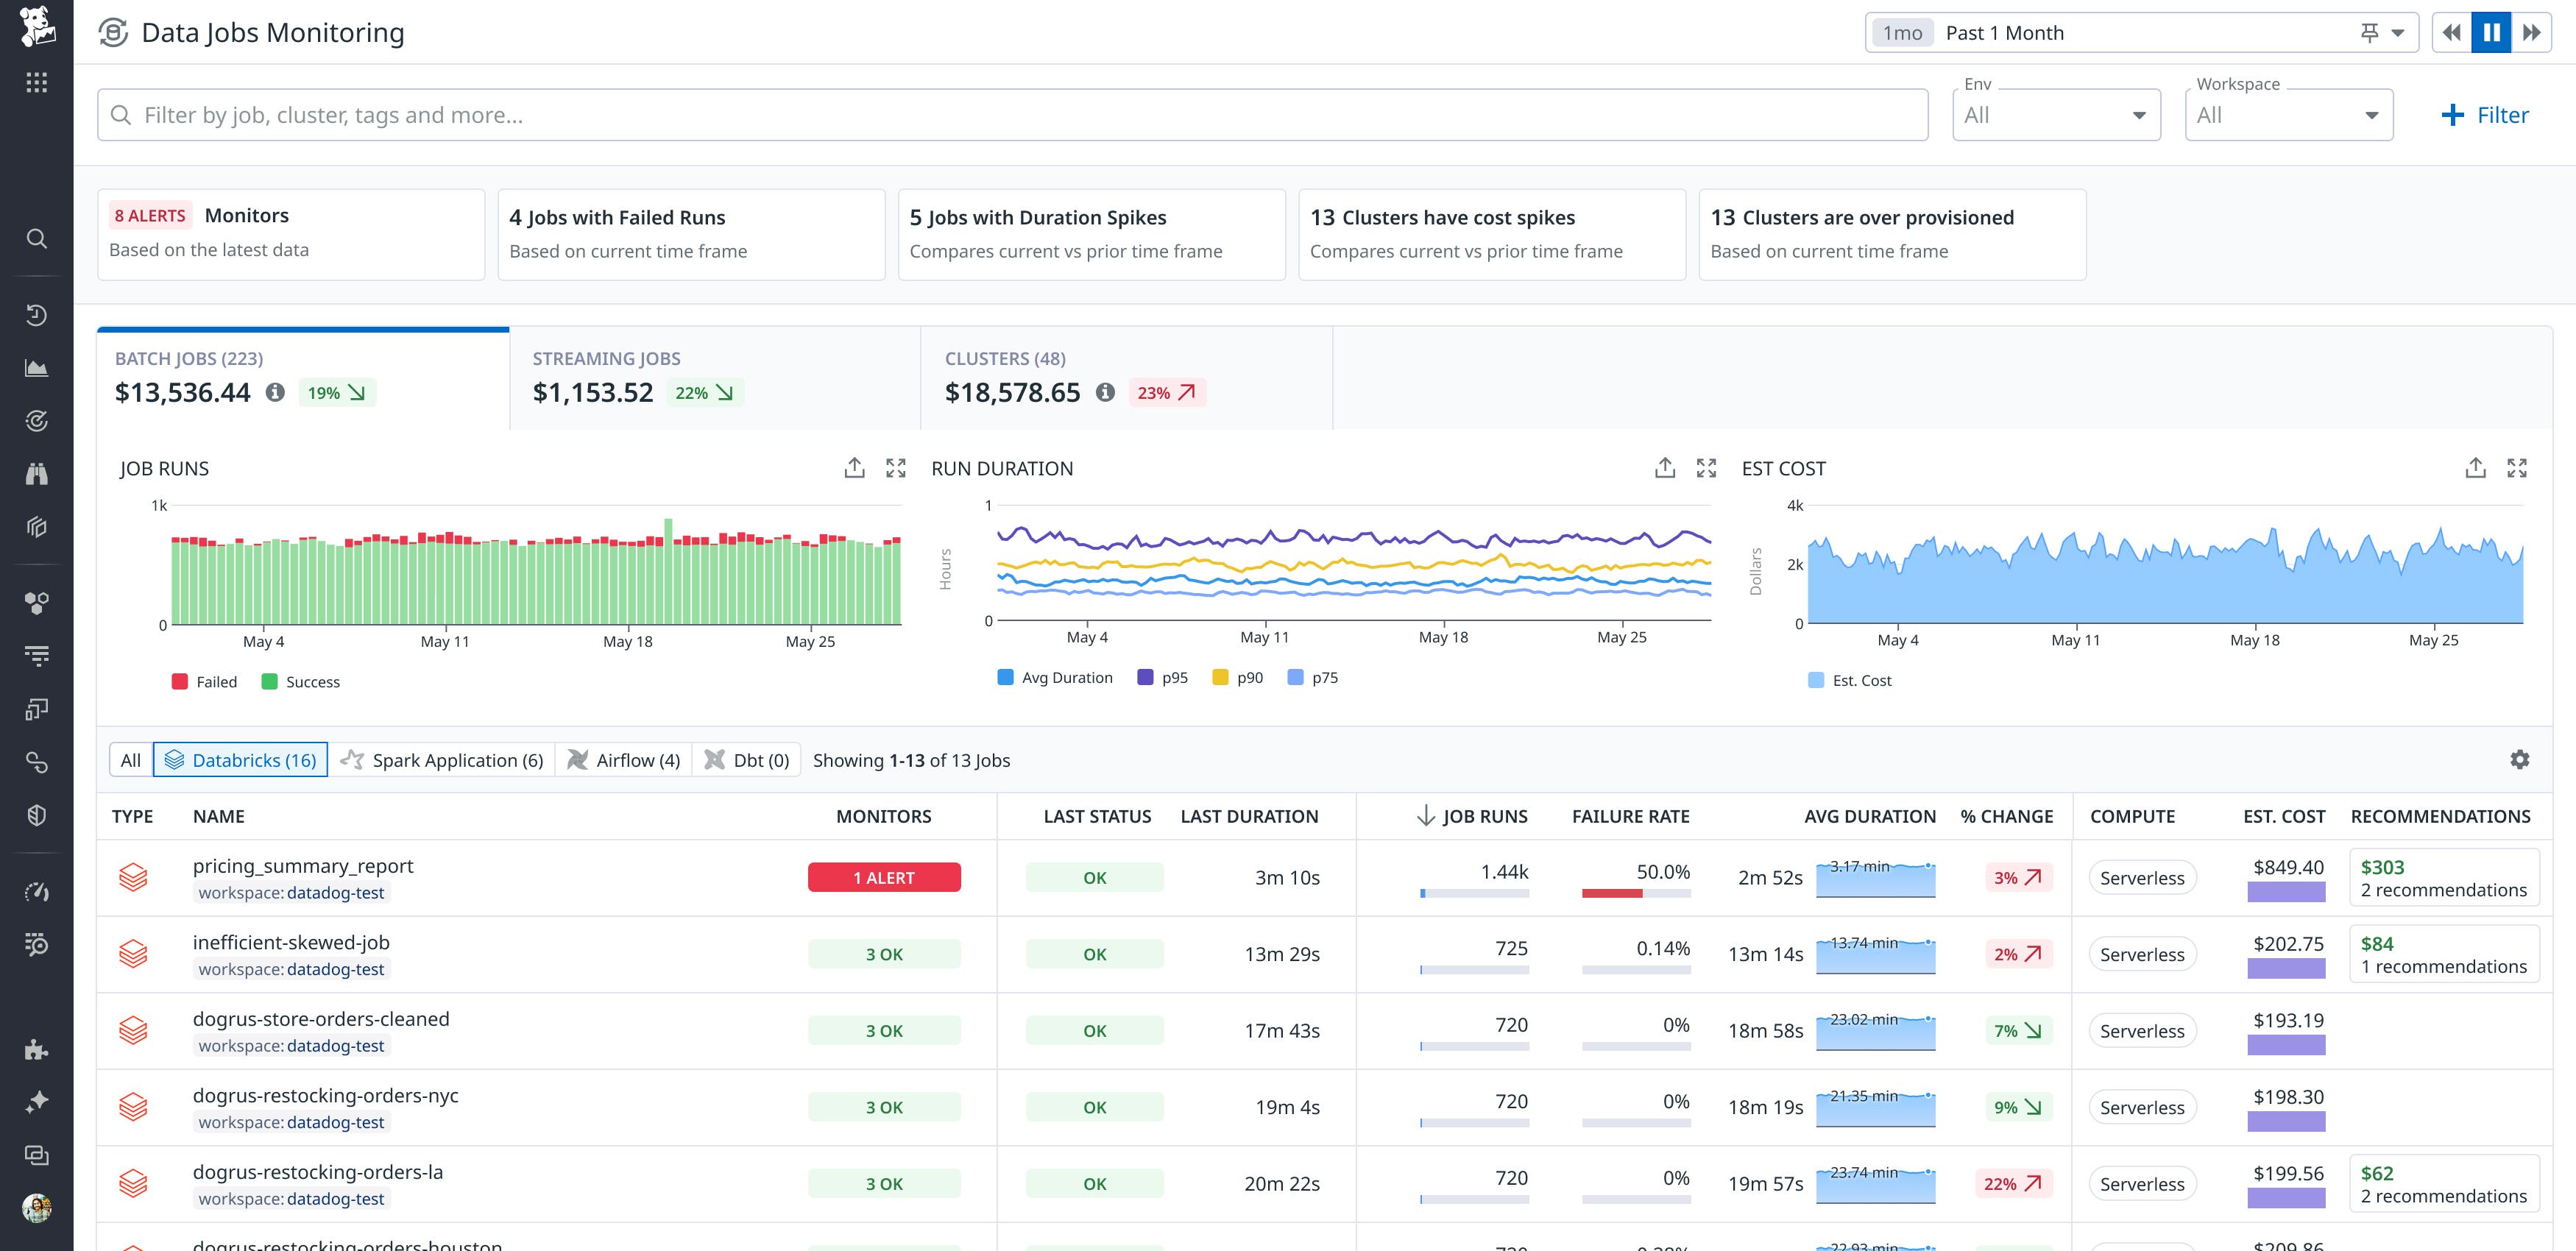
Datadog now enables you to monitor your serverless Databricks jobs in Data Jobs Monitoring (DJM) alongside the rest of your jobs running on Databricks clusters. This functionality is available for jobs running on Databricks serverless compute, as well as serverless SQL warehouses.
In this post, we’ll show you how to use this feature to:
Detect and alert on issues
Support for Databricks serverless jobs in DJM enables users to set alerts on failing and long-running jobs, helping teams ensure serverless jobs meet service level objectives (SLOs). For example, say you’re a data engineer at an ecommerce company. Your team is migrating daily ETL pipelines from Databricks clusters to serverless jobs to reduce cost and simplify scaling. Using DJM, you can set alerts to detect job failures and unexpected duration spikes. This allows the team to track SLOs like “production jobs complete in under 10 minutes 95 percent of the time” and quickly compare serverless performance against previous cluster-based runs—helping maintain reliability during the transition.
You can also use Datadog to alert on the freshness of important data produced by your Databricks serverless jobs. For example, say you’re a data engineer that uses Databricks serverless jobs to update a critical daily_transactions table used in executive dashboards. To ensure this data is always fresh by 6:00 a.m., you use DJM to monitor the success and duration of the job responsible for populating that table. You configure a Datadog monitor that triggers if the job hasn’t completed successfully by 5:55 a.m. This allows you to proactively catch freshness issues—whether caused by job failures, delays, or upstream pipeline problems—before stakeholders start their day.

Optimize your jobs down to the query level
Visibility into your Databricks serverless jobs in DJM enables you to evaluate trends in cost and spikes in usage so you can optimize your spend. DJM collects the Databricks Unit (DBU) costs for your serverless jobs from Databricks system tables and displays this information in context with other job performance data.
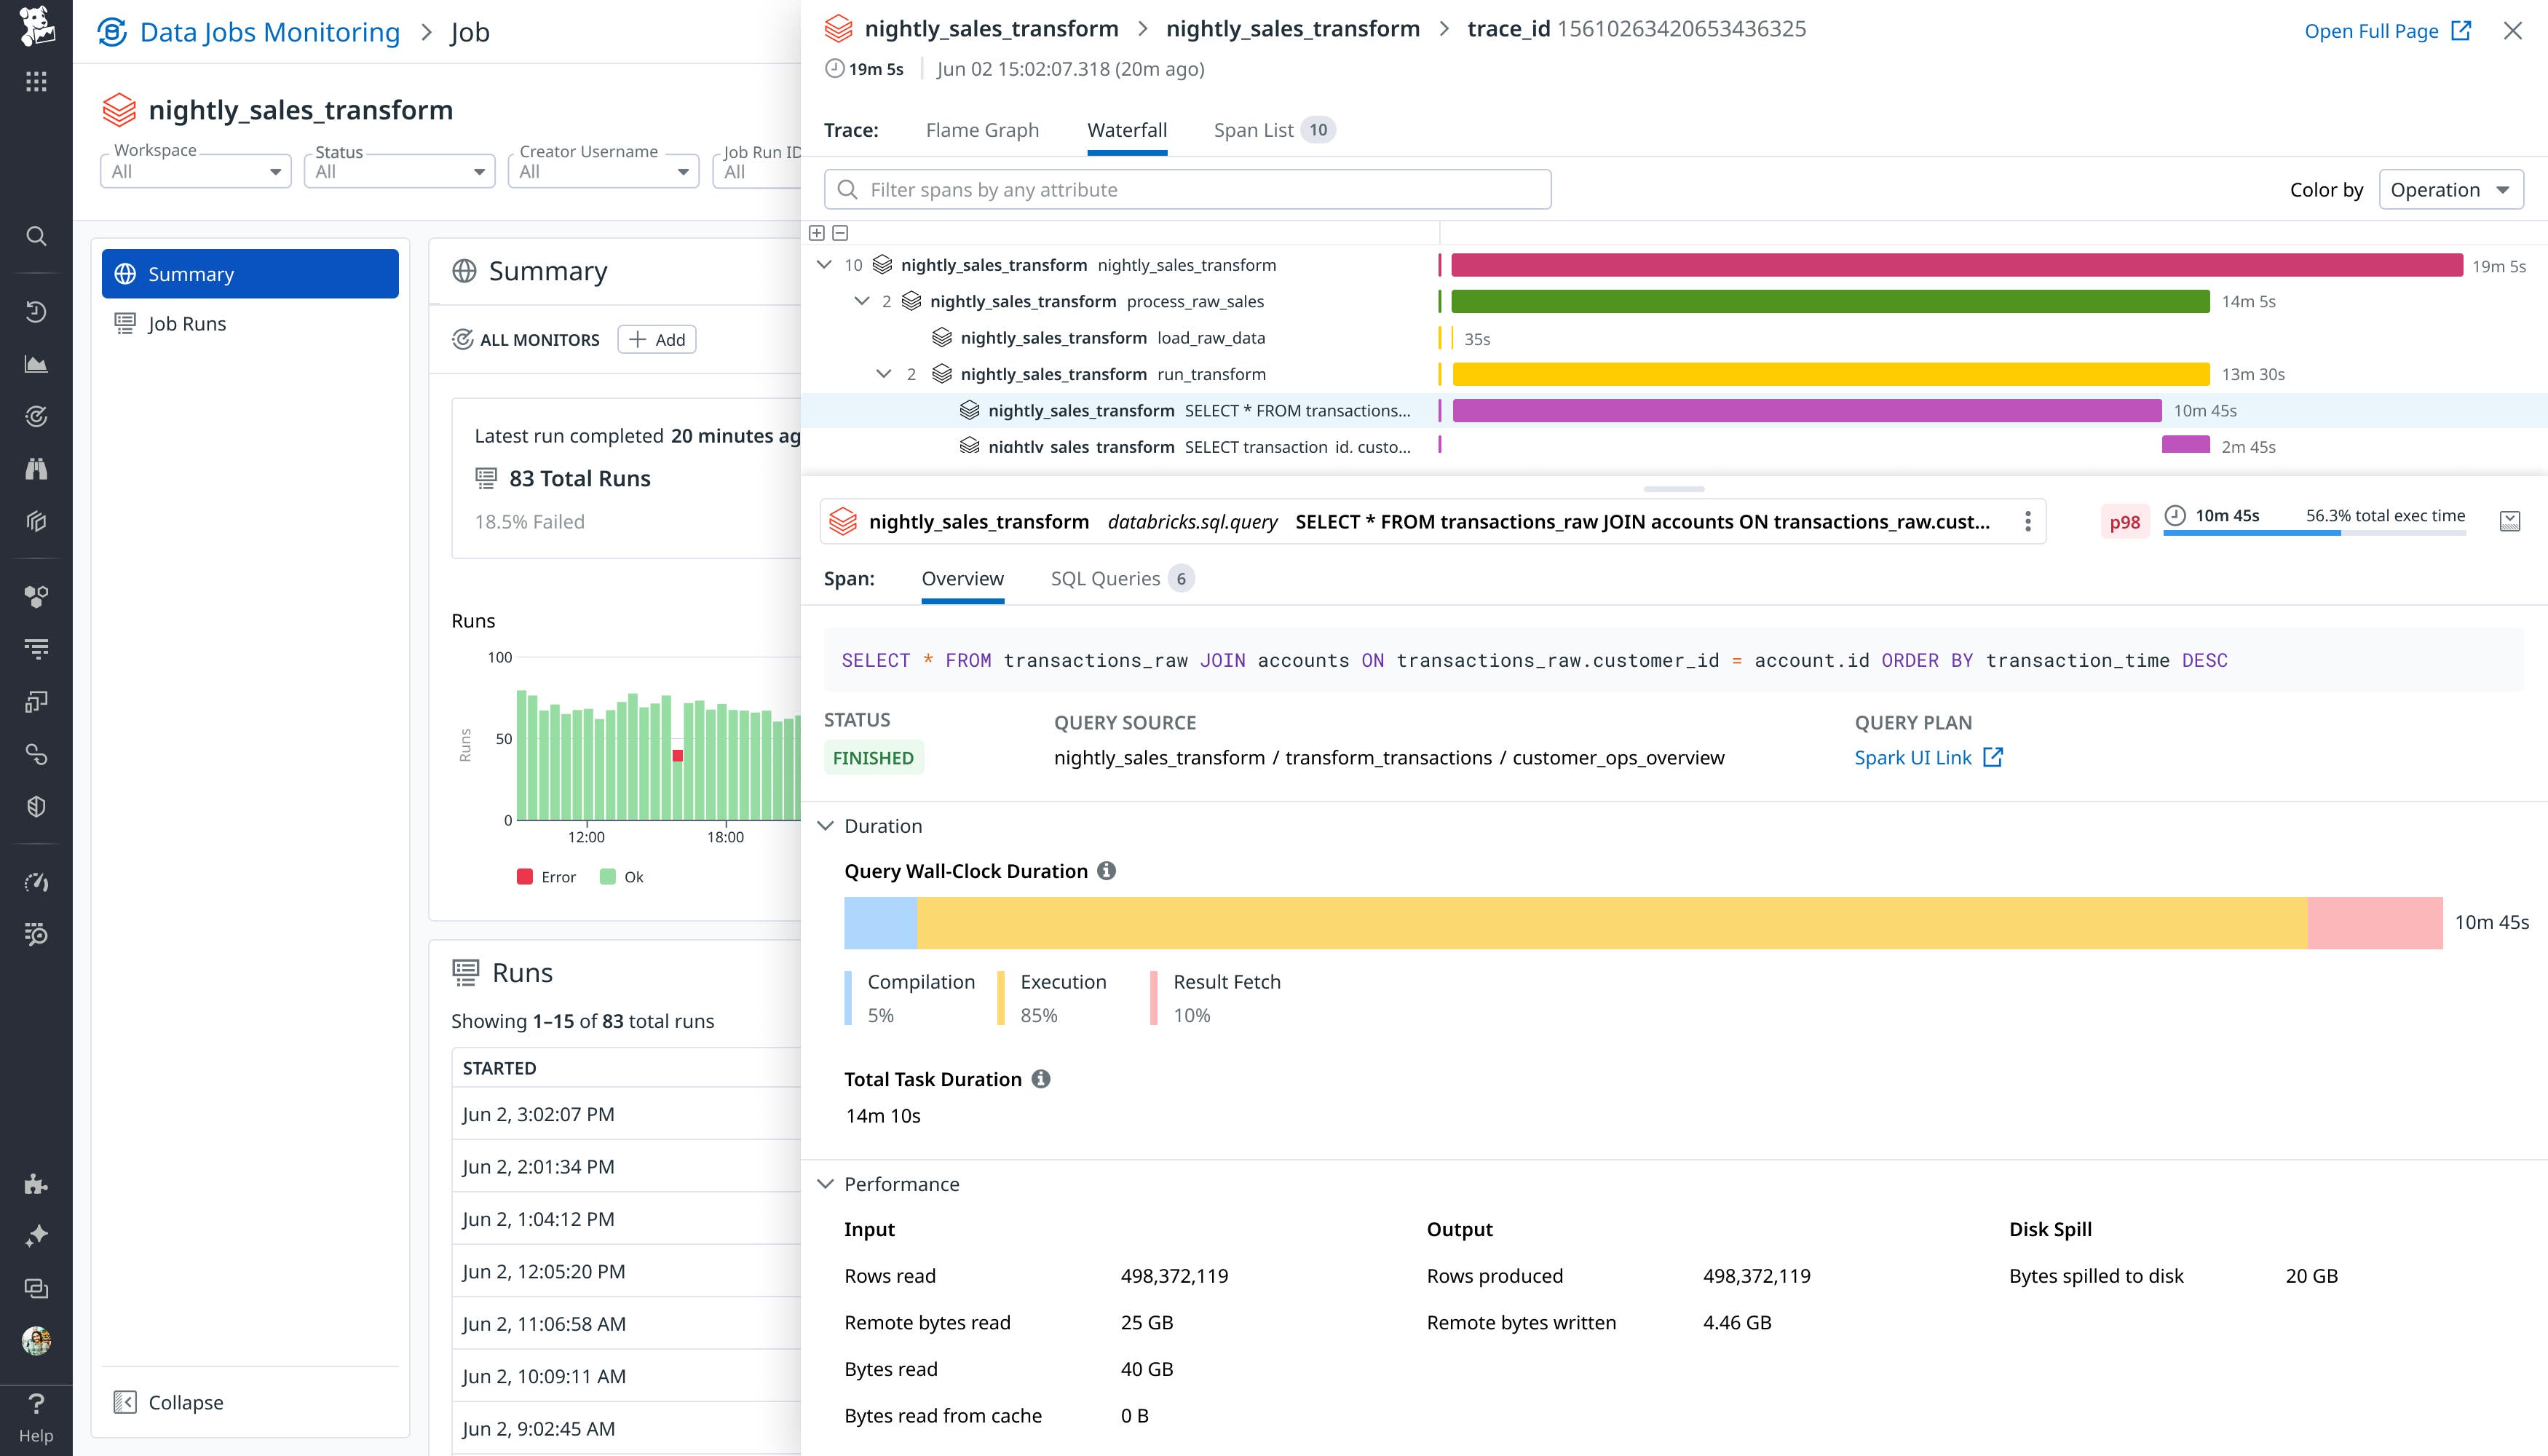
For example, say you’re part of a data engineering team, and you notice a large job whose Databricks serverless costs are rapidly rising. Using DJM, you can see trends in job duration, status, and cost over time, enabling you to identify where the increase began and filter to those job runs of interest. You can then drill into the performance of expensive or poorly performing job runs to view a trace of the duration and status of each task and query executed, helping you optimize the job.

DJM also surfaces data from Databricks query history, bringing performance metrics that aid in query optimization. This visibility can provide useful information when you’re examining a problematic job run.
To continue our example above, let’s say you notice the expensive job is taking significantly longer than usual, risking missed data delivery for downstream dashboards. Using the trace view, you can see which Databricks task is taking the most time, as well as the specific query that is contributing the most to latency. You trace the job execution and drill into query-level metadata from the Databricks query history API, where you find that one of the SQL tasks in the job is taking much longer than others. In the query details, you spot a potential issue: The SQL includes a SELECT * from a large table (transactions_raw), causing a full table scan on millions of rows. You flag this as a query anti-pattern, replace the SELECT * with specific column names, and add a WHERE clause to limit the number of queried rows.
In context of the job run, query performance metrics can also help you understand how to optimize performance. For example, say you receive an alert showing elevated spill_to_disk_bytes during a nightly serverless job that transforms sales data. Investigating the trace in Datadog, you find a query in the Databricks query history:
SELECT customer_id, COUNT(*)
FROM transactions
GROUP BY customer_id
The job processes billions of rows, and Datadog shows high disk spilling. High disk spill greatly slows down queries and can indicate that there is not enough memory for a job. You realize the cause is insufficient memory allocated for the GROUP BY aggregation. Since this job is running on a serverless SQL warehouse, you are able to increase the warehouse size from medium to large, which will reduce the memory bottleneck that is causing the spilling. On the next run, spill_to_disk_bytes drops to near zero, and the job completes twice as fast.
Monitor Databricks serverless jobs with Datadog
In this post, we’ve shown how you can use Datadog DJM to detect and alert on issues with your Databricks serverless jobs, troubleshoot issues, and optimize your jobs down to the query level.
To monitor your Databricks serverless jobs today, sign up for the preview. Or, if you’re new to Datadog, sign up for a free trial to get started.


