Mike Peralta
When query performance degrades in production, users are often the first to notice. By the time support tickets start piling up or engineers start digging through dashboards, it’s already too late. Manually searching for slow queries—and their root causes—across dozens of services and databases is time-consuming and costly.
Datadog Database Monitoring (DBM) now helps teams proactively detect query regressions, which are unintended increases in query duration, as they happen. By establishing historical baselines and using anomaly detection, DBM identifies performance regressions in your most commonly used queries and automatically runs through a set of diagnostics to help you quickly identify and resolve your issues.
In this post, we’ll explain how you can use DBM to:
Identify query regressions
A query regression typically produces an increase in execution time and a spike in the resources that are required to complete the query. Regressions don’t just affect one request; they can cascade across services. One of the most important tasks for anyone who owns a database, application, or pipeline is identifying meaningful increases in query duration that could impact users.
As queries become slow, they can lead to delayed page loads, failed ETL jobs, and stalled analytics workloads. Worse, they can monopolize CPU and memory, slowing down other queries and potentially leading to system outages and unnecessary infrastructure costs. Identifying regressions early helps you maintain performance and reliability without overprovisioning resources or overoptimizing your queries.
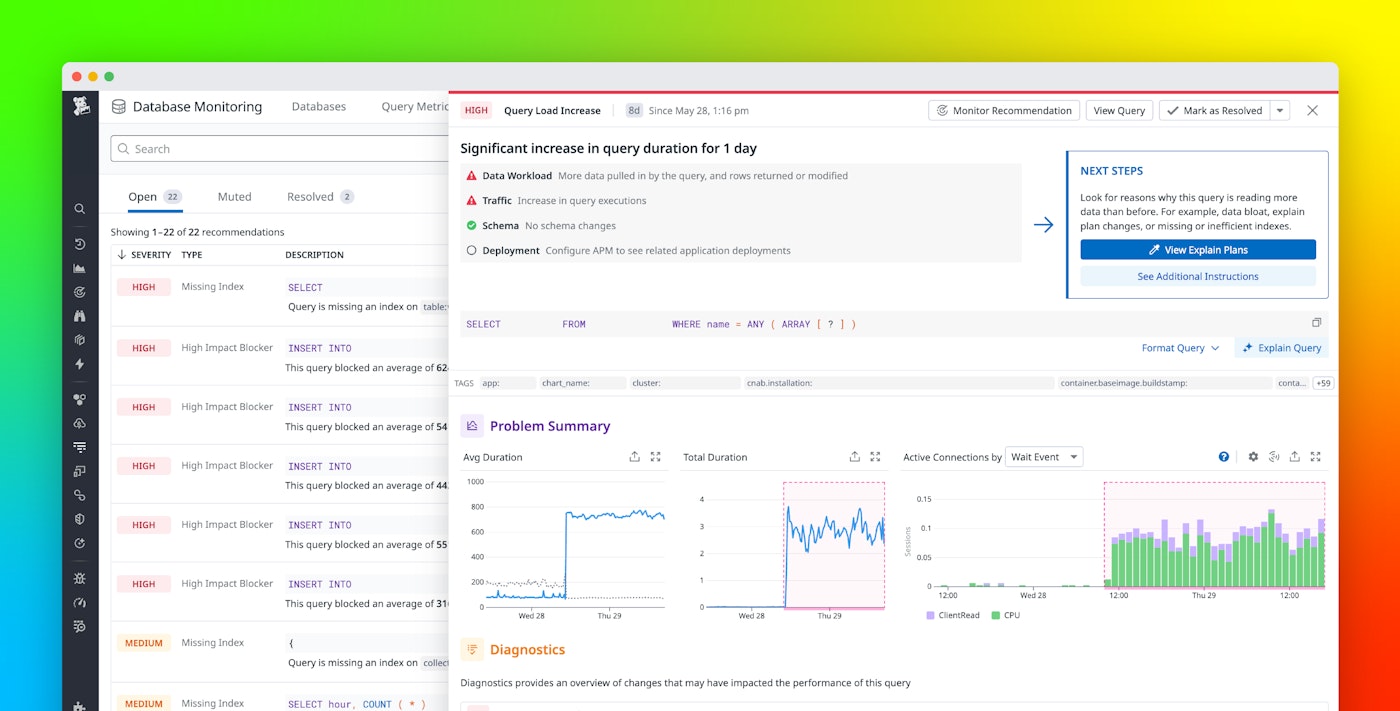
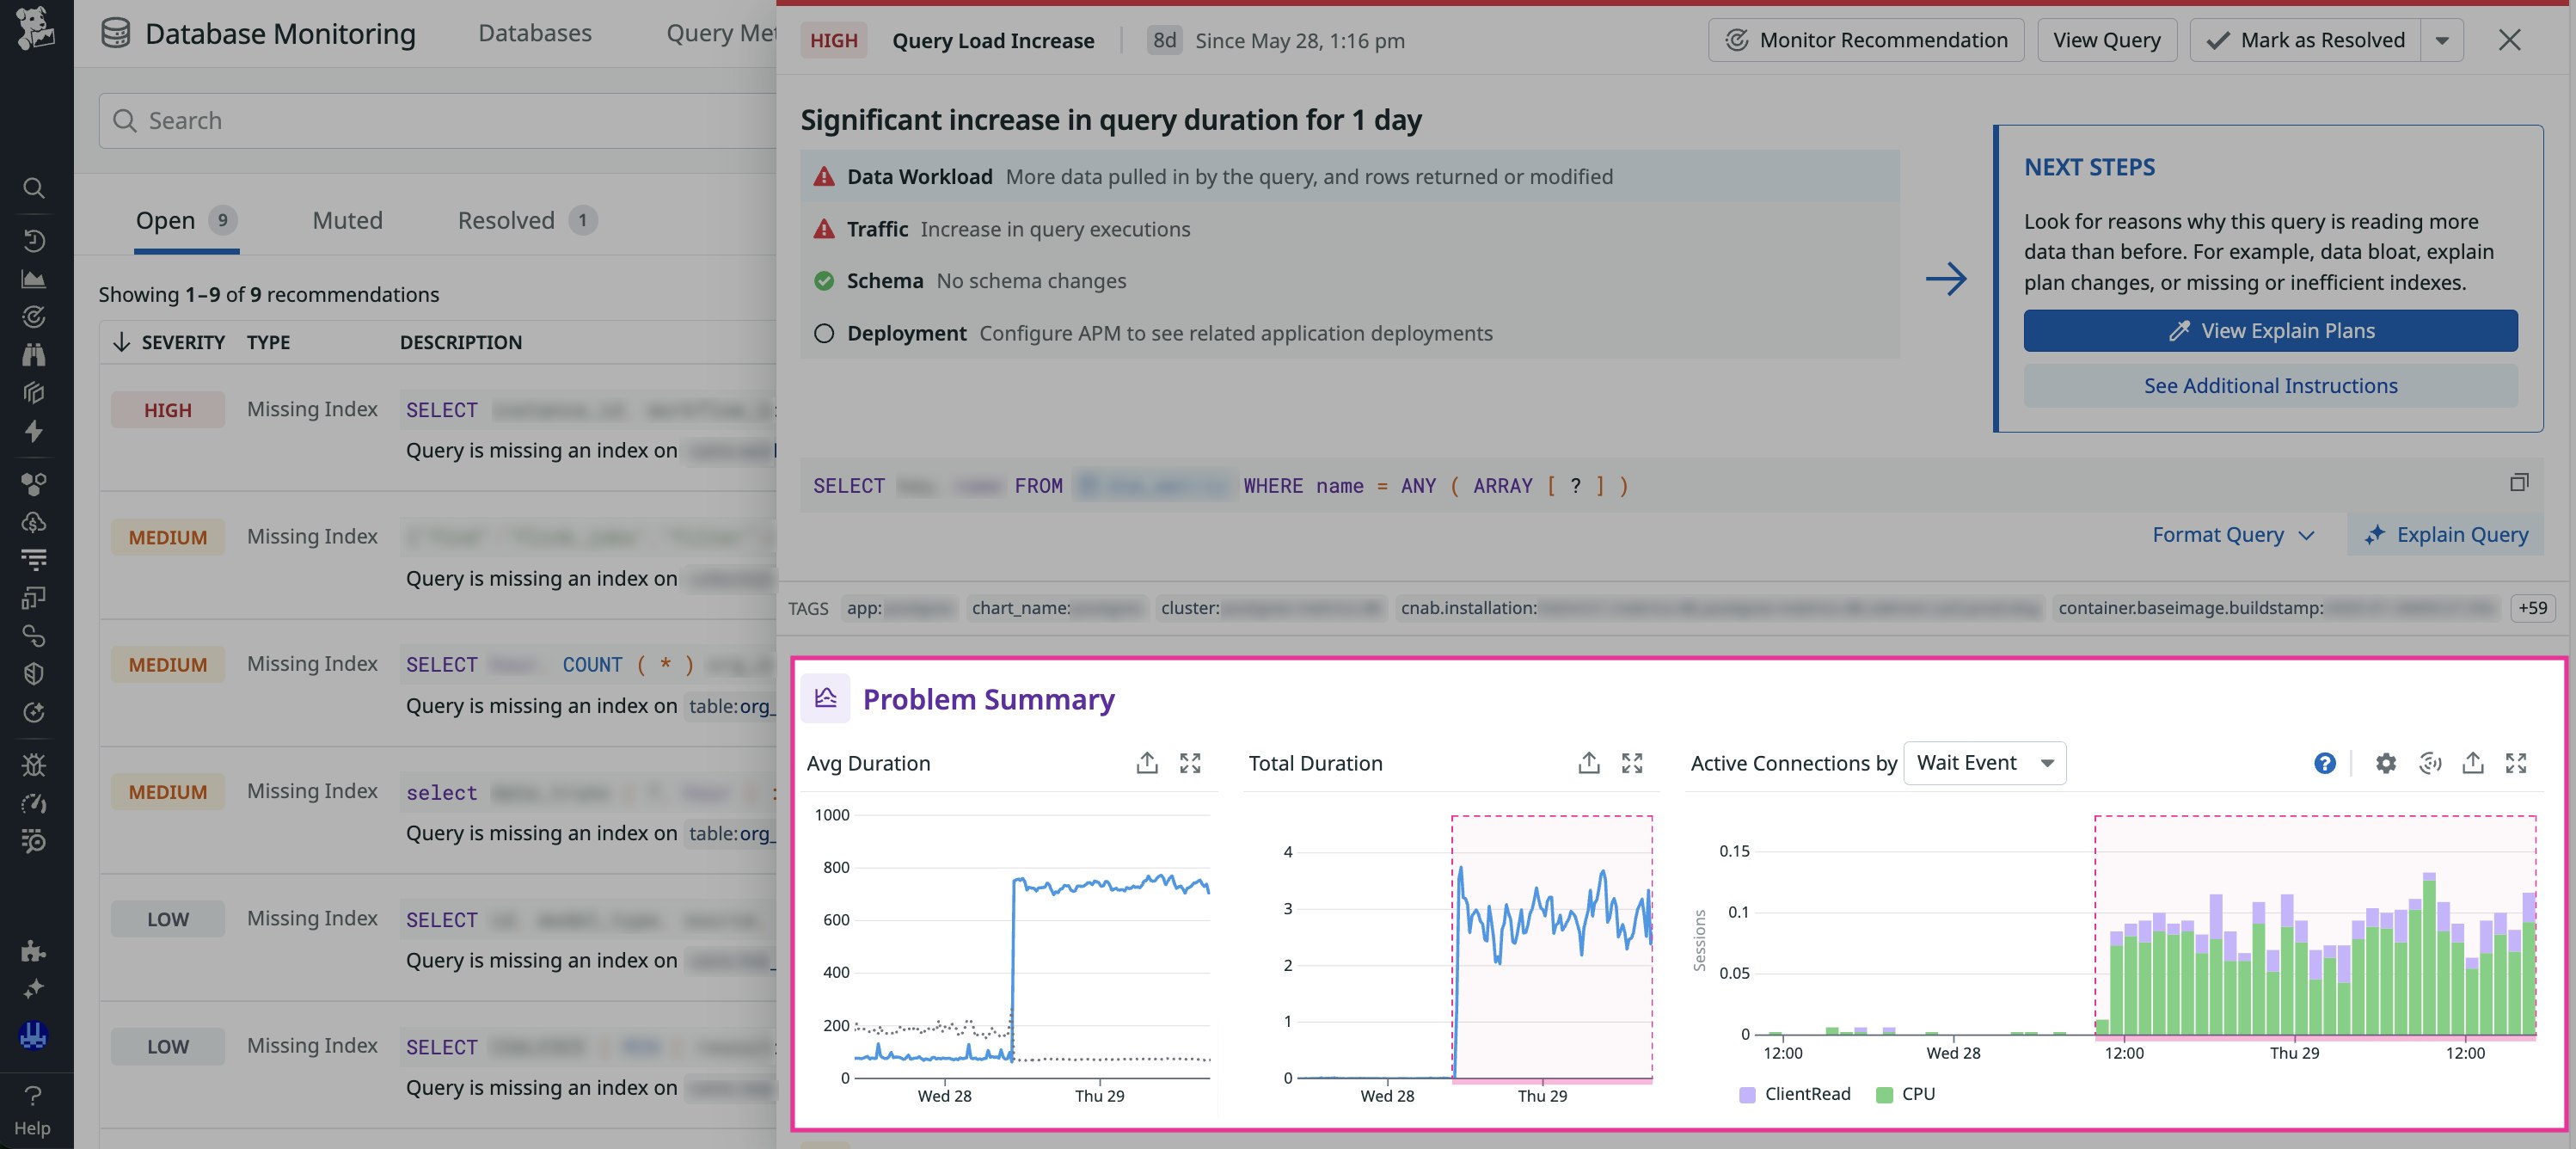
DBM captures these regressions and presents them to you in recommendations that are labeled as Query Load Increase. DBM tracks query execution performance over time, establishing a baseline of normal behavior for each query. By using anomaly detection, DBM automatically surfaces queries that deviate from this baseline—particularly those that have increased execution time across multiple executions.
As a result, you don’t need to comb through logs or receive notification from a customer to become aware of a query regression. You can see when a query that normally runs in 100 ms starts running in 700 ms, and you can receive alerts about this increased duration.
Classify regression severity
Not every regression is critical. DBM helps you prioritize which regressions to address by calculating the impact of a regression based on the total execution time of the query relative to others in your database.
If a regressed query runs only a few times per hour and has limited impact, it is less urgent. But if the regression affects a high-throughput query that accounts for a significant portion of your database time, DBM flags it as a high-severity recommendation. This functionality helps you focus first on the queries that are most likely to degrade user experience or system stability.
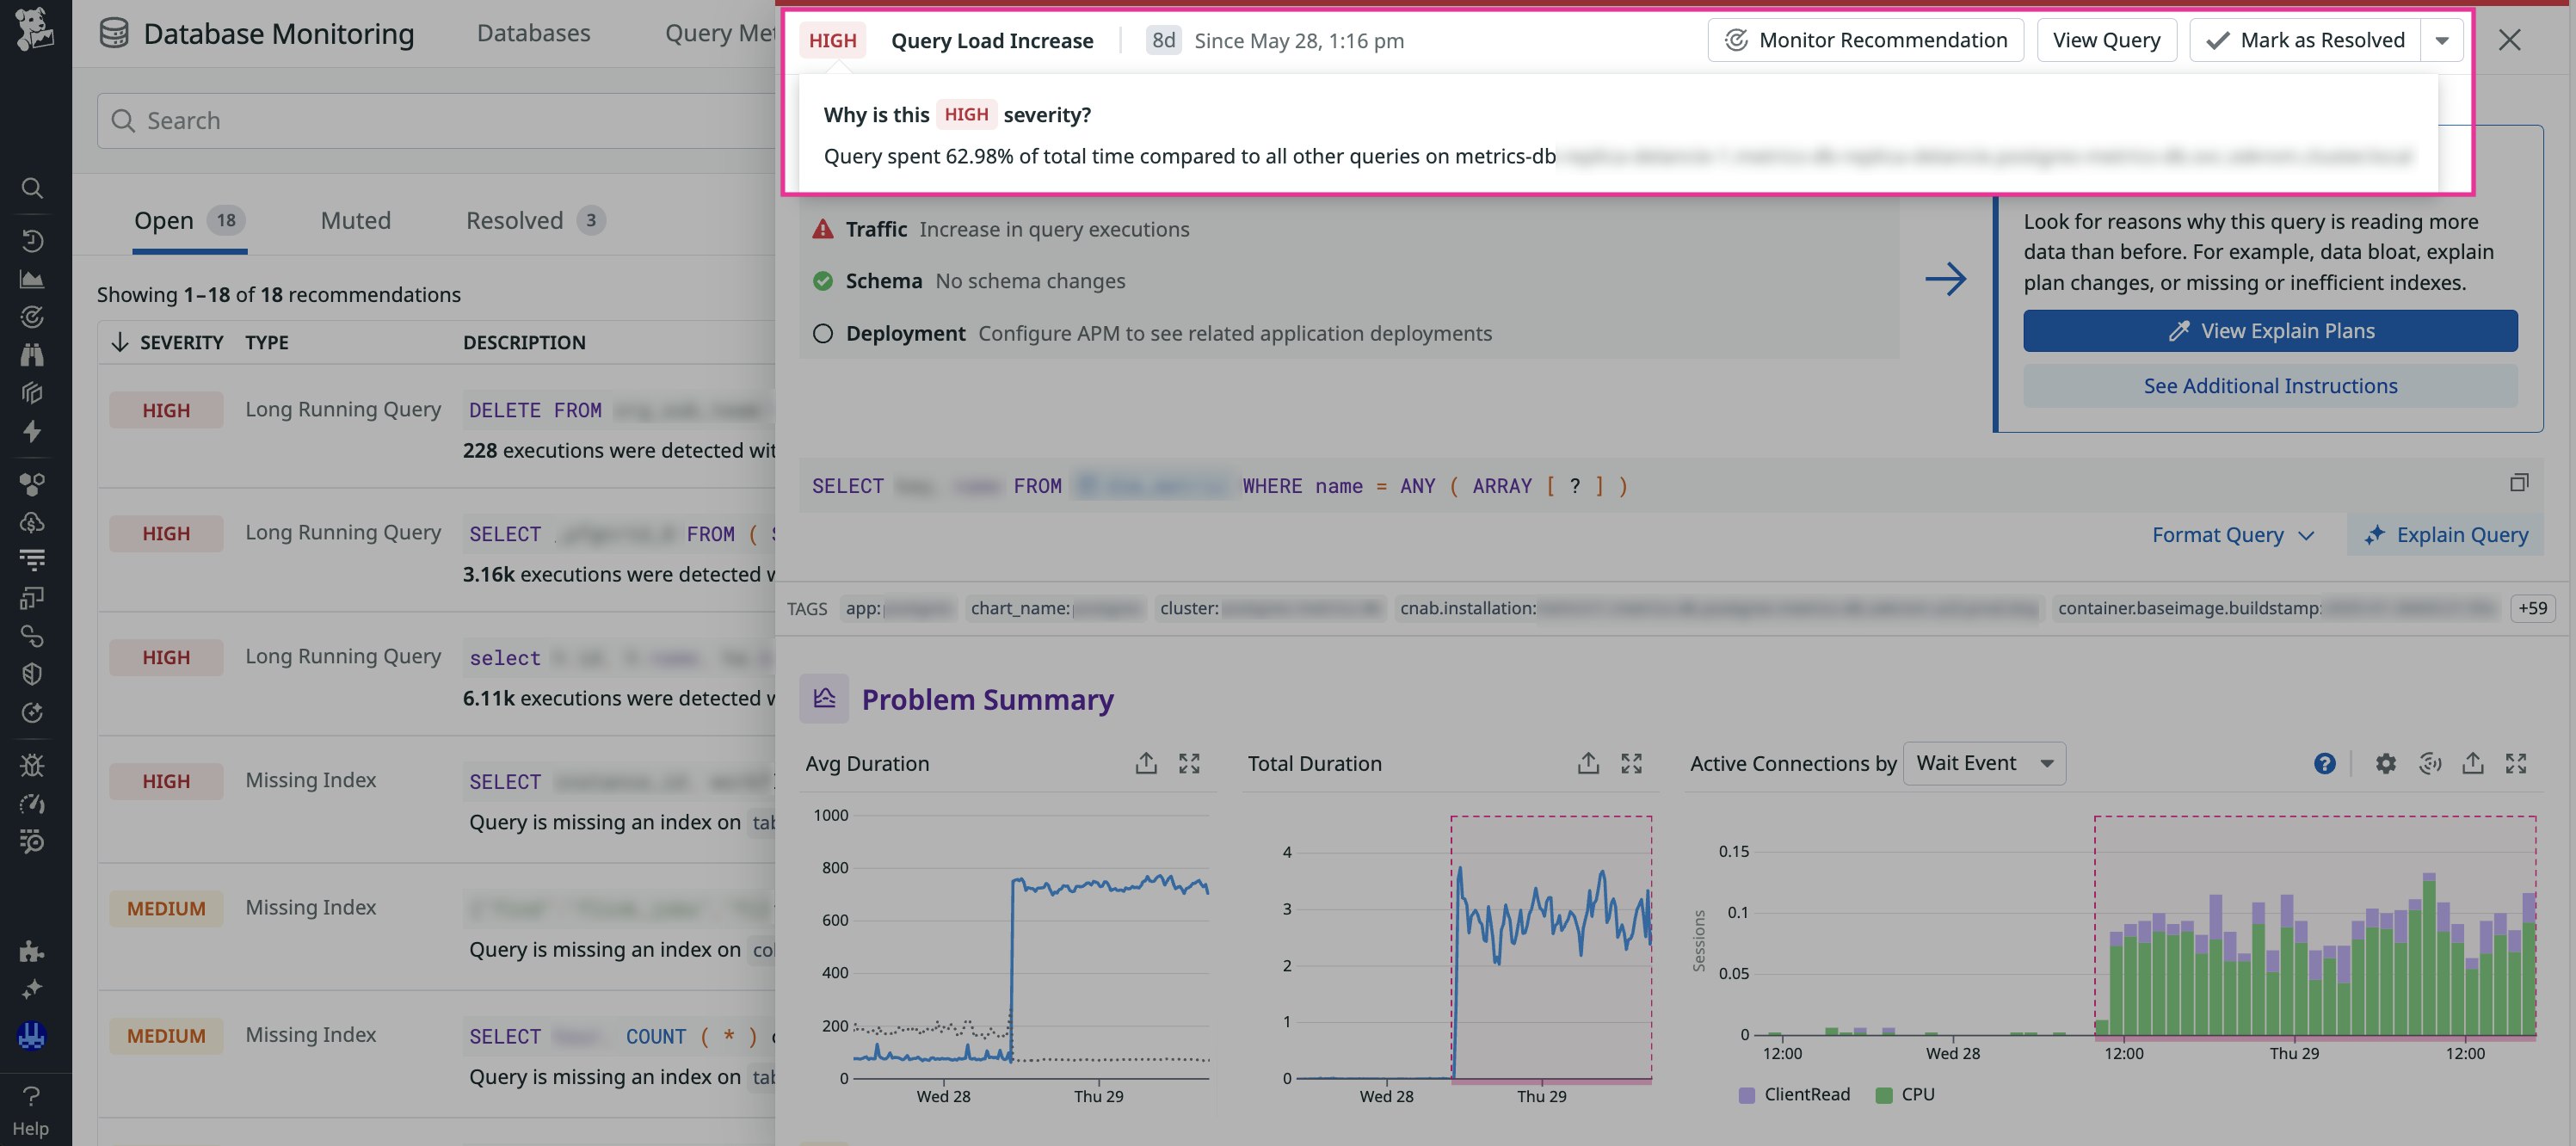
Investigate the cause of a regression
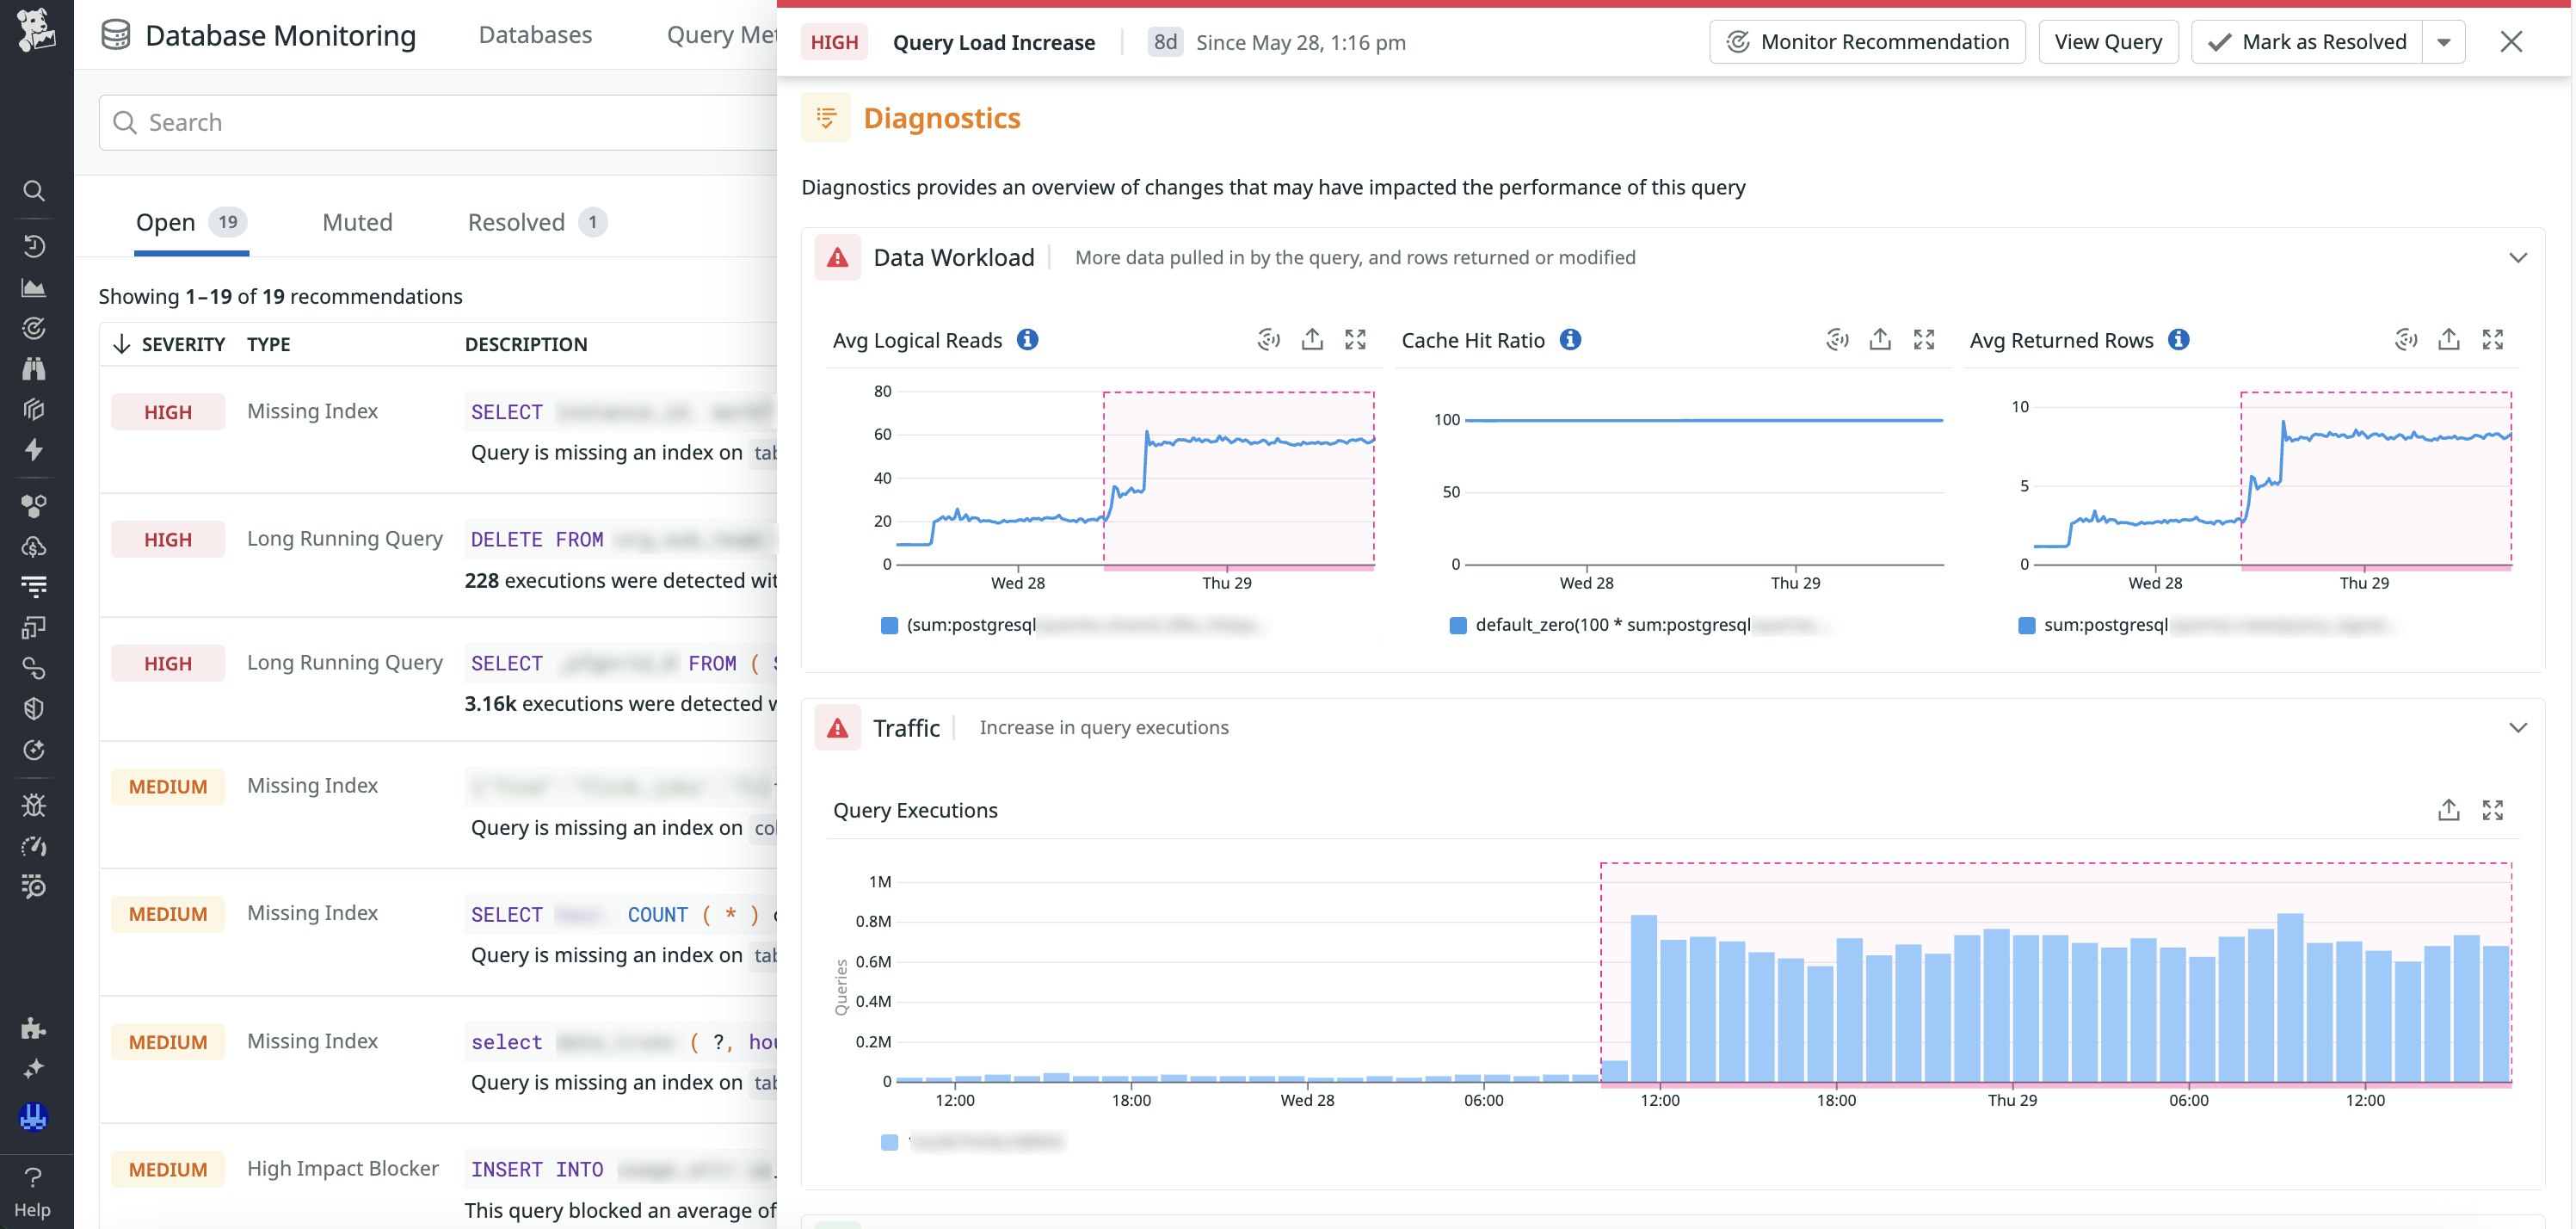
After detecting a regression, DBM automatically correlates it with surrounding context so that you can understand what changed. DBM examines multiple signals, including changes in query workload, spikes in user or service activity, schema modifications, and recent deployments.
These signals are surfaced alongside the regression timeline to help you spot likely root causes faster. For example, if a schema change occurred shortly before the regression or if a deployment introduced a new access pattern, you can identify that connection without jumping between tools.
Start managing database query performance today
Query regressions can silently affect performance and cost until they escalate into larger problems. DBM helps you detect regressions as they emerge, prioritize the regressions by severity, and determine their most likely root causes. To learn more about the recommendations that DBM provides, check out our documentation.
If you’re new to Datadog, you can sign up for a 14-day free trial to get started.
