Austin Bergstrom

Mike Peralta

Jason Petersen
In PostgreSQL, the EXPLAIN ANALYZE statement gives you a detailed report of what actually happens when you execute a query. This kind of information is important for troubleshooting slow queries, but using EXPLAIN ANALYZE to collect this data is often challenging in a production environment.
Datadog Database Monitoring now supports automatic collection of EXPLAIN ANALYZE plans for PostgreSQL, enabling you to easily capture execution details that help you troubleshoot slow queries.
Debugging query latency with EXPLAIN ANALYZE
Database Monitoring can now automatically process plans captured by PostgreSQL’s auto_explain extension for all queries that meet your criteria (for example, all queries that exceed 1 second).
Once this feature is enabled, Datadog processes the plan output and associates it with the underlying query and any related APM traces. With this correlation, you can detect performance issues in APM, identify the root cause as a query issue, and diagnose the specific problem all in the Datadog platform.
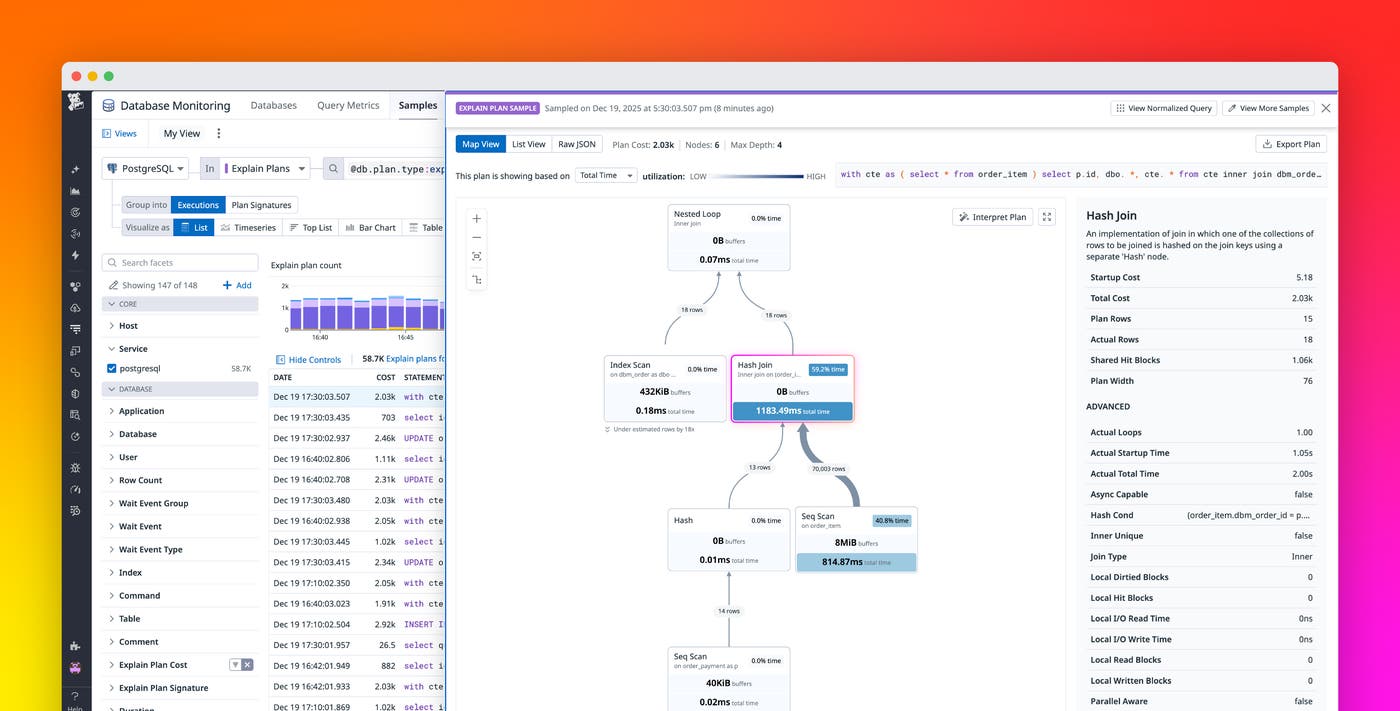
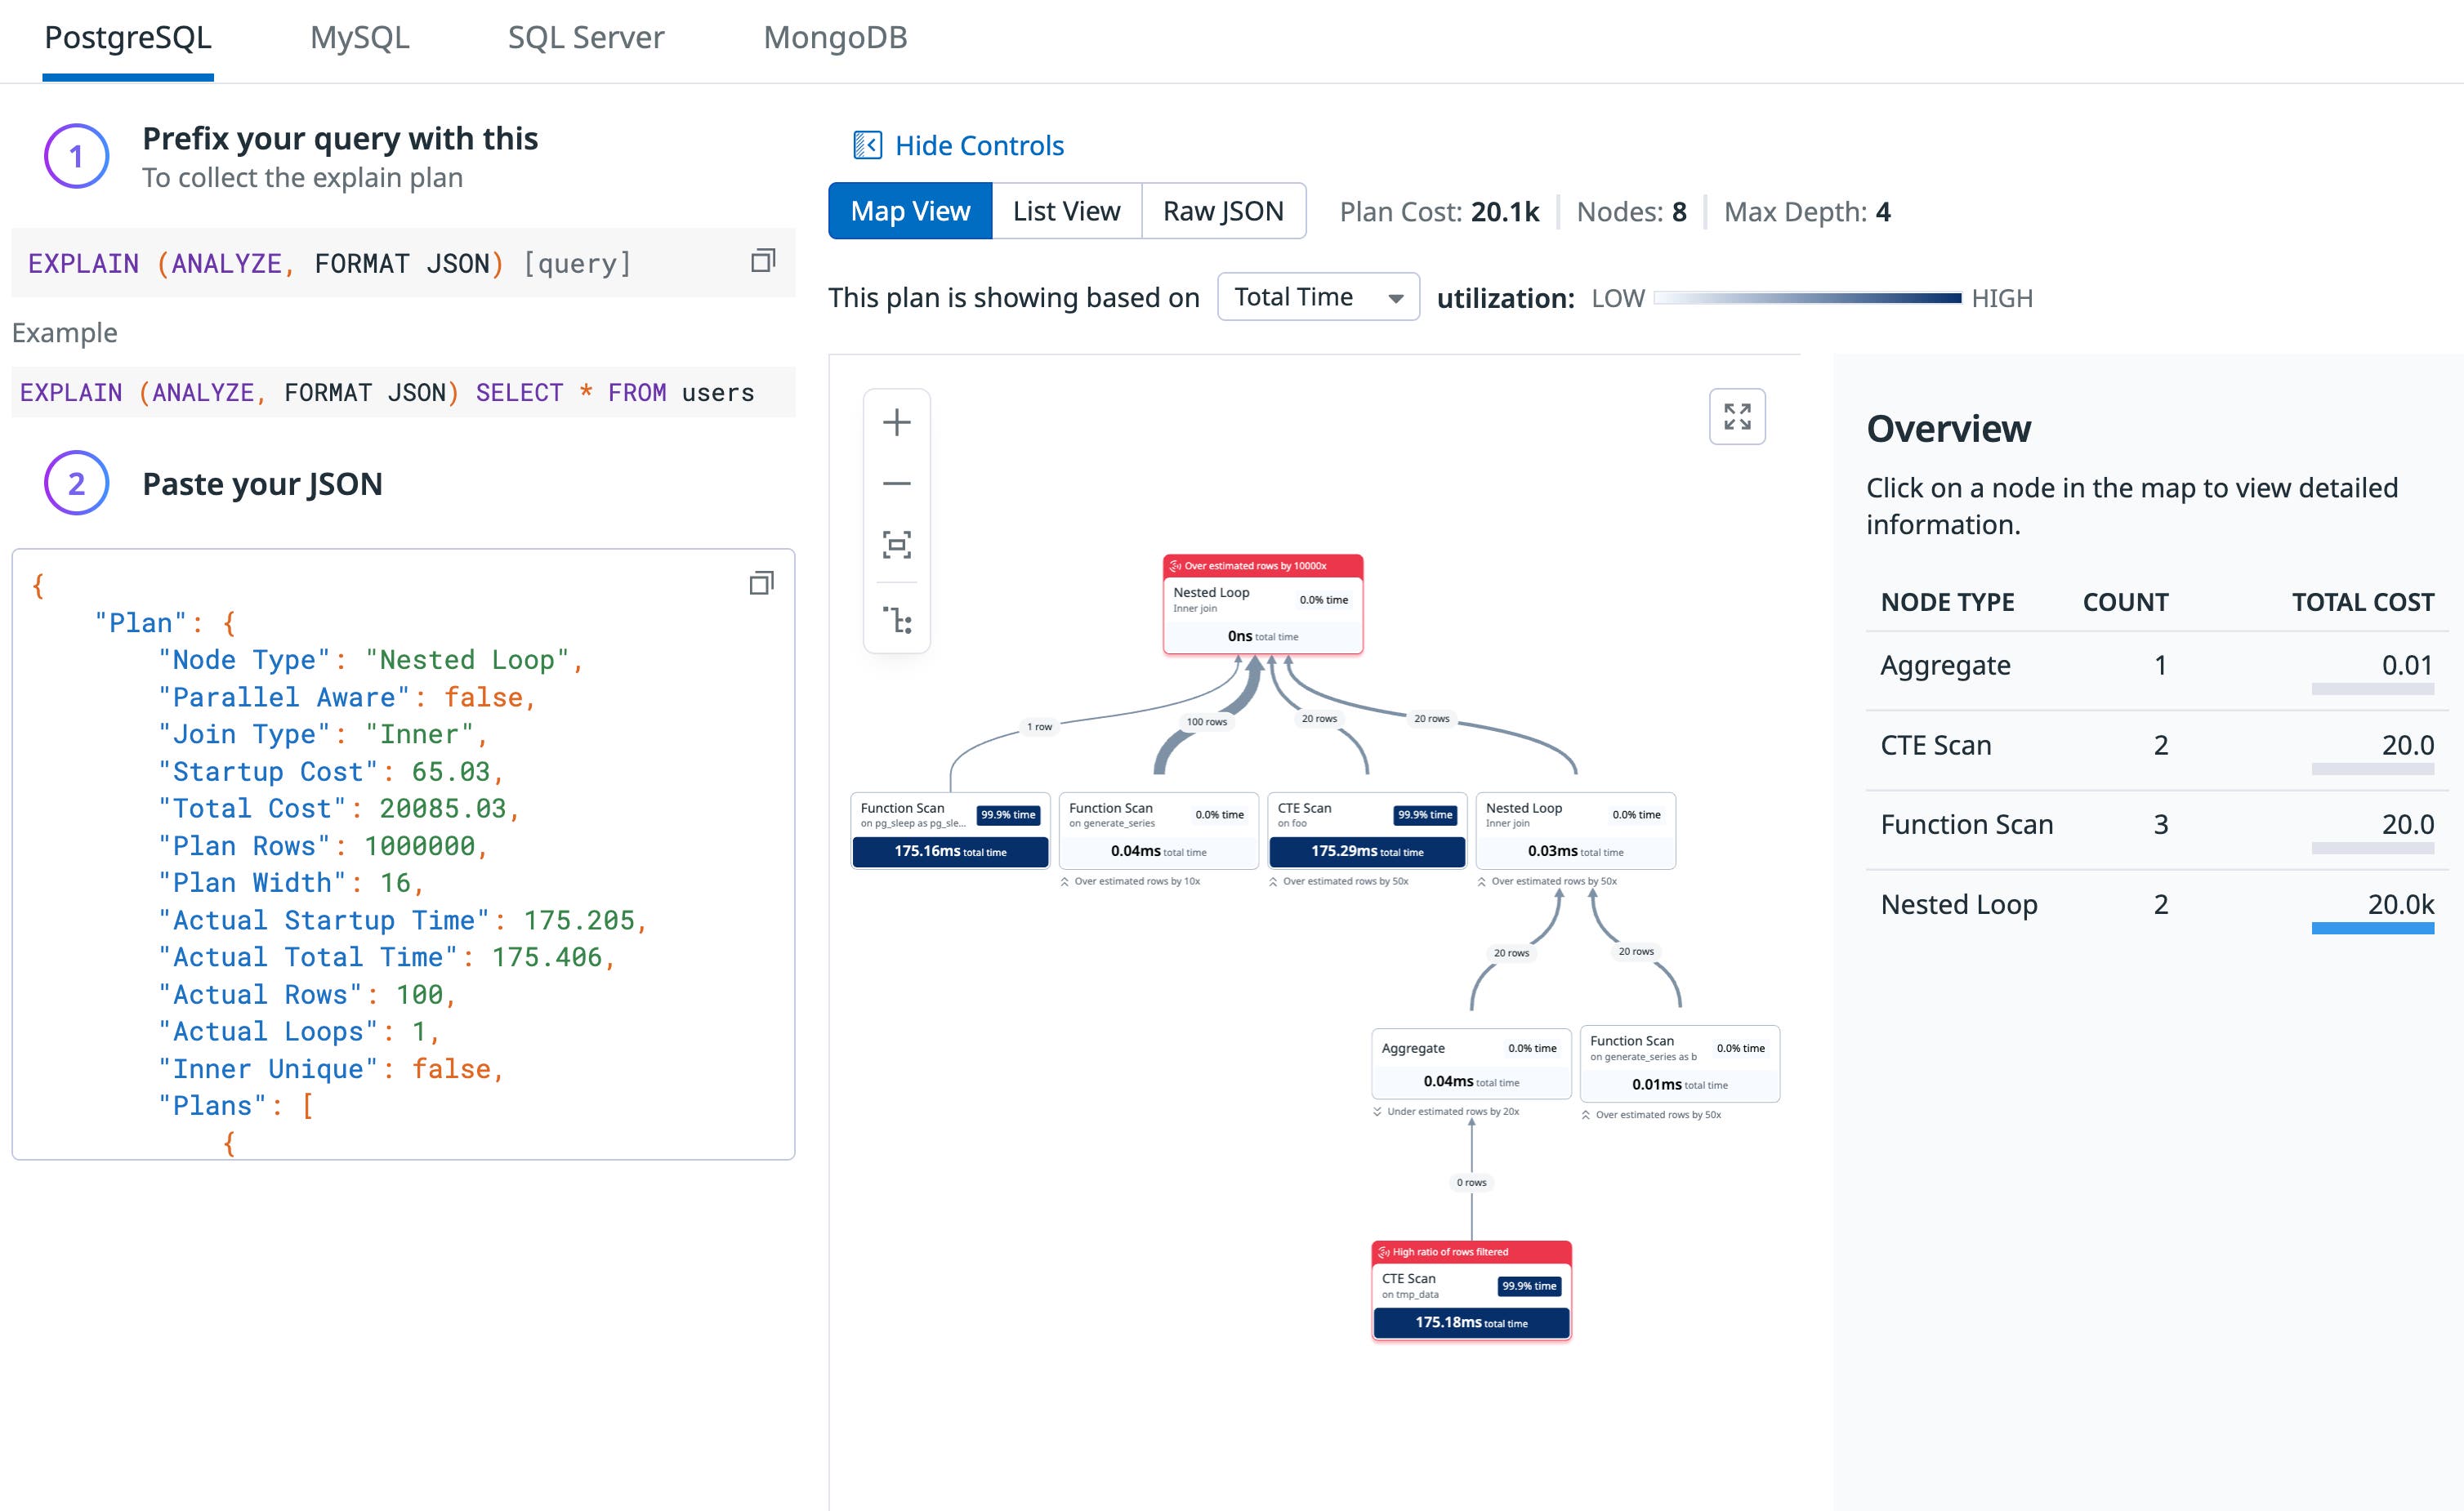
Additionally, Database Monitoring provides an interactive plan visualization that makes the EXPLAIN ANALYZE data easier to interpret, focusing on the nodes that account for most of the runtime. (Try it here.) This visualization is especially useful if you’re unfamiliar with explain plans or if you’re looking at an EXPLAIN ANALYZE plan for a large query.
Identifying incorrect row estimates with EXPLAIN ANALYZE
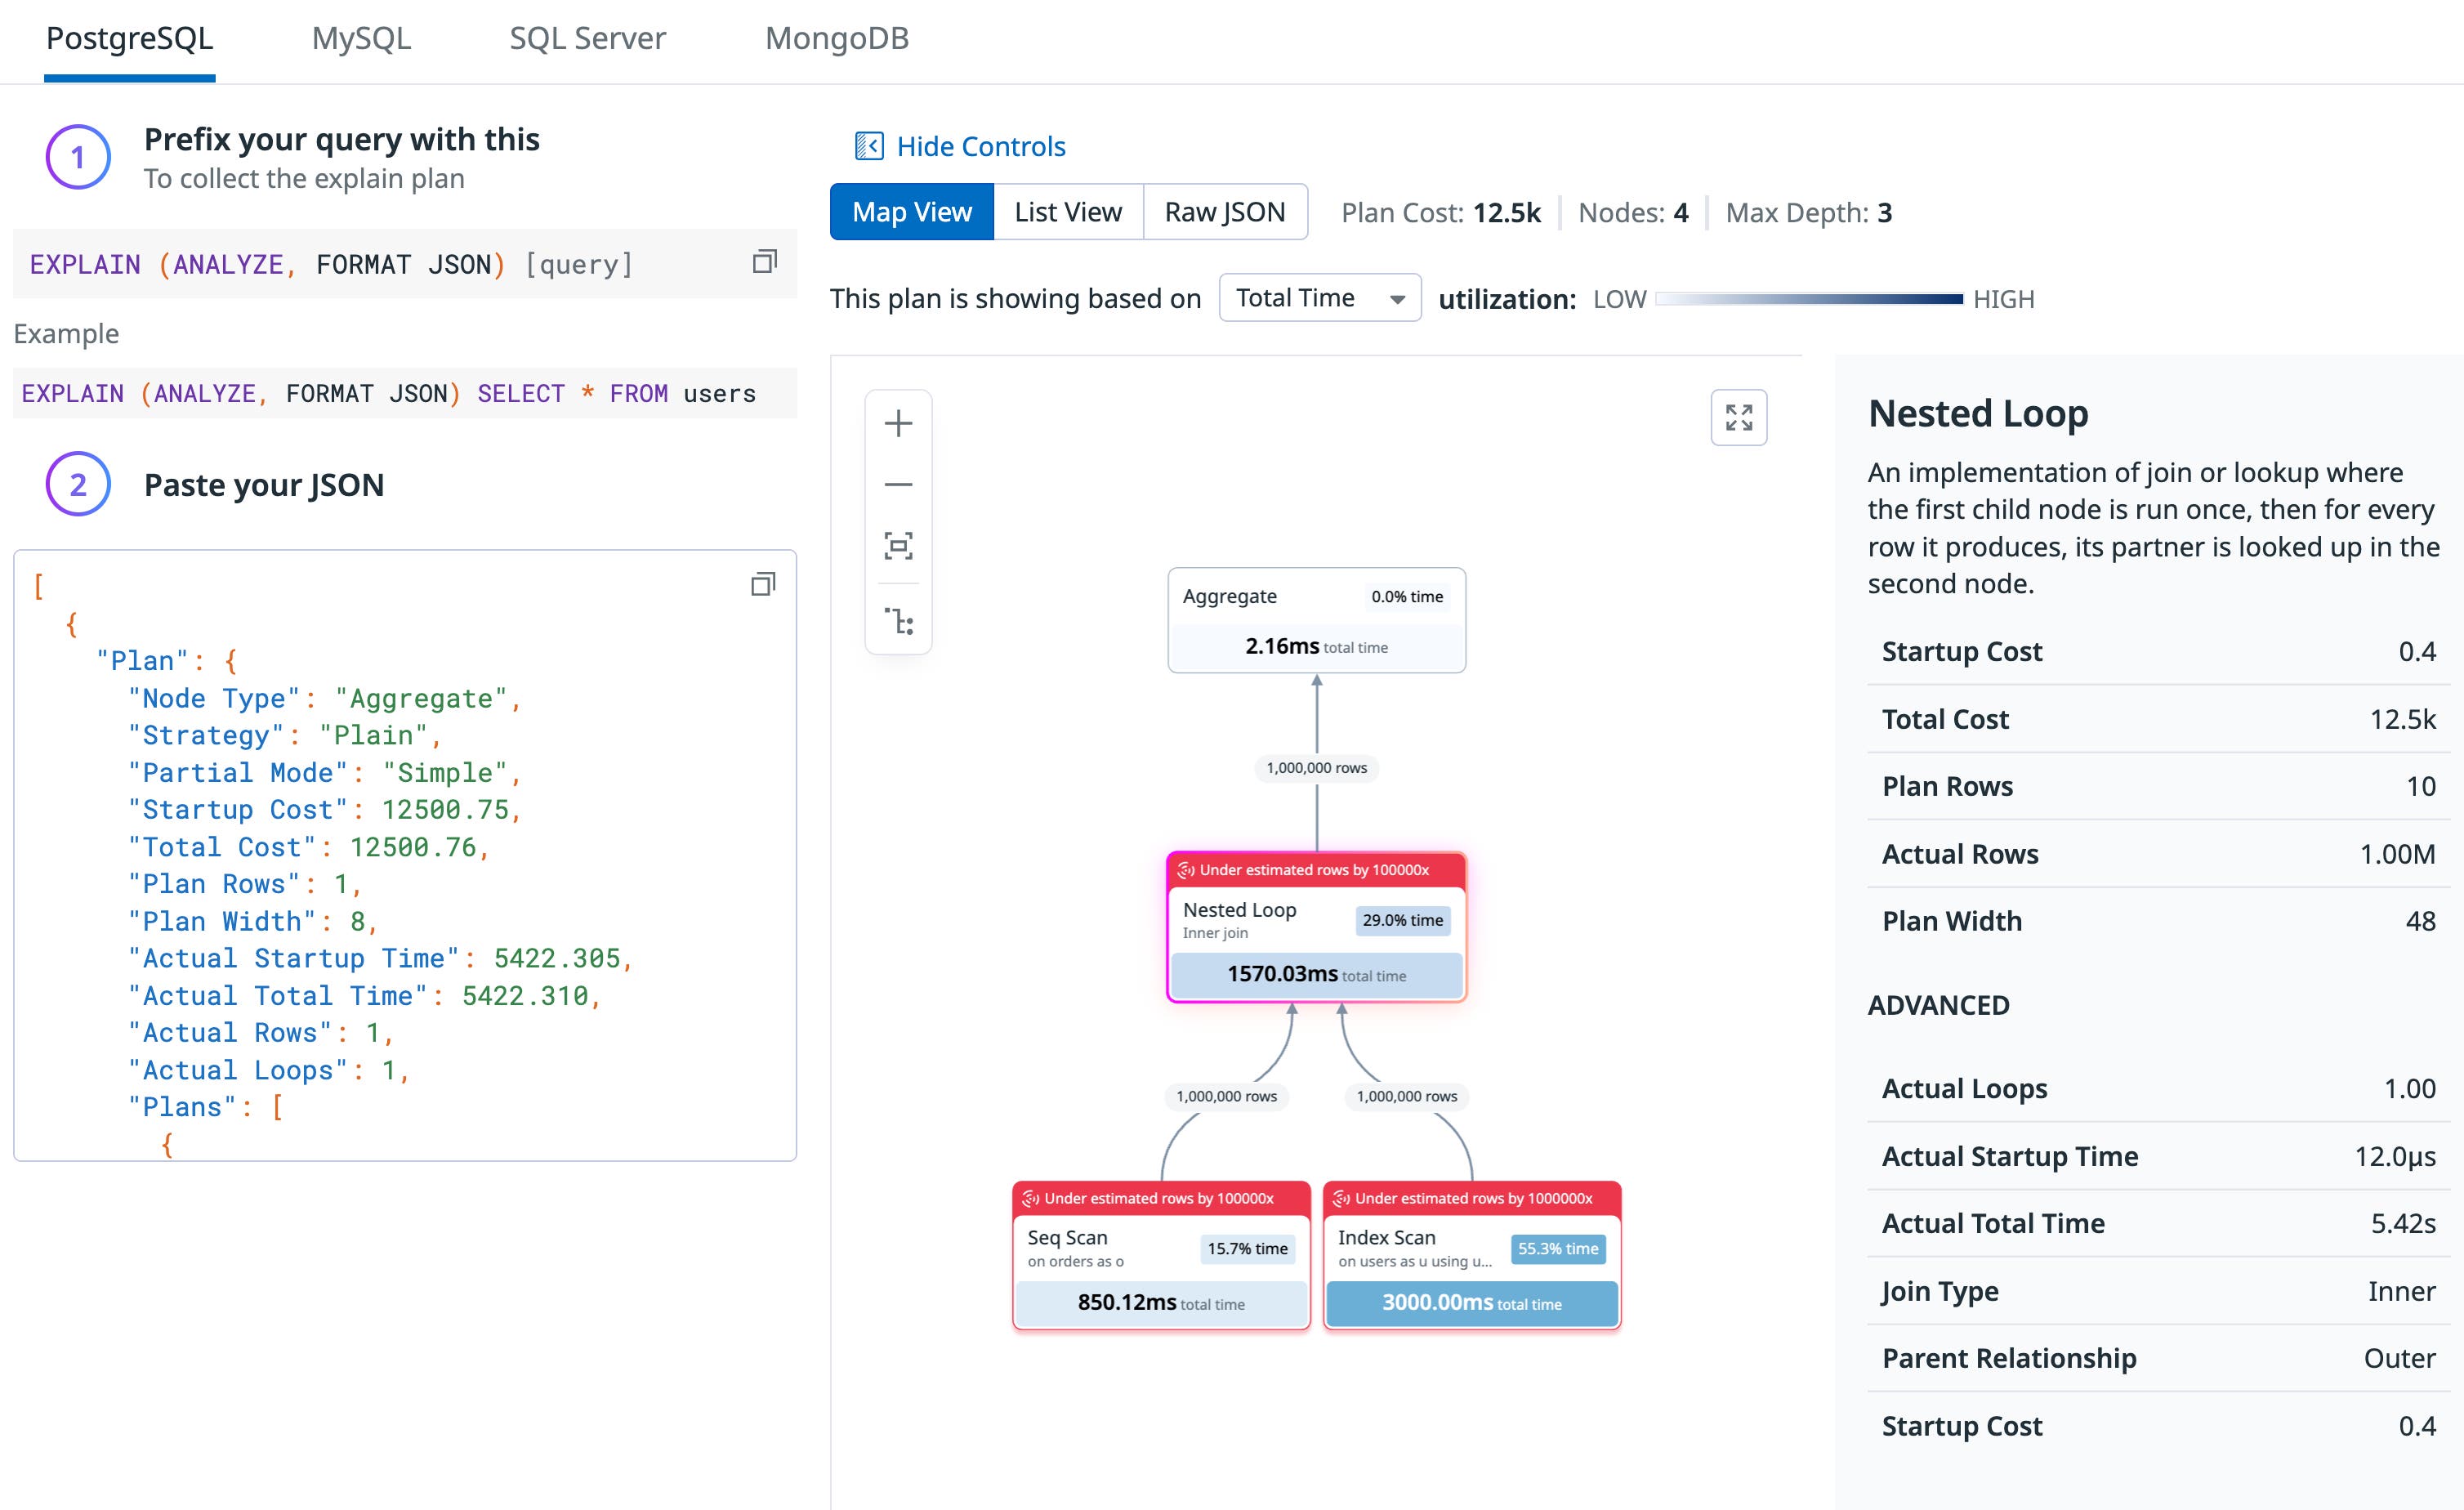
As an illustration of how you can use EXPLAIN ANALYZE data in Database Monitoring to help you troubleshoot slow queries, consider the value of comparing estimated versus actual rows. Query latency often regresses when PostgreSQL underestimates how many rows a step will process. If actual rows are far higher than estimated, a plan that looks inexpensive can become highly resource-intensive in practice.
For example, let’s say you are troubleshooting the following query:
SELECT count(*)FROM orders oJOIN users u ON o.user_id = u.idWHERE o.status = 'PENDING';By reviewing EXPLAIN ANALYZE output in Database Monitoring, you might see that the estimated rows predicted from the preliminary EXPLAIN plan are far lower than the actual rows processed. That miscalculation could lead PostgreSQL to perform a nested loop join instead of a hash join, which can cause a major slowdown.
This kind of discrepancy would indicate that your table statistics are stale and that you need to run ANALYZE on that table to resolve the issue.
Identifying cache hit versus disk read issues with EXPLAIN ANALYZE
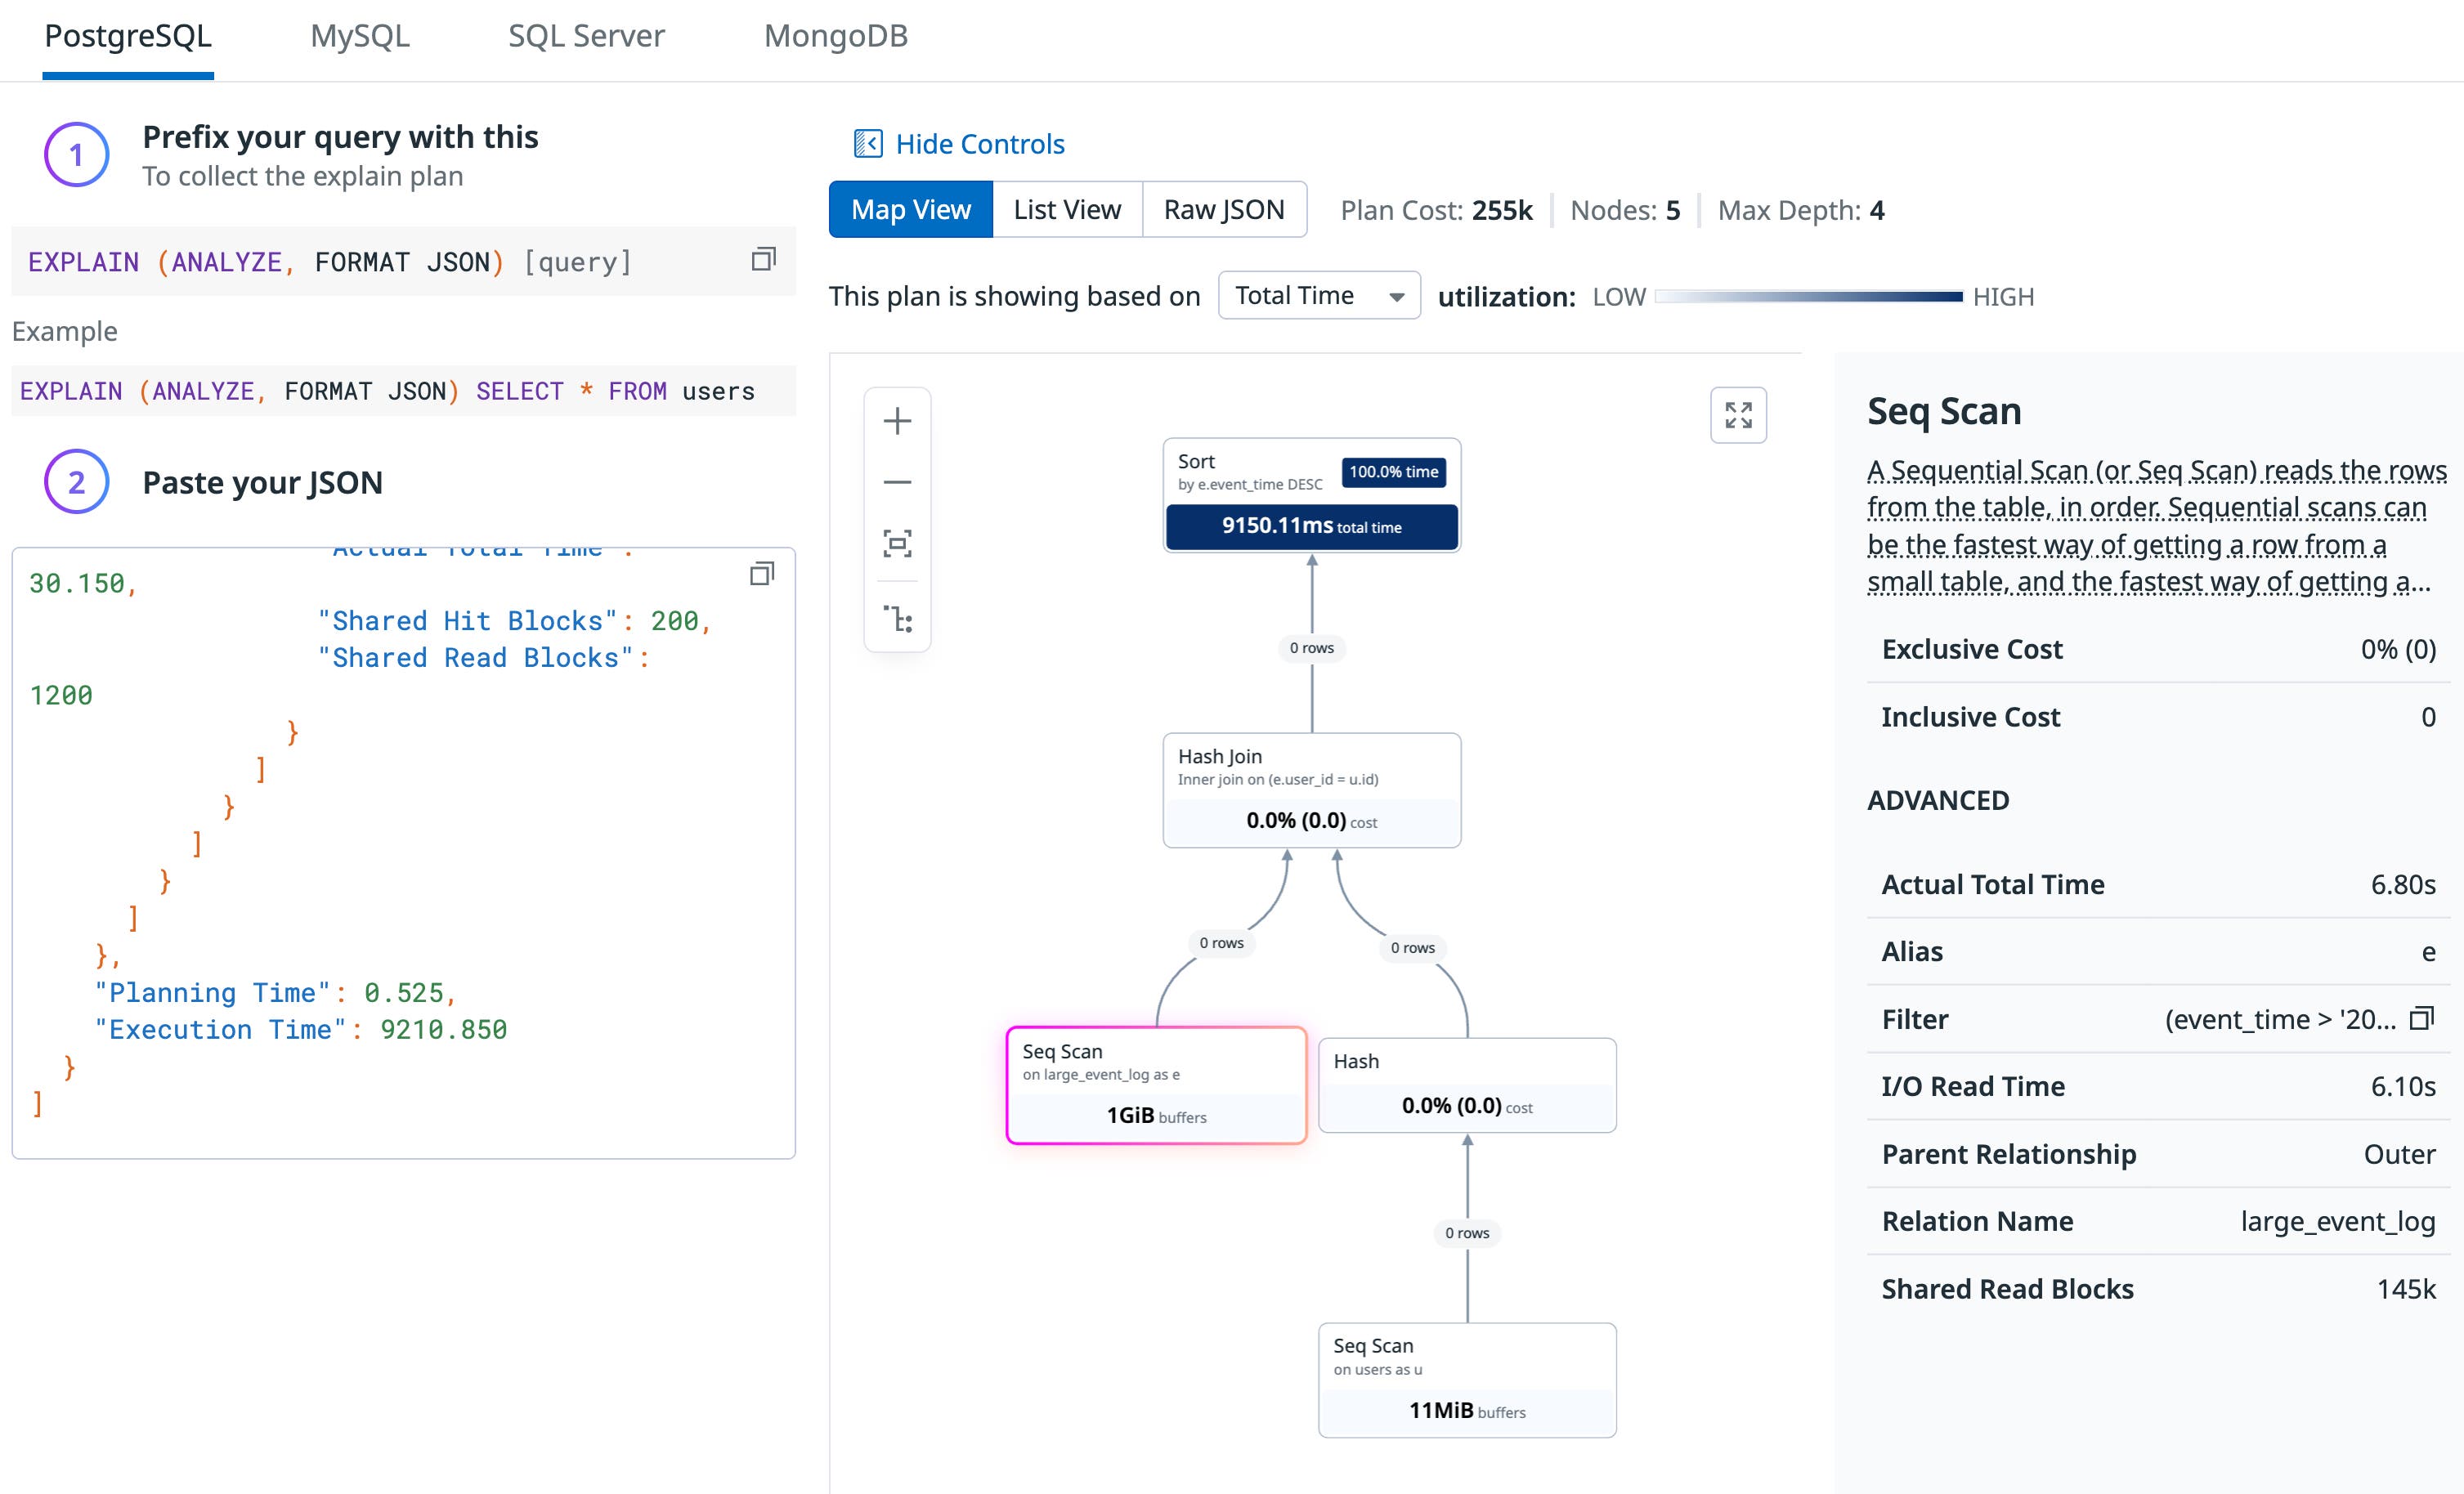
Another way EXPLAIN ANALYZE data can help you diagnose query latency in Database Monitoring is by surfacing data about where a query is performing reads. Examining disk reads versus cache hits helps you determine whether a slow query is waiting on storage reads or running primarily from cached data. If the plan shows a high number of disk reads, it would suggest you should focus on reducing I/O or improving caching capacity to reduce latency. On the other hand, if it shows mostly cache hits, you should focus on reducing work in the execution plan.
For example, let’s say the following query is performing poorly:
SELECT e.event_id, e.event_time, u.emailFROM large_event_log eJOIN users u ON e.user_id = u.idWHERE e.event_time > '2025-01-01'ORDER BY e.event_time DESC;You review the EXPLAIN ANALYZE output for the query in Database Monitoring. In the output, you see that the I/O Read Time makes up the vast majority of your execution time and that your Shared Hit count (i.e., from cache) is low. This means your “working set” is larger than your RAM. In this case, it would be advisable to add more RAM to allow PostgreSQL to keep these blocks in the shared_buffers. This would likely drop this query’s time significantly.
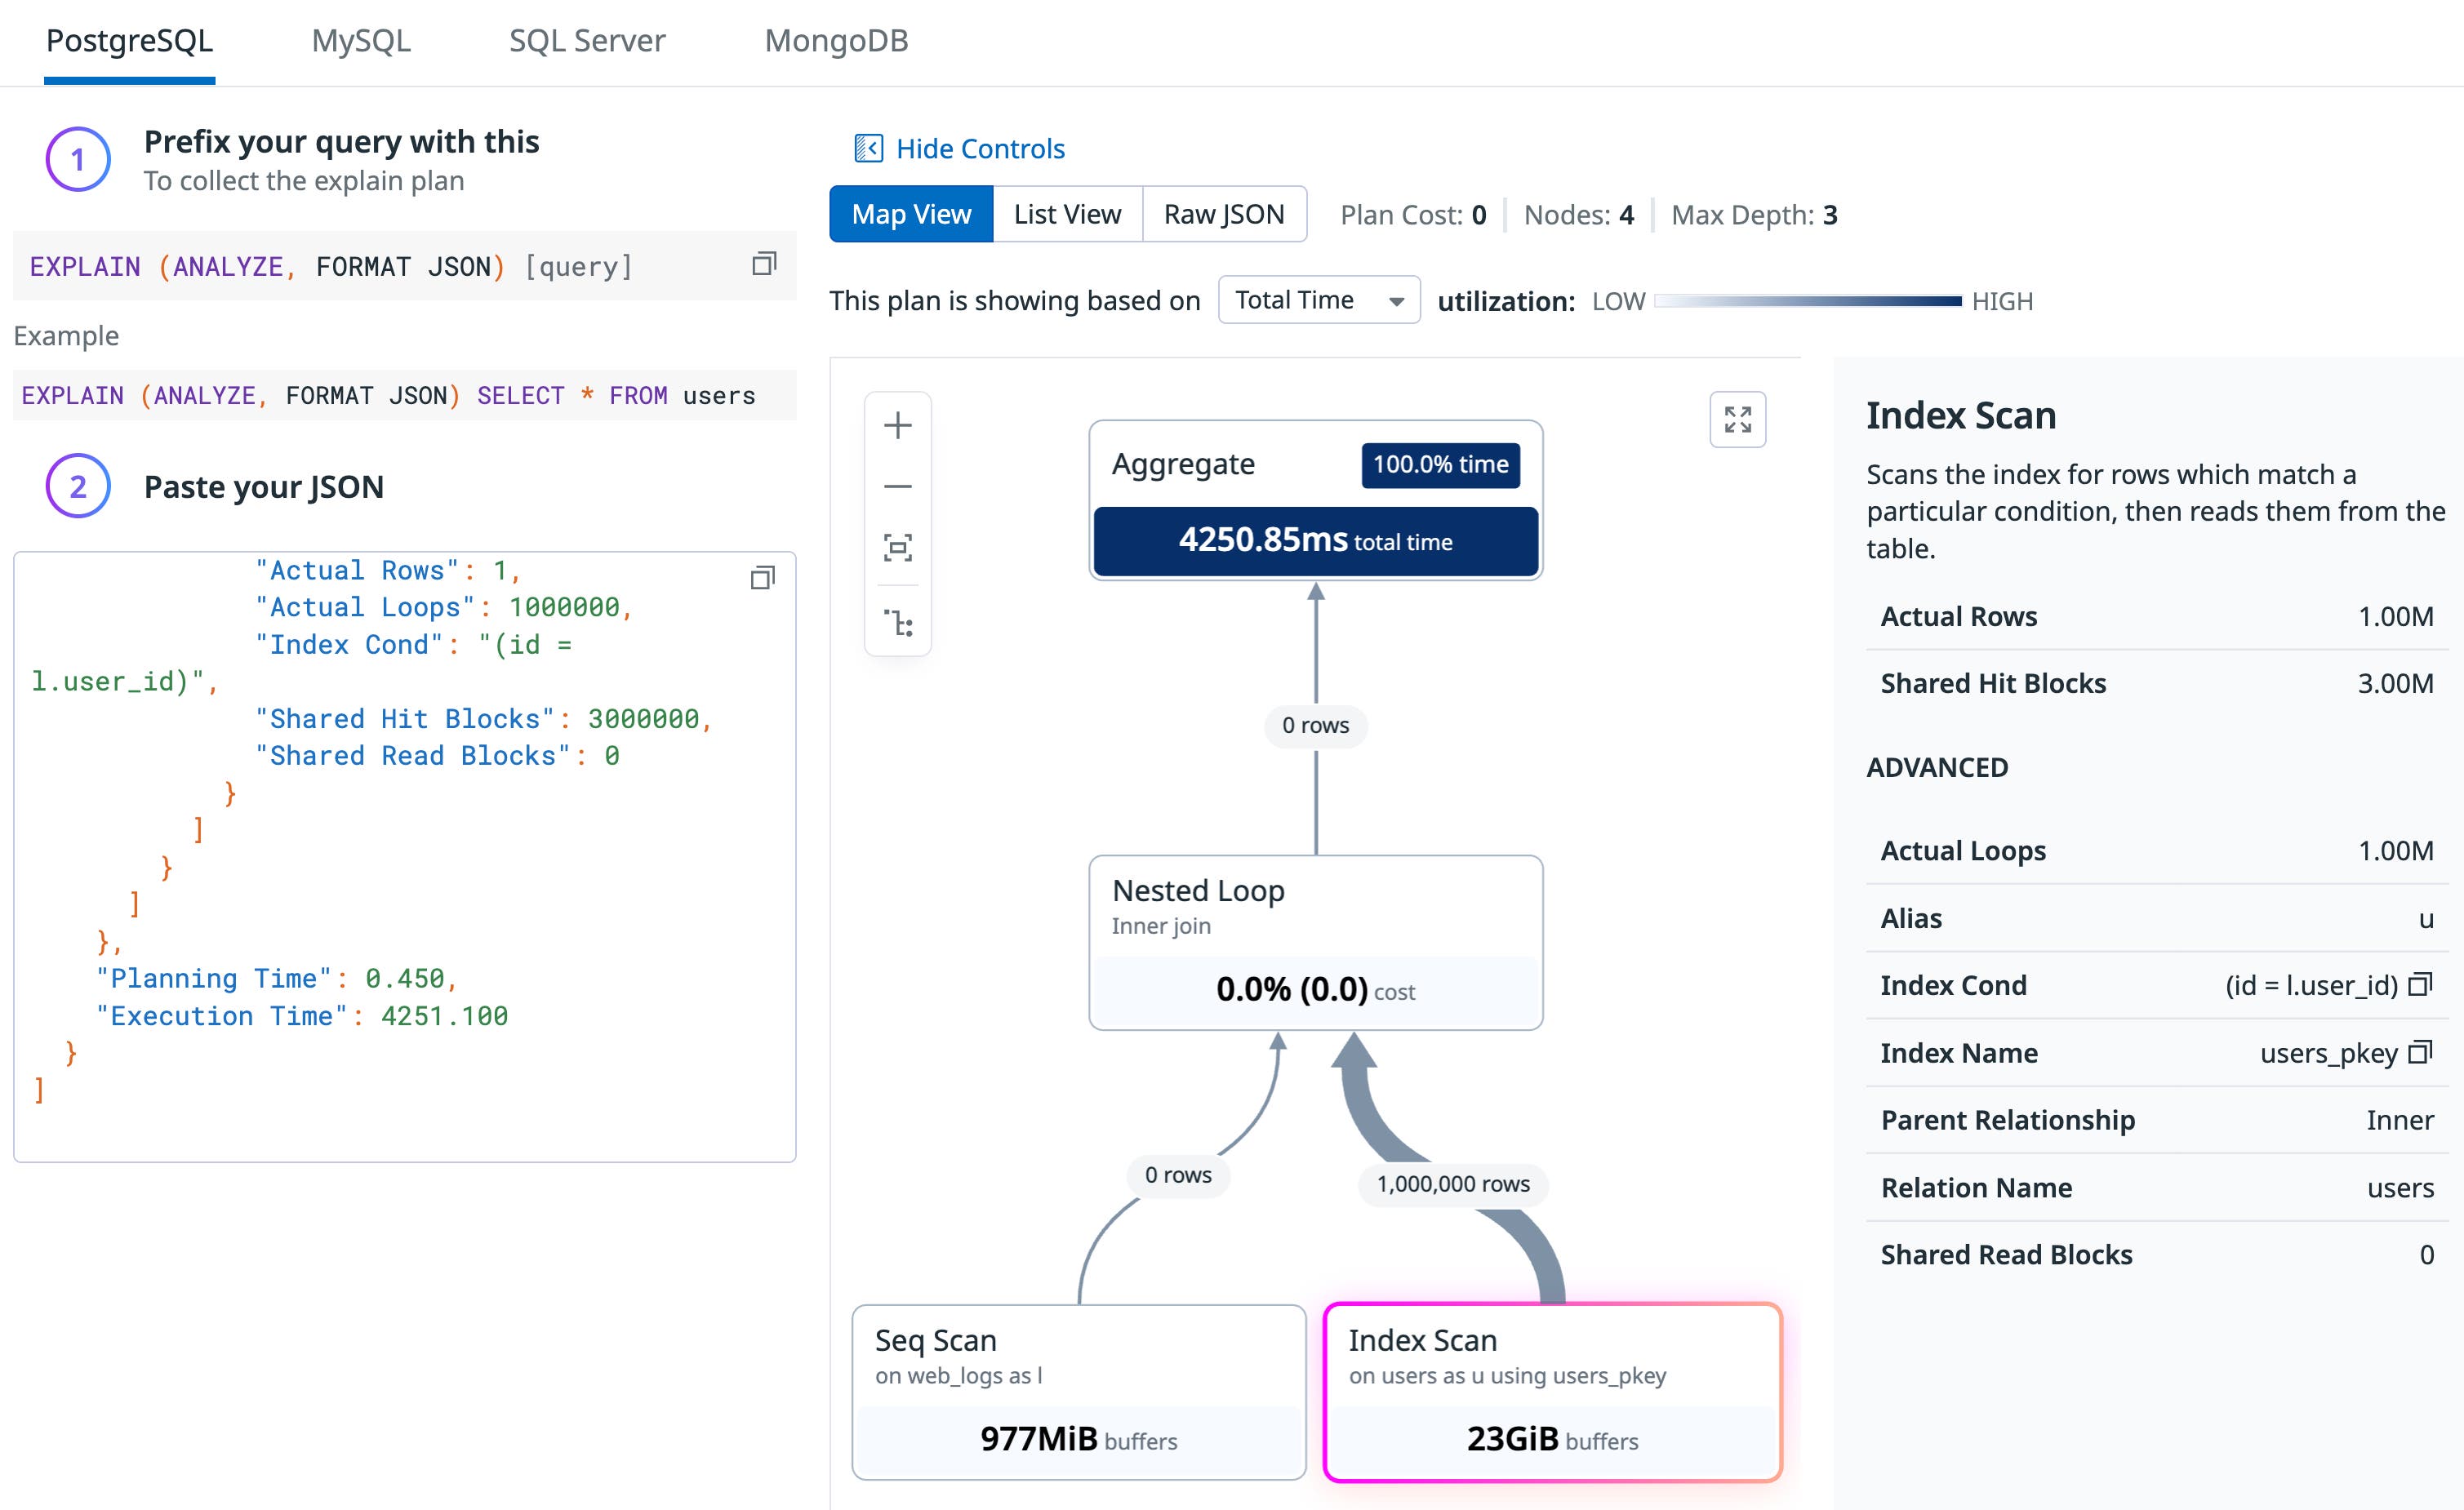
Alternatively, let’s say you are investigating a slow query, and the Index Scan from EXPLAIN ANALYZE reveals a Shared Hit Blocks value of 3.00M. This means the CPU had to look into the RAM cache three million times. As reported in the Shared Read Blocks value, zero blocks had to be fetched from disk, indicating that your RAM is large enough to support the query’s needs. Upgrading your hardware would provide no benefit here, which suggests that optimizing your query is your best bet.
Troubleshoot slow queries more easily with EXPLAIN ANALYZE plans in Database Monitoring
Database Monitoring can now automatically collect PostgreSQL execution plans to help you find the root cause of your query issues. This data is correlated with APM traces, enabling you to move from detecting an application performance issue to resolving a root cause of query latency all in one platform.
To get started with EXPLAIN ANALYZE with Database Monitoring, check out our documentation here. And if you don’t already have a Datadog account, you can sign up for a 14-day free trial.
