Nicholas Thomson
Technical Content Writer

Kevin Hu
As data systems grow more complex and data becomes even more business-critical, teams struggle to detect and resolve issues that impact data quality, reliability, and, ultimately, trust. Engineers have to rely on manual checks and ad hoc SQL queries to catch data quality issues—often after teams relying on the data have noticed something has gone wrong. But teams that take this piecemeal approach—using homegrown solutions that are fragile, hard to scale, and lack visibility into upstream context—spend more time firefighting data issues than preventing them. Meanwhile, existing data observability tooling focuses on data checks, which only flag surface-level issues and lack the context to trace problems back to their root causes in the data pipeline.
A complete approach to data observability ensures reliability across the entire data life cycle: from ingestion, to transformation, to downstream usage. It allows teams to detect, diagnose, and resolve issues in real time by monitoring key components of your data infrastructure, such as Kafka streams and Spark jobs, and validate data quality through freshness, completeness, and accuracy checks on data in warehouses like Snowflake. Data observability also extends to monitoring how data behaves in downstream applications, enabling teams to catch broken dashboards, delayed transformations, or incorrect analytics early. Gaining end-to-end visibility into data helps organizations maintain trust in data, reduce downtime, and build confidence in the systems, operations, and decisions built on data.
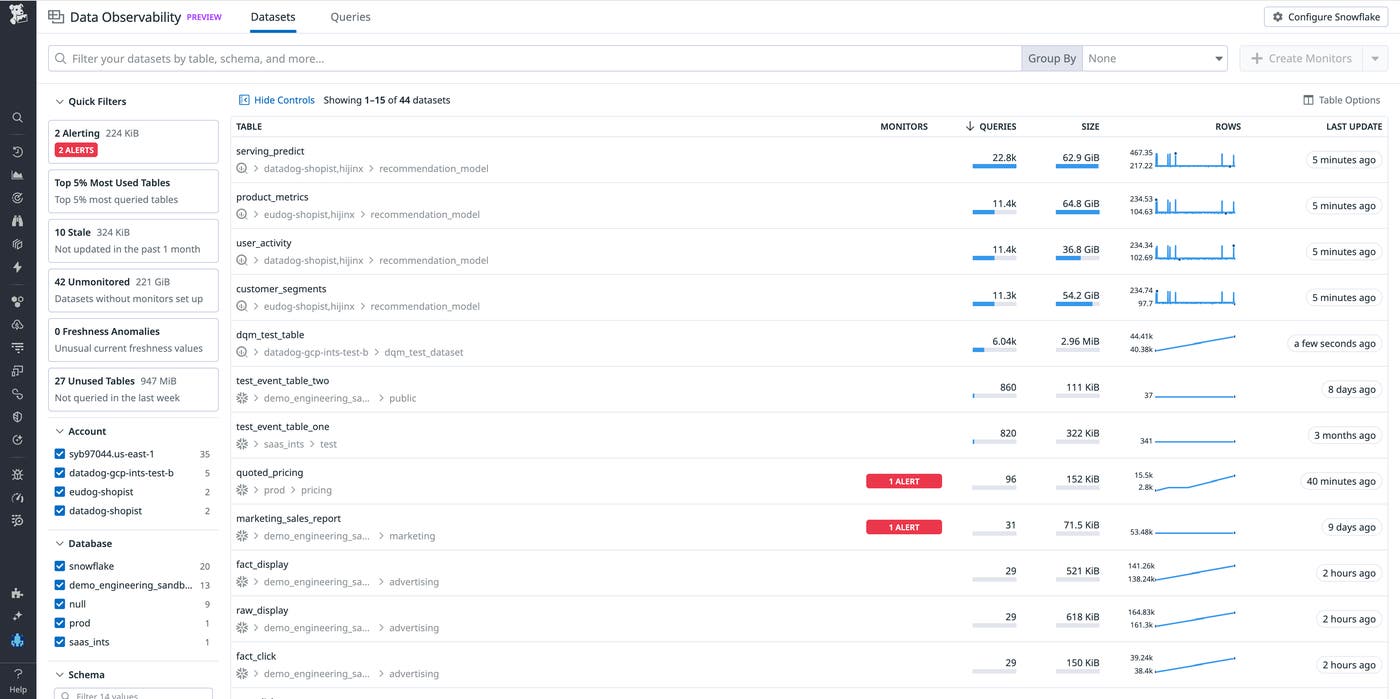
To help teams address these challenges, we're excited to announce that Datadog Data Observability is now available in Preview. Accelerated by our acquisition of Metaplane, Data Observability currently offers:
Out-of-the-box data quality checks into metrics like number of rows changed and freshness
Custom SQL checks to monitor business-specific logic in your warehouse
Machine learning anomaly detection that takes trends and seasonality into account, and is tailored to enterprise data quality standards to reduce noise
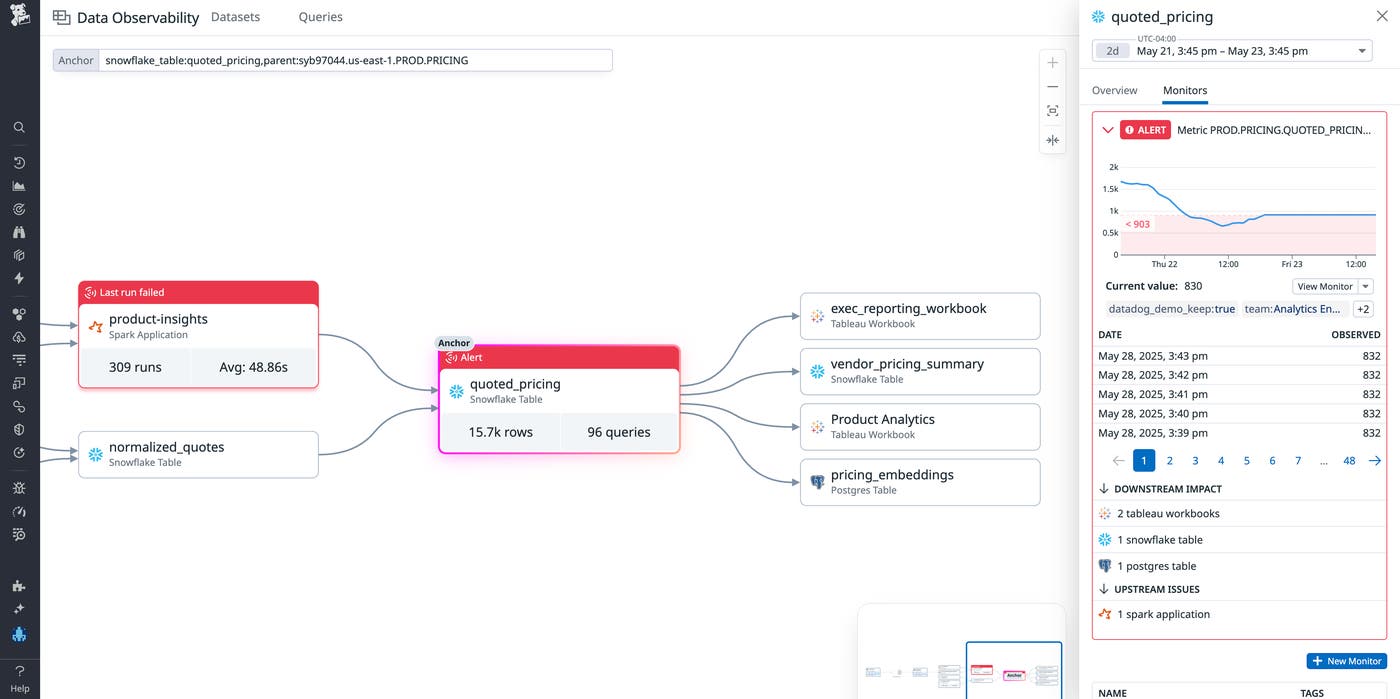
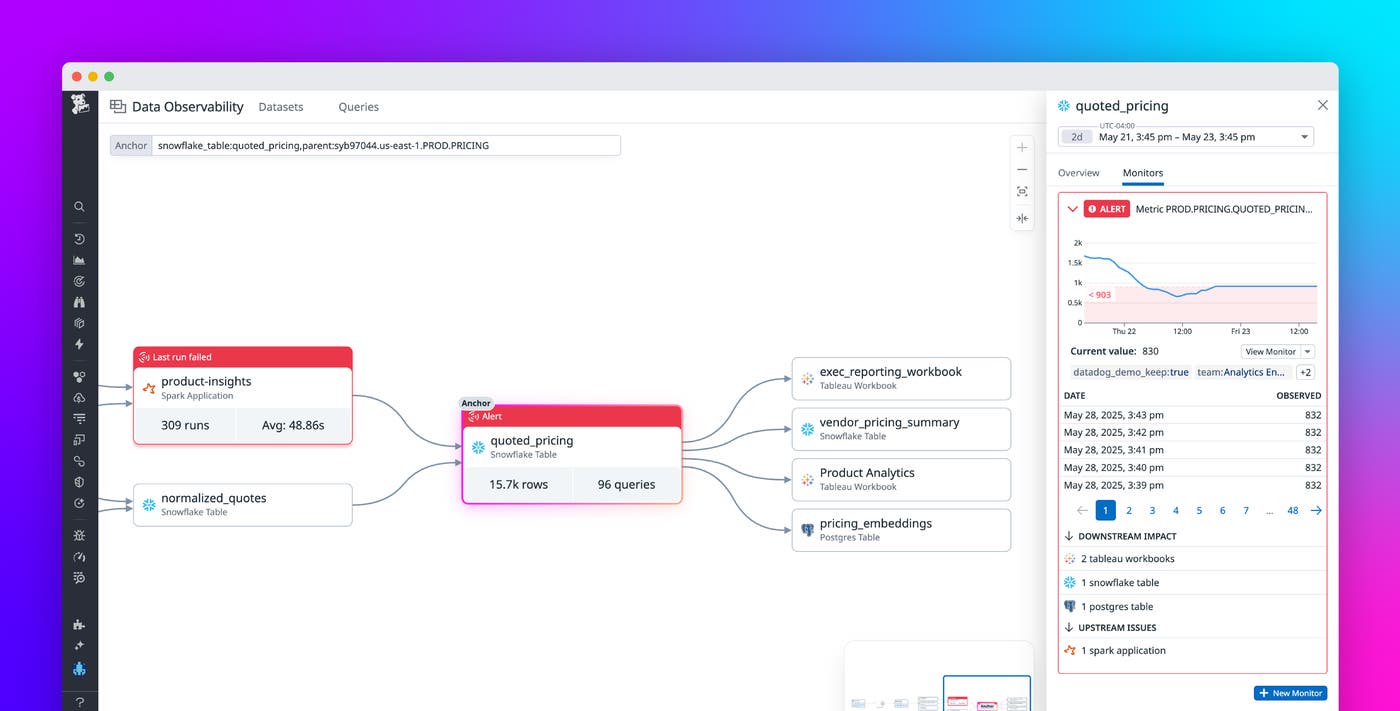
Lineage from the data warehouse to the places data is consumed (e.g., the ability to trace from a Snowflake column, to a Tableau field, to a dashboard)
The ability to connect the dots throughout your pipeline—for example, going from a BigQuery table to a Kafka stream to a Spark job
Configurable data alerts, so the right teams know immediately when data quality incidents occur, and are notified in the places they already work

In this post, we'll show you how to use Datadog Data Observability to:
Gain visibility into your datasets throughout the entire data life cycle
Improve incident analysis and response by bringing data engineers and software engineers together
Gain visibility into your datasets throughout the entire data life cycle
To ensure reliable insights, data teams need visibility across the entire data life cycle—from ingestion, to dashboards, to downstream AI systems. With Datadog Data Observability, you can trace data issues like freshness delays back to their source, enabling fast root cause analysis and coordinated recovery.
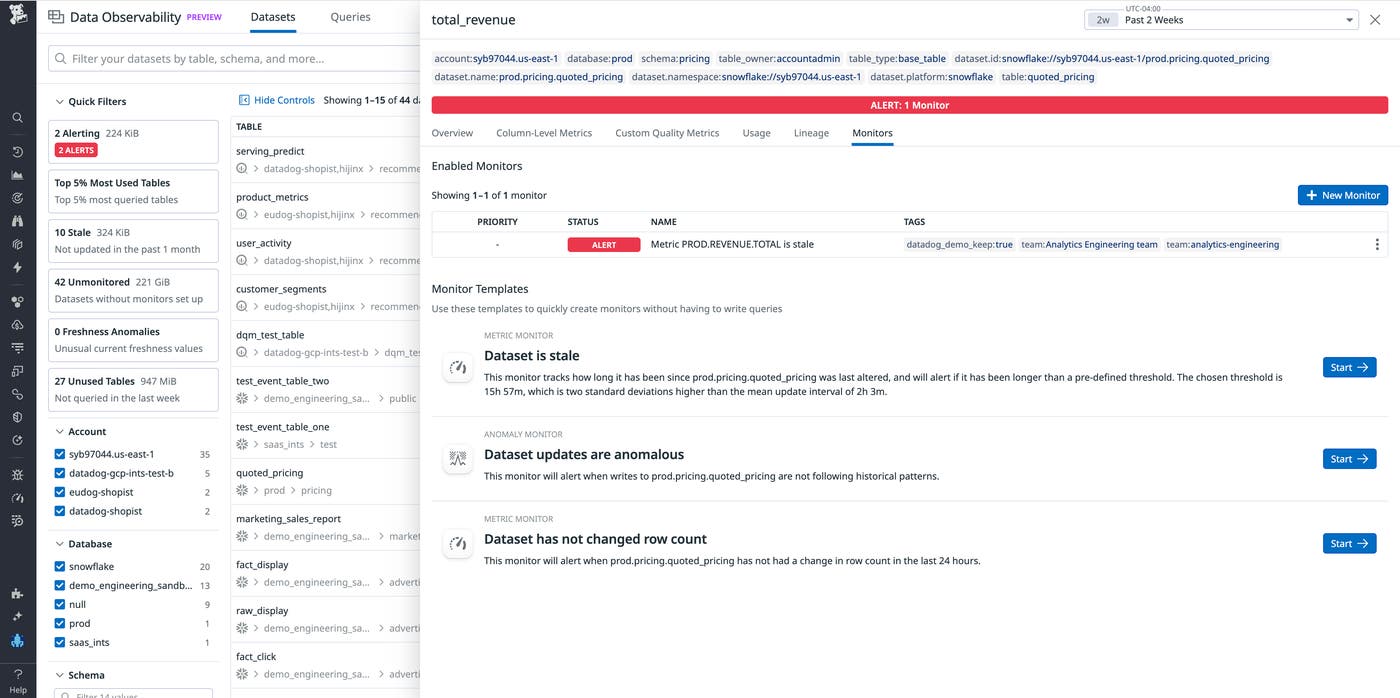
For example, let’s say you're a data engineer at a product analytics company that uses AI to derive insights into marketplace trends. You receive a Slack alert triggered by a Datadog monitor—there is a freshness issue with a key business-facing table. This query powers dashboards and downstream reports. You click the link in the alert to Datadog Data Observability, where anomaly detection confirms that the current dip in data freshness is an outlier compared to historical patterns.

Investigating upstream, you see that the Snowflake sales_data table depends on a pipeline that ingests data from Kafka and processes it using Spark Streaming. Datadog shows elevated consumer lag in the Kafka queue feeding this pipeline. You click into the Kafka queue and find that messages are backing up—Spark isn’t keeping up with the incoming data.
Digging deeper, you identify that the Spark job that reads from Kafka and writes to Snowflake is underprovisioned—it doesn’t have enough CPU to process data in real time. You scale up the resources allocated to the job, which increases throughput, reduces lag, and allows the backlog to be cleared. Within minutes, data freshness recovers, and the alert clears.
After resolving the upstream issue and observing that the Snowflake table is being updated again, you verify that Tableau visualizations, which query this Snowflake table, begin showing up-to-date revenue metrics without stale data warnings or gaps. In addition, you confirm that your vector database indexes, which rely on fresh Snowflake exports for embedding updates, have resumed ingesting the latest data—this will ensure relevance and accuracy in downstream AI-driven search and recommendation features. This end-to-end recovery confirms that the fix not only restored Snowflake freshness but also re-synchronized all dependent systems.
Improve incident analysis and response by bringing data engineers and software engineers together
Software engineers focus on pipeline infrastructure and system performance, while data engineers focus on data correctness, completeness, and usability. Collaboration between software and data engineers is often hindered by a lack of shared visibility into pipeline behavior and data quality. Datadog Data Observability bridges that gap by providing end-to-end observability across infrastructure and data layers, with built-in metrics for freshness, schema changes, and anomalies. This makes it easier for teams to catch and resolve issues—like silent schema drift—before they impact business-critical dashboards.
Datadog Data Observability provides a shared source of truth across the stack, from ingestion to downstream analytics. This includes metrics such as:
Freshness (how up-to-date the data is)
Volume (expected vs. actual records)
Schema changes (e.g., added or missing columns)
Distribution anomaly detection (e.g., unexpected spikes or drops in the average of a metric)
Uniqueness (e.g., for primary keys)
Nullness (e.g., for identifiers)
For example, say a data engineer is alerted to an unexpected drop in daily revenue for a key product category, despite no known marketing changes, inventory issues, or seasonal fluctuation. Datadog Data Observability reveals a schema drift event occurred: In the upstream service purchase-processor, from which the data is written into the Snowflake table quoted-pricing, someone changed the name of a critical field from product_category to category_name. The field name change was not handled downstream in the Spark transformation or Snowflake ingestion logic. The pipeline continues to run, but the column expected by the dashboard (product_category) is now null in the latest data.

With this knowledge in hand, the data engineer can raise the issue with a software engineer, who can map the old field to the new one so that fresh data can stream into Snowflake. In the meantime, the data engineer can update the dashboard using custom SQL logic that aliases product_category as category_name.
Monitor the whole data life cycle with Datadog Data Observability
In this post, we've shown you how Datadog Data Observability can help you gain deep visibility into the entire data life cycle and break down silos between data teams and software teams. Along with monitoring datasets, the Datadog Data Observability suite also helps with monitoring streams and jobs.
If you want to ensure trust in the data that powers your business, you can sign up for the Preview. To learn more, check out our dedicated blog post on monitoring the data life cycle. Or, if you’re new to Datadog, sign up for a free trial to get started.

