Conor Branagan
Monitoring all of the components in an application stack on a daily basis can become highly time consuming - to the point where this task often doesn't happen. Yet, ignoring environment performance is like turning one's back to the ocean - you don't realize that the conditions leading up to a performance problem are developing until the issue hits, and the devops team goes into fire-fighting mode.
To streamline the daily monitoring of an application and its infrastructure, we're pleased to announce today the release of new Daily Digest functionality available in Datadog. Datadog users will now be able to take in the “highlights” from yesterday's environment performance for databases, servers, services and support apps, on a single page with a post mortem review that can be digested in seconds (pun intended).
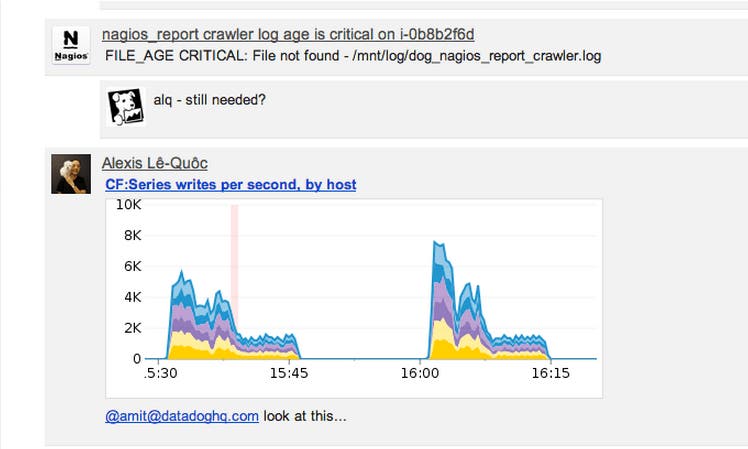
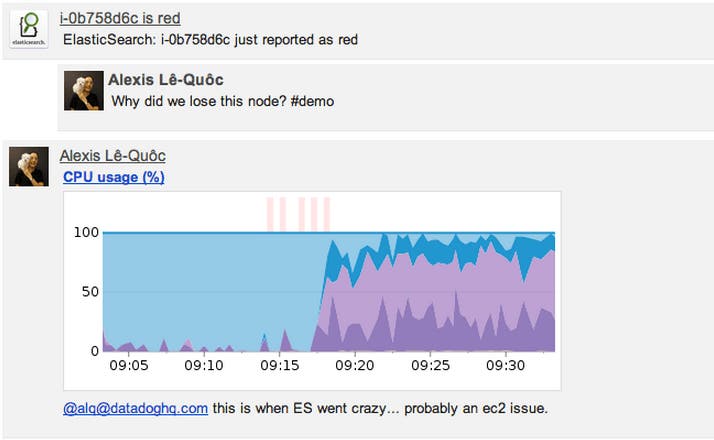
The Daily Digest gives a quick overview of what's happened on your Datadog account in the last day through an email that show:
Metric Alerts that were triggered through Datadog
Graphs shared by your team to pinpoint unusual or interesting app performance
Corresponding team discussions or resolution
Starting tomorrow we will enable the Digest for all accounts with an easy opt-out if you find it's not useful for you. You can try out the Daily Digest in your own infrastructure for free by signing up for an account.


Current Datadog users should expect their first digest tomorrow. Let us know what you think. We hope you like it.

