Marcus Hirt

JC Mackin
Developers have long used profilers to diagnose performance bottlenecks and improve the efficiency of their code. But a modern version of profiling, continuous profiling, is quietly redefining what profiling is and what it can do. By running nonstop in production with very low overhead, continuous profilers give teams always-on visibility into how their code behaves in the real world. And when that data is correlated with other telemetry signals like metrics, traces, and logs, it helps teams troubleshoot complex issues, speed up investigations, and improve release velocity.
In this post, we’ll explore how profiling has evolved from a rarely used troubleshooting technique into a core observability practice. We’ll discuss how, in using Datadog Continuous Profiler internally, we’re seeing new benefits from profiling that are echoed in reports from many of our customers. Along the way, we’ll make the case that continuous profiling is becoming a fourth pillar of observability, an essential tool that helps teams quickly build, maintain, and iterate on applications in today’s competitive environment.
Continuous profiling != traditional profiling
Most people understand software profiling to refer to the practice of using tools to examine how software behaves during execution. While many associate it specifically with CPU profiling, it encompasses a range of techniques (including various forms of memory and off-CPU profiling) that are designed to solve different performance problems.
Continuous profiling is a powerful new type of profiling that is not as well understood, and that is sometimes even misunderstood. To understand why it represents such an important development for profiling, it helps to look at the history of profiling to see how it was originally used.
The challenges of early profiling
In the early days of computing, profiling was a niche activity, undertaken only when a serious performance issue arose. With profilers like gprof (GNU profiler, introduced in 1982), profiling was a manual process that required you to compile a special, instrumented version of your binary. However, the overhead of these profilers was significant. Every function was instrumented to generate information about the number of invocations (how many times each function was called) and to record the caller/callee relationship (which functions called which).
Later, with sampling profiling tools like VTune, profiling was still very much a manual undertaking. You would typically run your application locally with the profiling application, start the profiler, collect data, and then stop the profiler to analyze the collected data. For engineering teams, the common way to use these profilers was to run the instrumented binary in a testing environment and gather as much profiling data as possible.
But applications don’t behave in testing environments like they do in production environments, especially when the execution is slowed down by old-school, resource-intensive instrumentation in the code. As a result, if performance issues were experienced in production, developers would have to devote unusually extensive efforts to reproduce them in an accurate way in testing and capture them with a profiler.
The challenging nature of early profiling helps explain why it came to be seen as a high-effort, high-overhead, and low-reward task. And while that outdated perception might still linger, profiling has now evolved into something fundamentally new.
Profiling in the modern software landscape
Fast-forward to the present day, and the software landscape has changed dramatically. The software we analyze today is typically not a monolithic program running on a single machine. Most applications now consist of many services communicating with each other, sometimes developed by different teams or even different companies. With CI/CD, releases often happen several times a week or even several times per day instead of a few times a year.
Though CPU utilization is still a concern, it is no longer the only profiling information developers track to improve software performance. What can be even more important is to understand why the program is not scheduled on CPU. This can be determined through techniques like wall clock profiling, and by gaining visibility into the usage of limited resources, such as locks and monitors, stop-the world operations (e.g., garbage collection–related activity, the global interpreter lock), and other execution model constructs that vary based on the programming model, language, and runtime. Surfacing all this data makes profiling useful for detailed problem resolution, not just for improving CPU efficiency.
The advantages of continuous profiling
Enter today’s continuous profiling. Continuous profilers continuously collect information about the runtime behavior of your application, even if it is composed of thousands of microservices. Because they run in production, continuous profilers provide more accurate data about the actual behavior of the application being profiled. What’s more, profiling data is always available when application behavior changes. There’s no longer a need to painstakingly reproduce the issue; you simply need to look at the profiling data to diagnose what has gone wrong.
Because they are running all the time, a design requirement of continuous profilers is that their overhead needs to be low. Low overhead means that continuous profilers can be used alongside other monitoring tools, which is a crucial advantage. Unlike traditional code profilers, continuous profilers capture telemetry data that can be combined and correlated with any metrics, traces, and logs that are captured in production at the same time. The result is a more comprehensive view into real-world application performance, which ultimately broadens the range of problems that teams can solve.
As an example of how profiling data can be combined with other telemetry data, the following screenshot shows an APM trace for a specific request (GET /correlate) being associated with profiling data from Continuous Profiler. The tracing data for the GET /correlate request is shown at the top, and the profiling data associated with the trace is shown at the bottom.
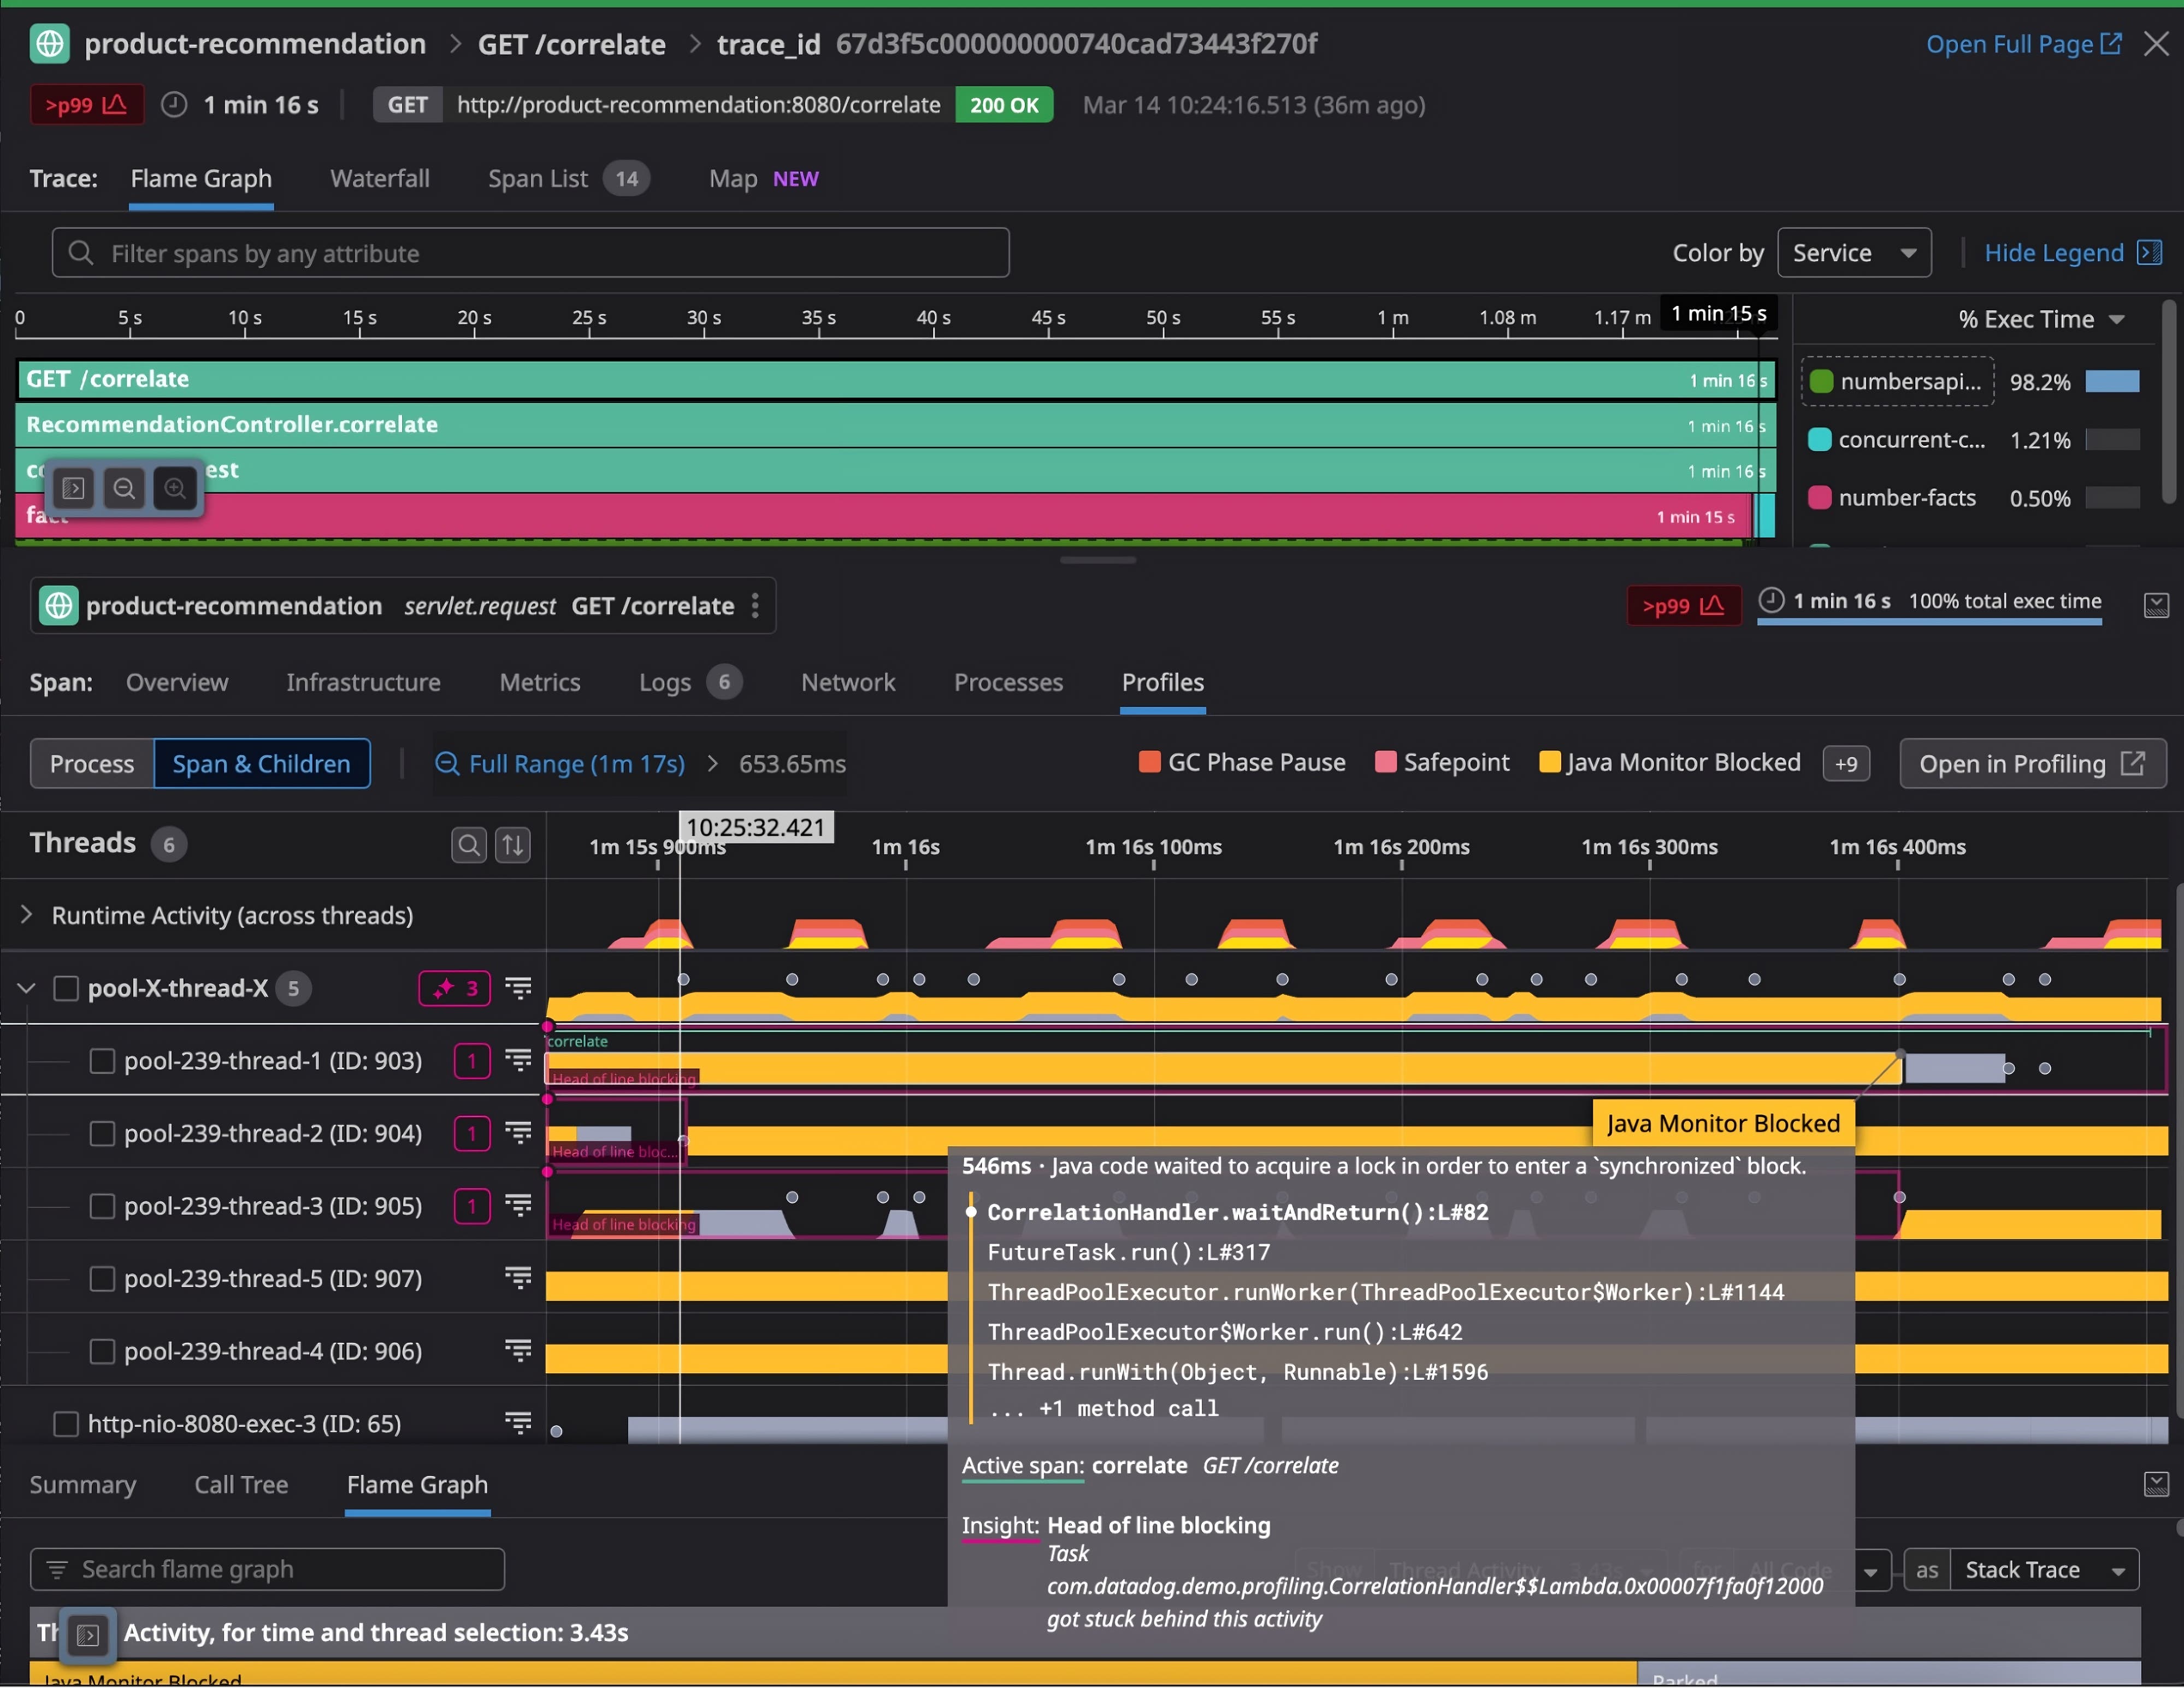
Let’s say you are trying to diagnose latency within the trace. The correlation with profiling data lets you direct your investigation to the exact runtime behavior during that request. In this case, it reveals that threads were blocked on monitors (marked by the prevalence of yellow). This correlation of traces with profiling data provides a clear pathway to move your investigation from high-level APM signals to low-level performance diagnostics as you try to resolve the latency issue. Without continuous profiling’s low overhead, it would not be possible to have all this different telemetry data available or, as a result, transition your investigation from traces to profiles so easily.
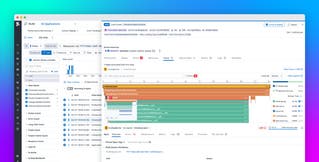
After the example above showing how profiles can shed light on traces, below you can see an example showing how trace data can shed light on profiling data. In this case, to the right of the flame graph, you can see the CPU time for the product-recommendation service broken down and aggregated by endpoint (connecting the profiling data back to trace data). You could use this information as a launching point, for example, to study the CPU characteristics for any particular endpoint by filtering on the data for that endpoint.
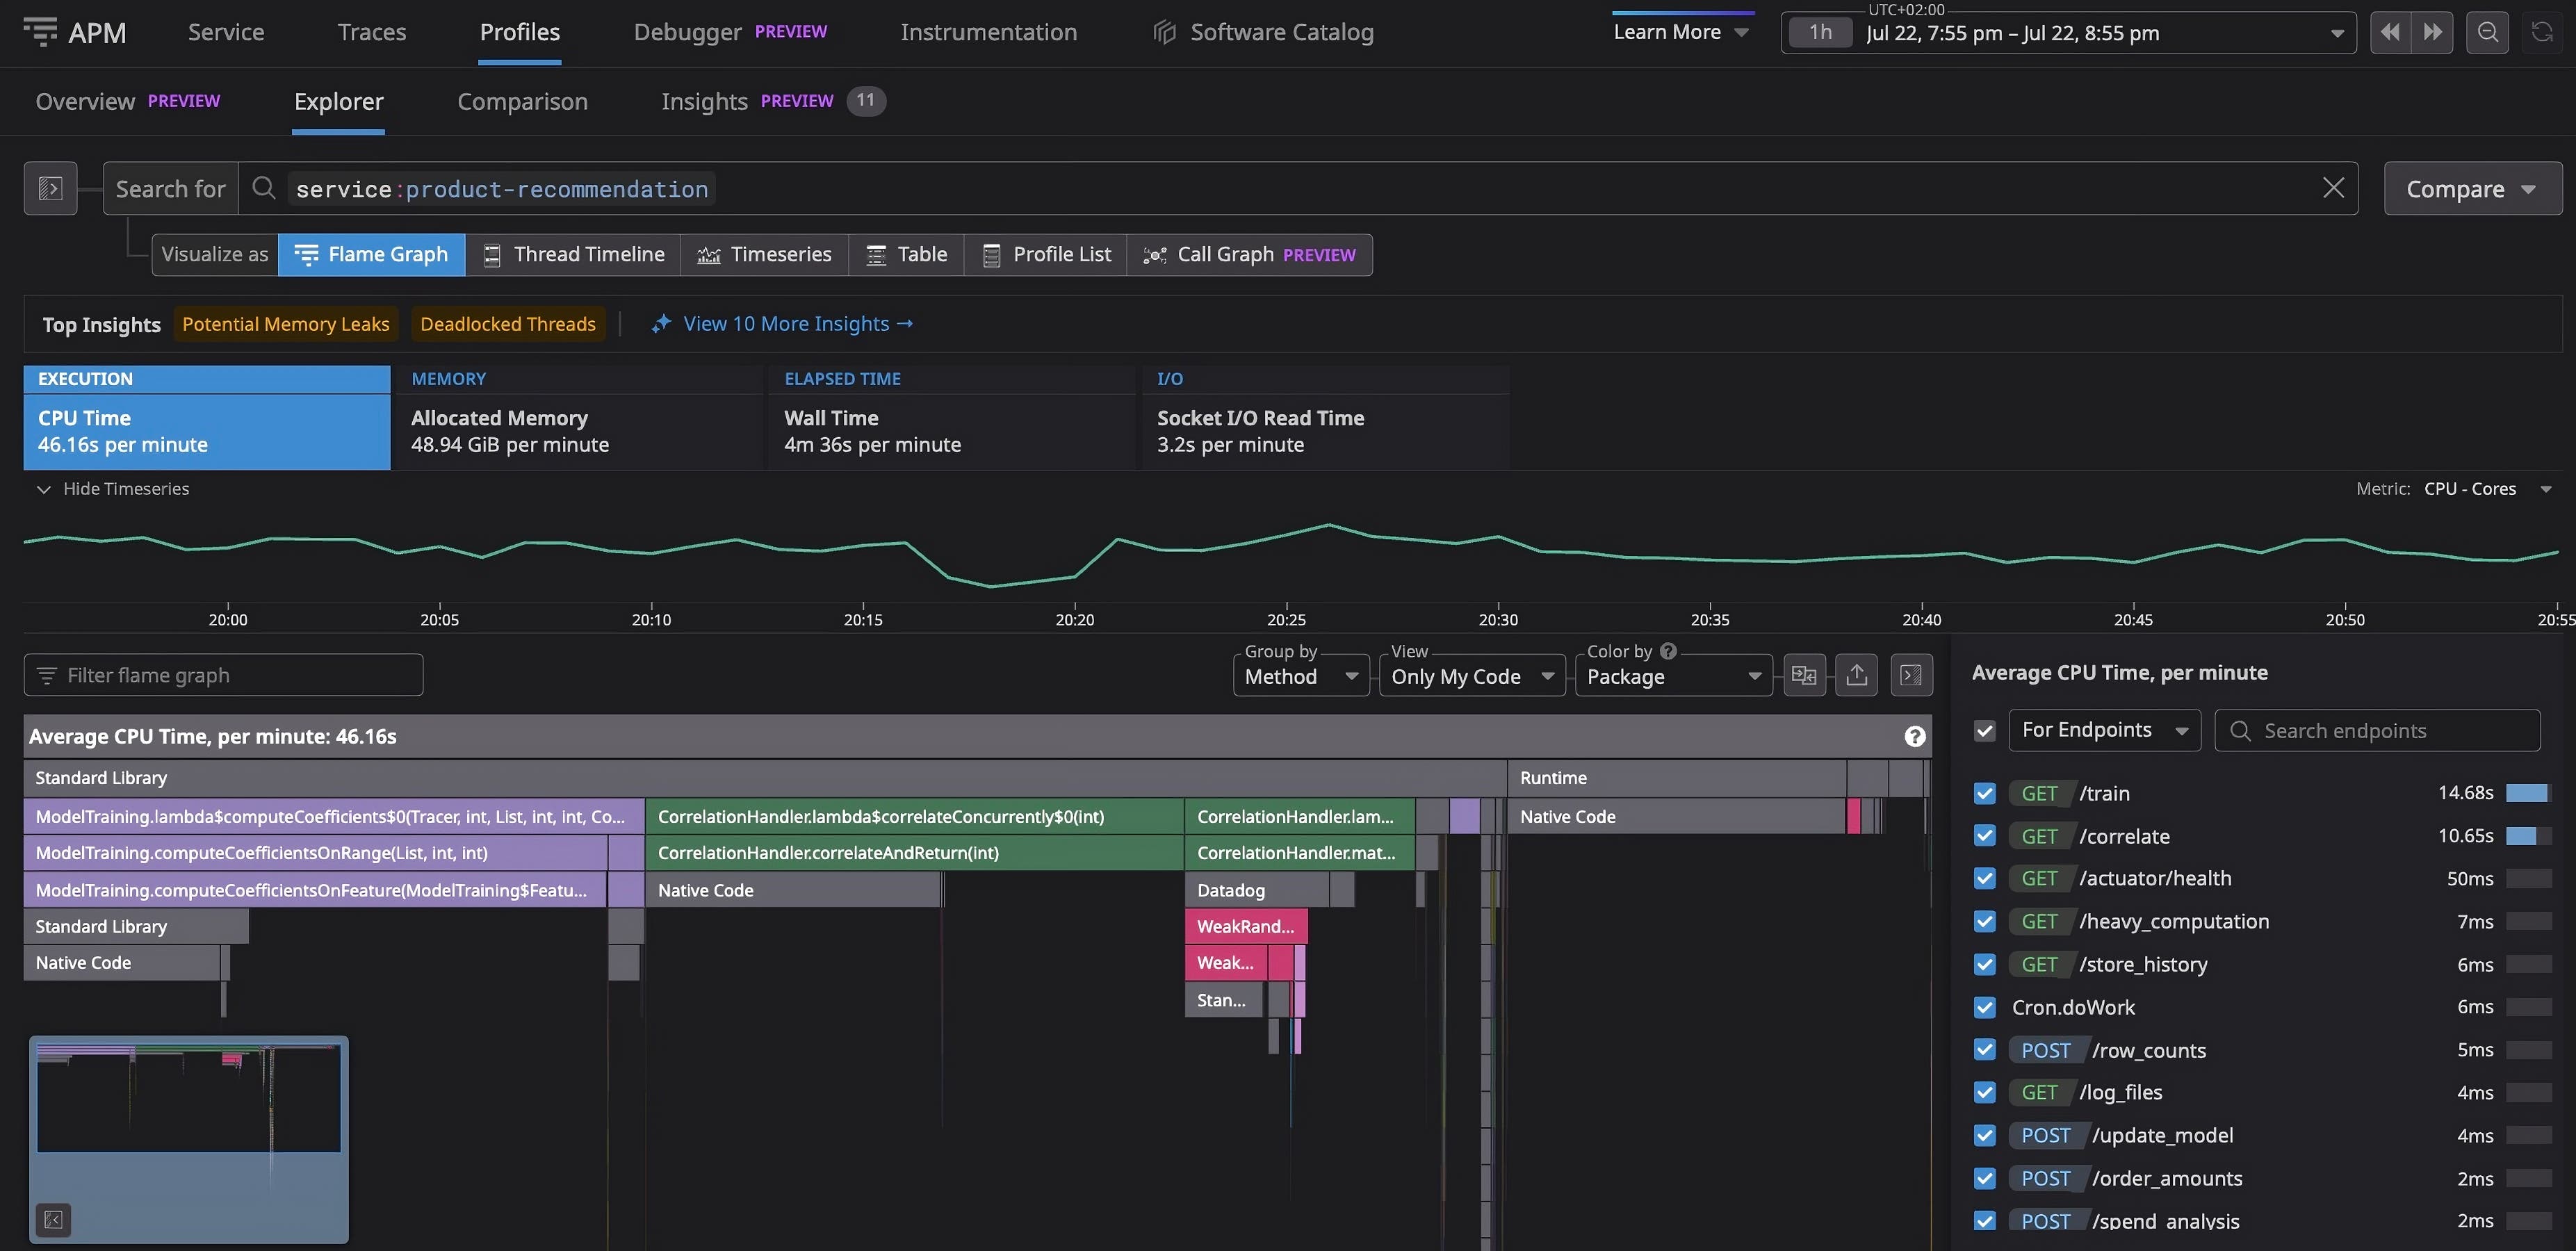
These are just two examples of how providing the context of distributed operations to the profiling samples can help make the profiling data much more useful and easier to reason about.
Industry adoption and standardization
Because of its obvious advantages and low resource demands, continuous profiling is becoming mainstream. One sign of its growing importance is seen in developments within OpenTelemetry. Traditionally, OpenTelemetry has had three main signals for observability: metrics, logs, and tracing. But significantly, it now also has a signal group for continuous profiling and is working to make continuous profiling the fourth signal. Datadog is actively assisting OpenTelemetry in this effort by helping establish standardized formats for profiling data and contributing to improvements in profiler implementations.
Continuous profiling at Datadog
At Datadog, we have had great success implementing continuous profiling across our own services, including saving $17.5 million in annually recurring costs by using Continuous Profiler, along with other Datadog tools. Thanks to continuous profiling, we also save millions of dollars every year by detecting performance regressions early and improving the way our services execute. We also save time, along with development costs, by resolving problems quickly. This helps us move faster and provide a better customer experience.
Thousands of Datadog customers that are running Continuous Profiler in their production systems have had similar successes. One interesting fact is that many of them aren’t even listing cost savings or performance gains as the main reasons for using continuous profiling. The benefits we’re hearing about from them, in fact, are typically about release velocity and mean time to resolution (MTTR).
Continuous profiling is a core component of observability
Thanks to continuous profiling, profiling has evolved into a key observability practice, used alongside metrics, logs, and traces to help teams understand and improve application behavior. Importantly, as the quantity of AI-generated code in services increases, tools like Continuous Profiler will play an increasingly vital role in helping teams gain visibility into the runtime behavior of their production code. Moving forward, we believe the growing importance of profiling alongside traditional observability practices will lead to more efficient and better-designed systems that will be easier than ever to maintain.
To learn more, see our Continuous Profiler documentation. If you’re not yet a Datadog customer, sign up for a 14-day free trial.

