


Paul Gottschling
In Part 1, we walked you through key metrics for monitoring Consul, and in Part 2, we showed you how to use Consul’s built-in monitoring tools to get insights from your cluster. In this post, we’ll show you how you can use Datadog to visualize your Consul metrics in custom dashboards, analyze your Consul logs, and set up alerts on your cluster’s availability and performance. With more than 1,000 integrations, Datadog gives you deep visibility into Consul—and all of the applications that rely on Consul for service discovery and dynamic configuration—in a single platform. We’ll explain how to:
- Set up the Consul integration
- Use Datadog dashboards to get visibility into multiple components of Consul—and the rest of your system
- Collect, search, and analyze Consul logs
- Alert on unhealthy nodes and volatile leadership with Consul monitors
Get started with Datadog and Consul
The Datadog Agent is open source software that runs on your hosts, reporting metrics, traces, and logs to Datadog. There are two methods the Datadog Agent uses to gather metrics from Consul, and you can configure one or both of them depending on the data you would like to collect.
First, you can configure Consul to send metrics directly to the Datadog Agent as one of the telemetry sinks we explained in Part 2. These are the metrics that Consul uses to report its internal behavior, and includes those we introduced in Part 1.
Second, the Agent queries Consul’s HTTP API and uses the results to generate metrics about node and service status (i.e., whether they are up, passing, warning, or critical) as well as network latency (based on Consul’s network coordinates API). These metrics are useful for tracking the state of nodes and services within your Consul cluster.
To install the Agent on each of your Consul hosts, follow the instructions for your environment within your Datadog account.
Push Consul-generated metrics to the Datadog Agent
The Datadog Agent ingests metrics with an aggregation service called DogStatsD, and you will need to provide the address of this service to Consul. For each host you’d like to report metrics to Datadog, add the following to your Consul configuration (assuming DogStatsD is running locally on your Consul host):
"telemetry": { "dogstatsd_addr": "127.0.0.1:8125"}This instructs Consul to declare a metrics sink for DogStatsD with the Golang package it uses to expose metrics, meaning that any metrics Consul generates will go to DogStatsD in addition to the default in-memory sink and any other metric sinks you have enabled.
The DogStatsD sink uses the DogStatsD client for Golang to flush metrics every 10 seconds to Datadog, where they are retained for 15 months (whereas Consul’s default in-memory sink only has a one-minute retention period). Make sure to stop and restart Consul (rather than running consul reload) after changing your telemetry configuration, taking care that the -config-file or -config-dir options of the consul agent command include the path to the configuration file you just edited. Once it’s running, Consul will start sending metrics to the Datadog Agent.
Consul’s internal metrics are namespaced, and use dots to delimit hierarchies of concepts. For example, consul.http.GET.v1.kv._ tracks how long (in milliseconds) it takes the KV store’s API endpoint to handle requests. The Datadog Agent can extract tags from these namespaces so you can group your Consul metrics more meaningfully. With the consul.http example above, you could compare response latencies across all of Consul’s API endpoints to see if slow queries are due to your configuration—e.g., you’ve enabled blocking queries for certain endpoints—or resource contention on your Consul hosts. Follow our documentation to see how to configure the DogStatsD Mapper to start parsing your ingested Consul metrics.
Pull API-based metrics from Consul
You can configure the Datadog Agent to query Consul’s API by editing the conf.yaml.example template file in the consul.d subdirectory of your Datadog Agent (the location varies across platforms—refer to the docs). Copy and rename this file as conf.yaml, and update it with the location of your Consul HTTP server.
You can edit conf.yaml to collect additional metrics and events from Consul using options such as the following:
self_leader_check: true: emit events when a new leader is electednetwork_latency_checks: true: collect the estimated duration of requests from a given node to otherscatalog_checks: true: query the Consul catalog for counts of nodes and services; metrics will be tagged bymode:leaderormode:follower(as applicable), meaning that you can use these metrics to alert on the loss of a leader
After making your changes, conf.yaml should resemble the following. You can find a full list of options within conf.yaml.example.
init_config:
instances: - url: http://localhost:8500 self_leader_check: true network_latency_checks: true catalog_checks: trueDatadog allows you to group and filter data using tags. The Consul integration tags all metrics with consul_datacenter, and we have shown how certain Consul metrics are tagged with mode:leader or mode:follower.
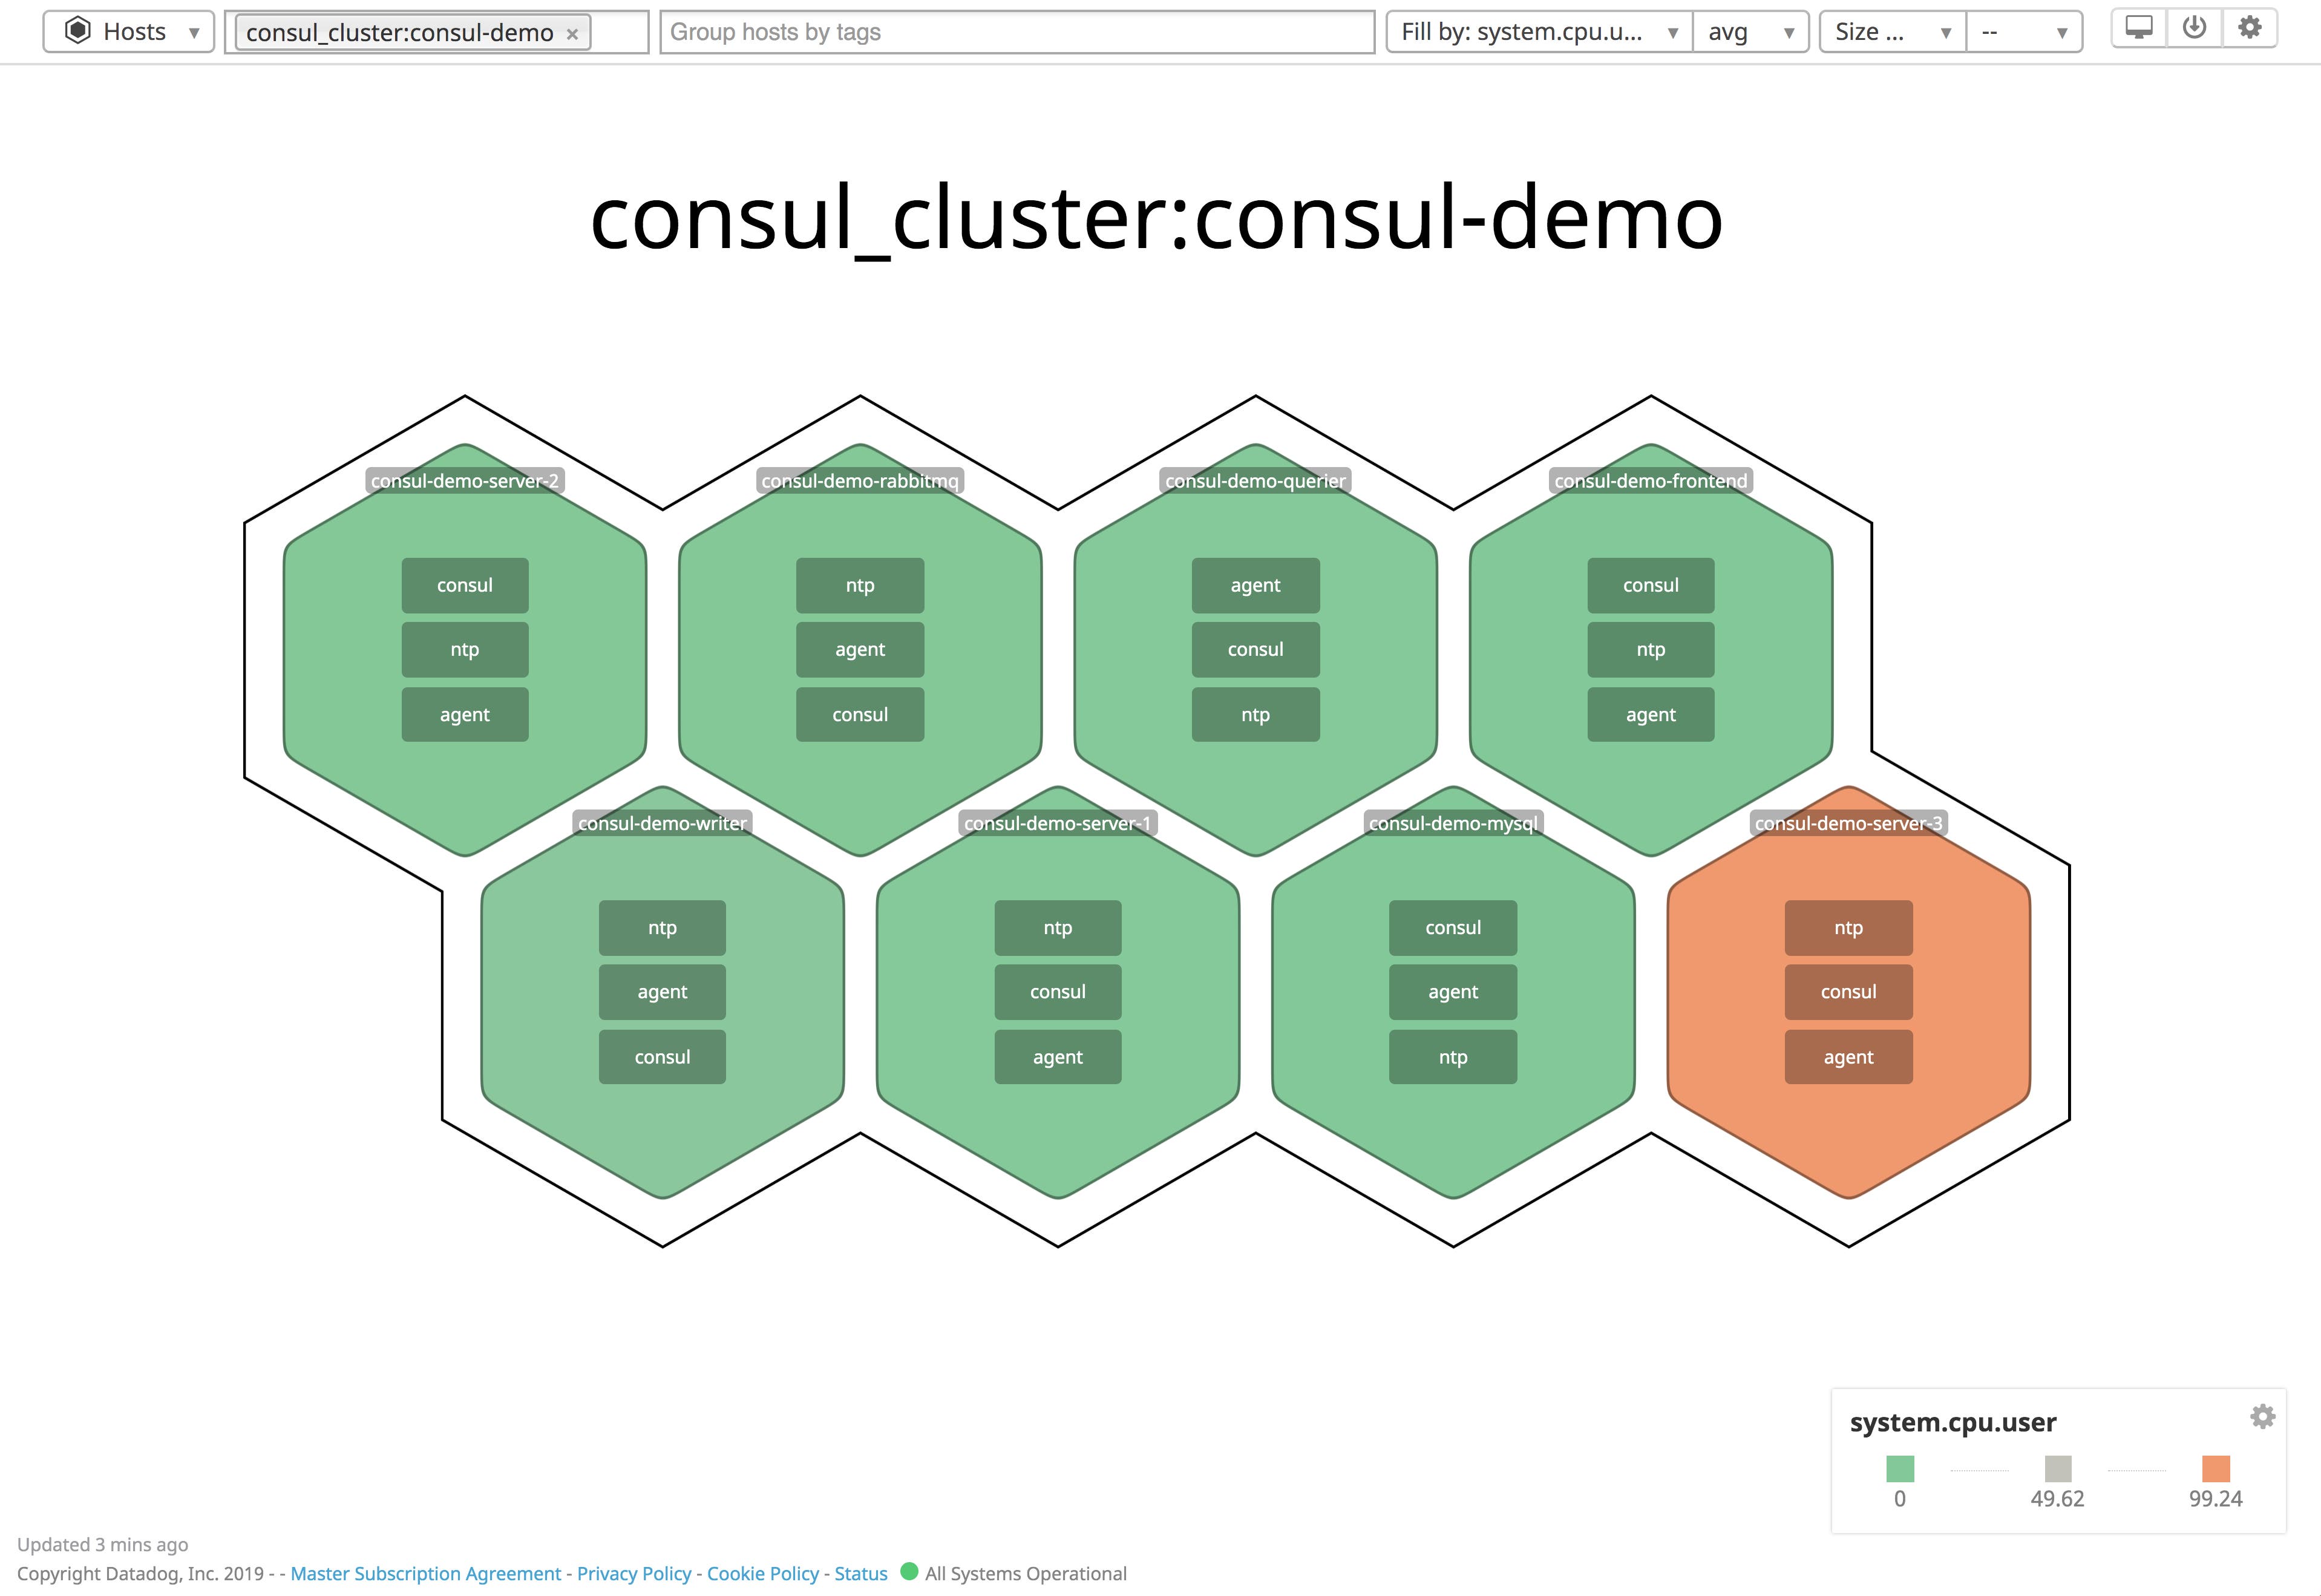
You can also configure the Datadog Agent to tag all of the metrics from its local host, helping you isolate host-level metrics from your Consul cluster when creating alerts and visualizations. To do this, add a custom key-value pair to the tags section of your Agent configuration file (datadog.yaml). The Host Map shown below uses the host-level consul_cluster tag to visualize CPU utilization per host in the cluster.
tags: - consul_cluster:consul-demoRestart the Datadog Agent to apply these configuration changes.
Enable log collection
Consul’s logs provide insights into internal operations such as membership changes and the status of Raft elections (see Part 2), and aggregating and analyzing these logs with Datadog can help you diagnose issues. To enable log collection, revise your Datadog Agent configuration file (datadog.yaml) to include the following:
logs_enabled: trueThen update the logs section of your Consul integration configuration file (e.g., consul.d/conf.yaml) to include the following:
instances:
# [...]
logs: - type: file path: <CONSUL_LOGS_DIRECTORY_PATH>/* source: consul service: <SERVICE_NAME>This configuration instructs Datadog to tail one or more files at the specified path. Consul automatically adds a timestamp to the name of the log file and rotates it every 24 hours (this is configurable). You can use a wildcard to configure Datadog to tail all log files (regardless of their names) within the chosen directory.
Specifying a source is mandatory, and activates the out-of-the-box processing pipeline for Consul logs. The service key (which is also mandatory) adds a service: tag that you can use to group and filter your logs. You can also use this tag to correlate your Consul logs with metrics as well as distributed traces of requests to your applications. This can either be consul or a more specific categorization of your Consul deployment, such as consul-client, consul-server, or consul-demo.
Once you’ve edited your configuration YAML, make sure the dd-agent user has read access to your log files, then restart the Datadog Agent to apply the changes. You can verify that the Agent is reporting to Datadog by running the status command and looking for the consul section.
Enable network monitoring
Monitoring Consul networking allows you to visualize dependencies within your cluster, plus the latency and volume of traffic. To enable Network Performance Monitoring (NPM), see the NPM setup documentation for guidance on configuring your hosts, containers, Kubernetes clusters, or ECS clusters.
If you’re using Consul with Kubernetes, NPM requires you to add the appropriate annotations to your pods and environment variables to your containers. The code snippet below shows a Deployment manifest that contains this information.
apiVersion: apps/v1kind: Deployment[...] template: metadata: annotations: consul.hashicorp.com/connect-inject: "true" consul.hashicorp.com/connect-service-upstreams: 'web:9091' consul.hashicorp.com/transparent-proxy-exclude-inbound-ports: "9090" consul.hashicorp.com/transparent-proxy: "false" admission.datadoghq.com/enabled: "true" ad.datadoghq.com/envoy-sidecar.tags: '{"service": "envoy"}'[...] spec: containers: - name: "<CONTAINER_NAME>" image: "<CONTAINER_IMAGE>/<TAG>" env: - name: TRACING_DATADOG_HOST valueFrom: fieldRef: fieldPath: status.hostIPAdditionally, you’ll need to update your Consul config to include extraConfig and extraLabel items that contain the necessary values as shown in this gist. You’ll also need to set your services’ ProxyDefaults configuration entry as shown here.
Real-time views of Consul cluster health
Consul clusters are complex, and having an overview of all the components in a single view can help you identify patterns and isolate issues. Datadog provides a number of ways to visualize your entire cluster at once.
In this section, we’ll show you how to use these Datadog features to gain visibility into the health of your Consul cluster:
The Host Map
Datadog’s Host Map is a good starting point for visualizing resource utilization across your Consul cluster. You can group hosts by tag, making it clear when hosts belonging to a specific datacenter, service, or other part of your infrastructure require attention.
As shown below, you can filter the Host Map to display only those hosts that belong to a specific Consul cluster, using the custom consul_cluster tag. We can see how our hosts are performing in terms of a specific metric (in this case, CPU utilization). By identifying the scope of an issue—does it affect the whole cluster, or just a single host?—you can determine what to troubleshoot next.
Network Performance Monitoring
Network Performance Monitoring lets you visualize real-time traffic between the nodes in your Consul cluster. Just like the Host Map, the Network Map supports tagging so you can filter and explore your network data on dimensions like service and cluster, as well as any custom tags you’ve applied. The Network Map—shown below—illustrates the volume of traffic, the number of connections, and the latency between nodes in your Consul network, making it easy to spot issues with the health of your cluster. If the Network Map shows unexpected traffic patterns—such as elevated latency or unusual request rates—you can click a node on the map to inspect its logs and processes. See our blog post to learn more about using NPM to monitor the performance of your Consul network.

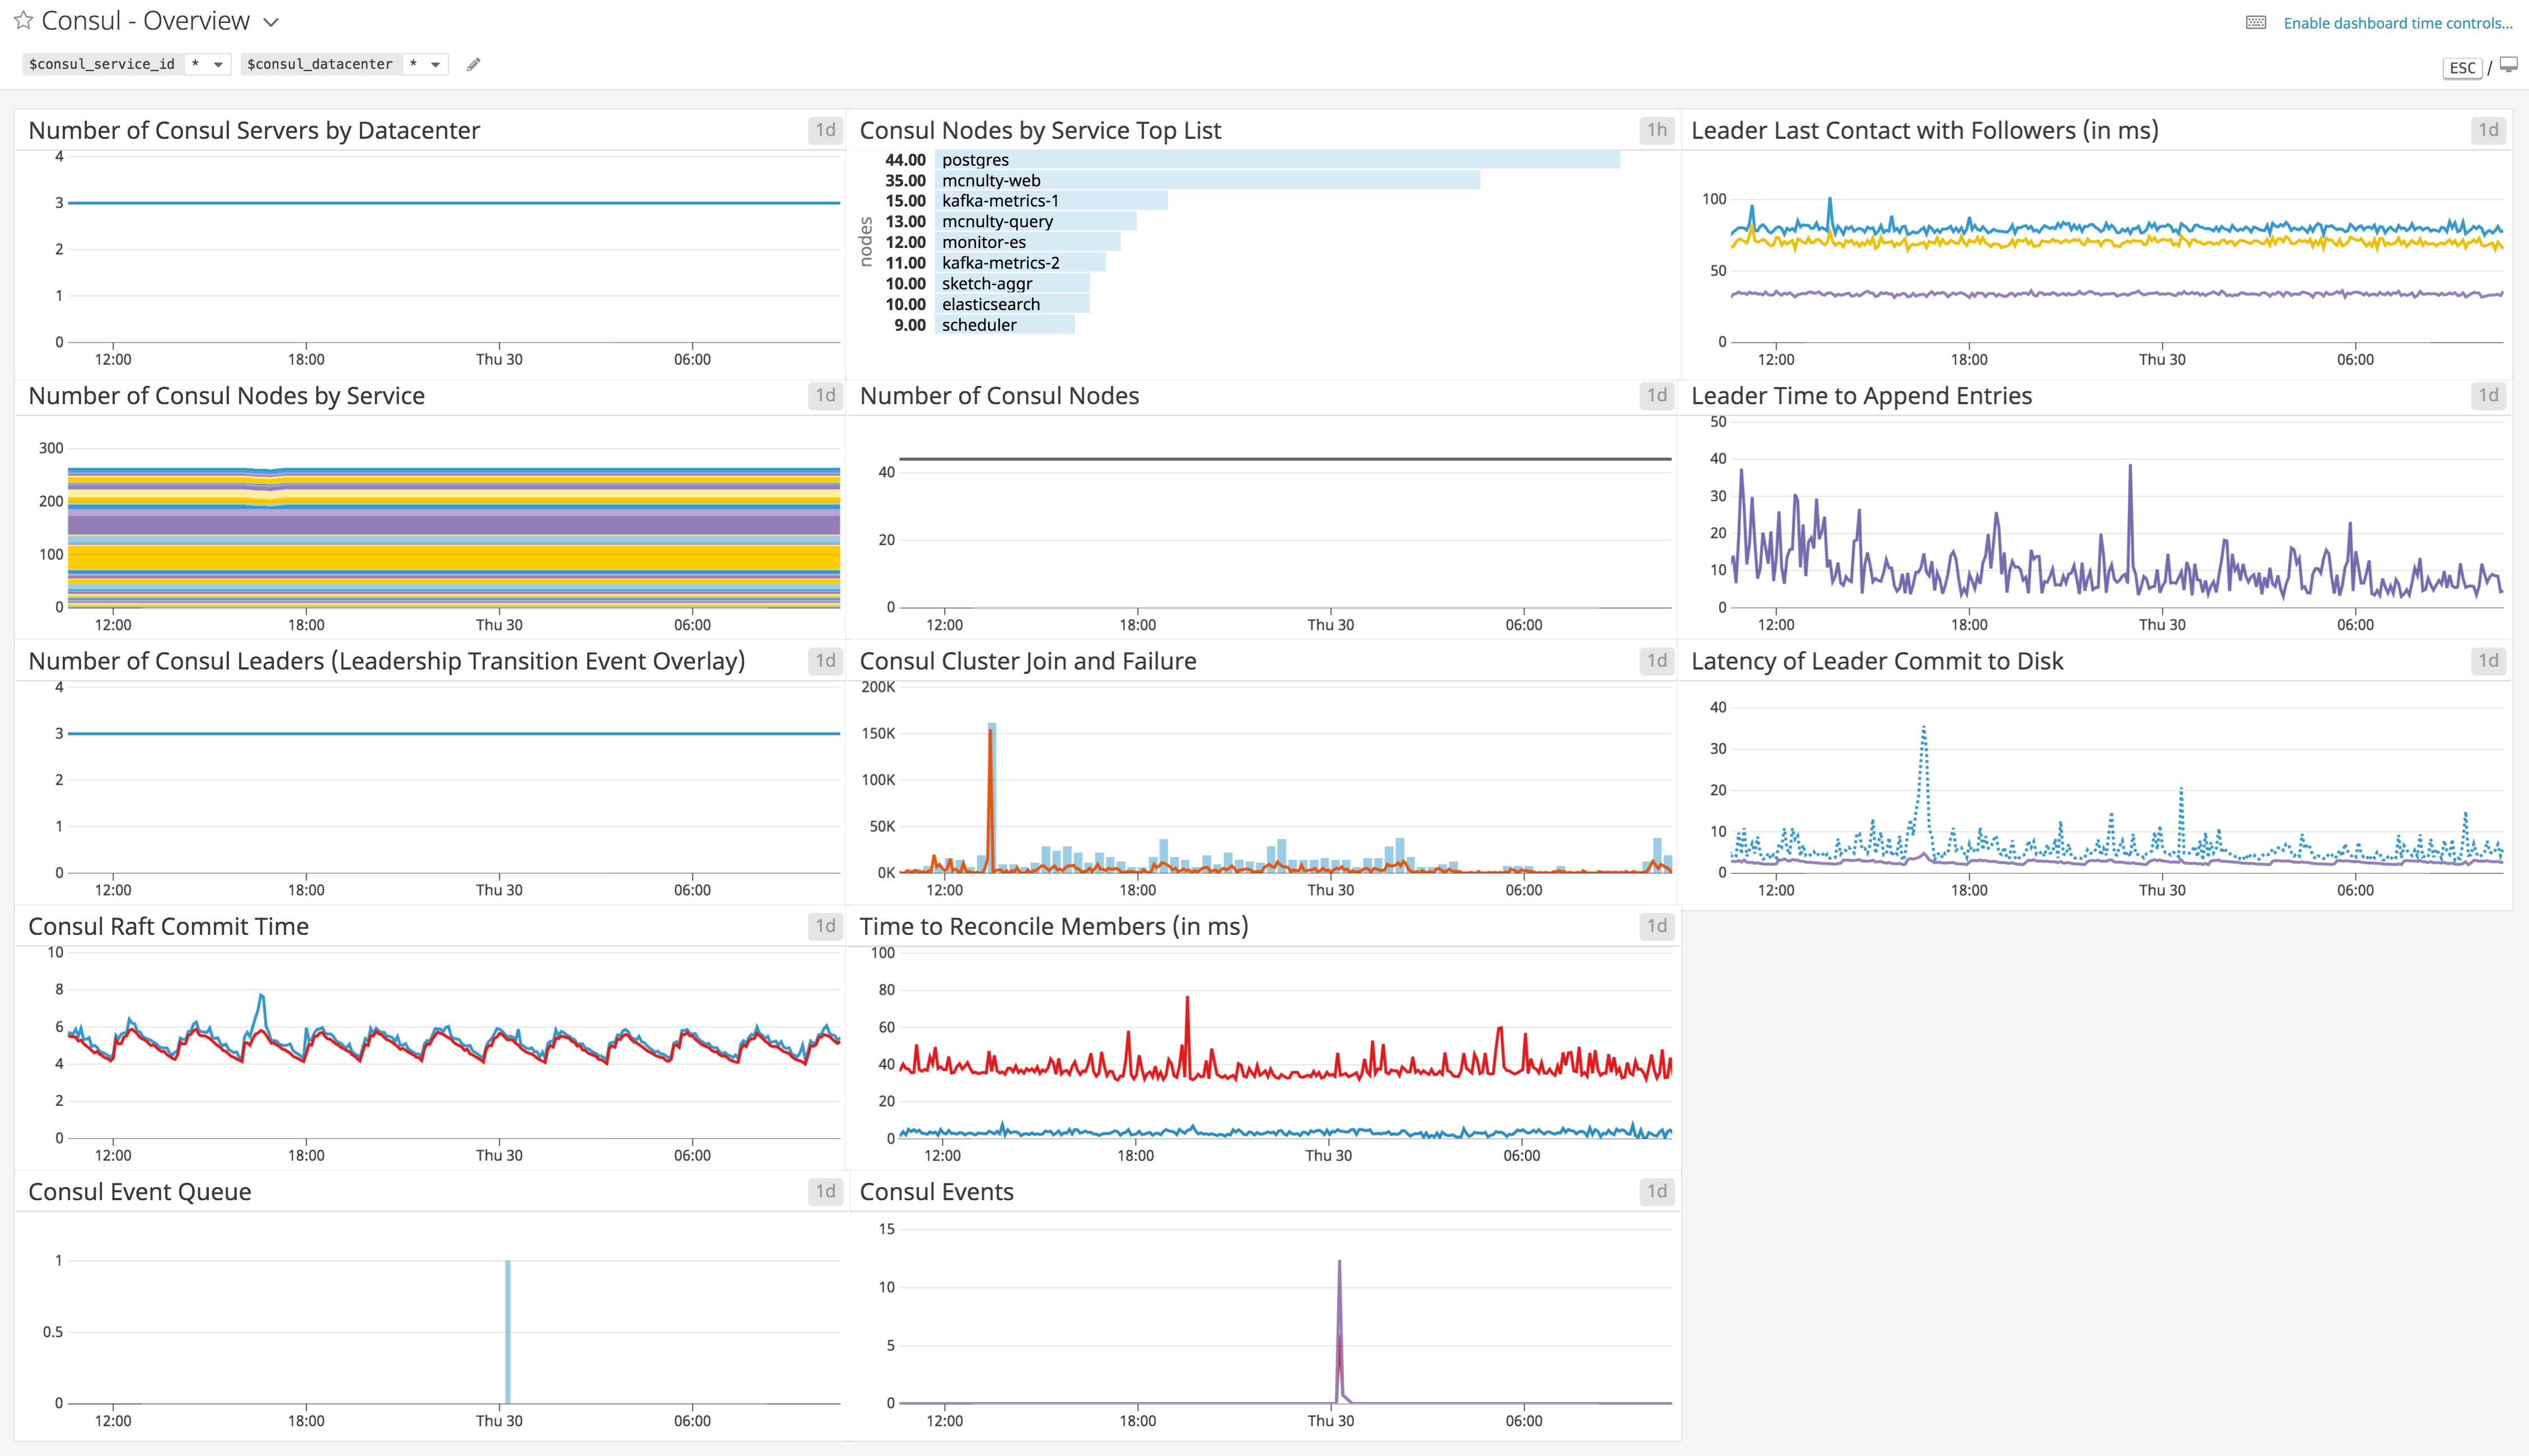
Dashboards
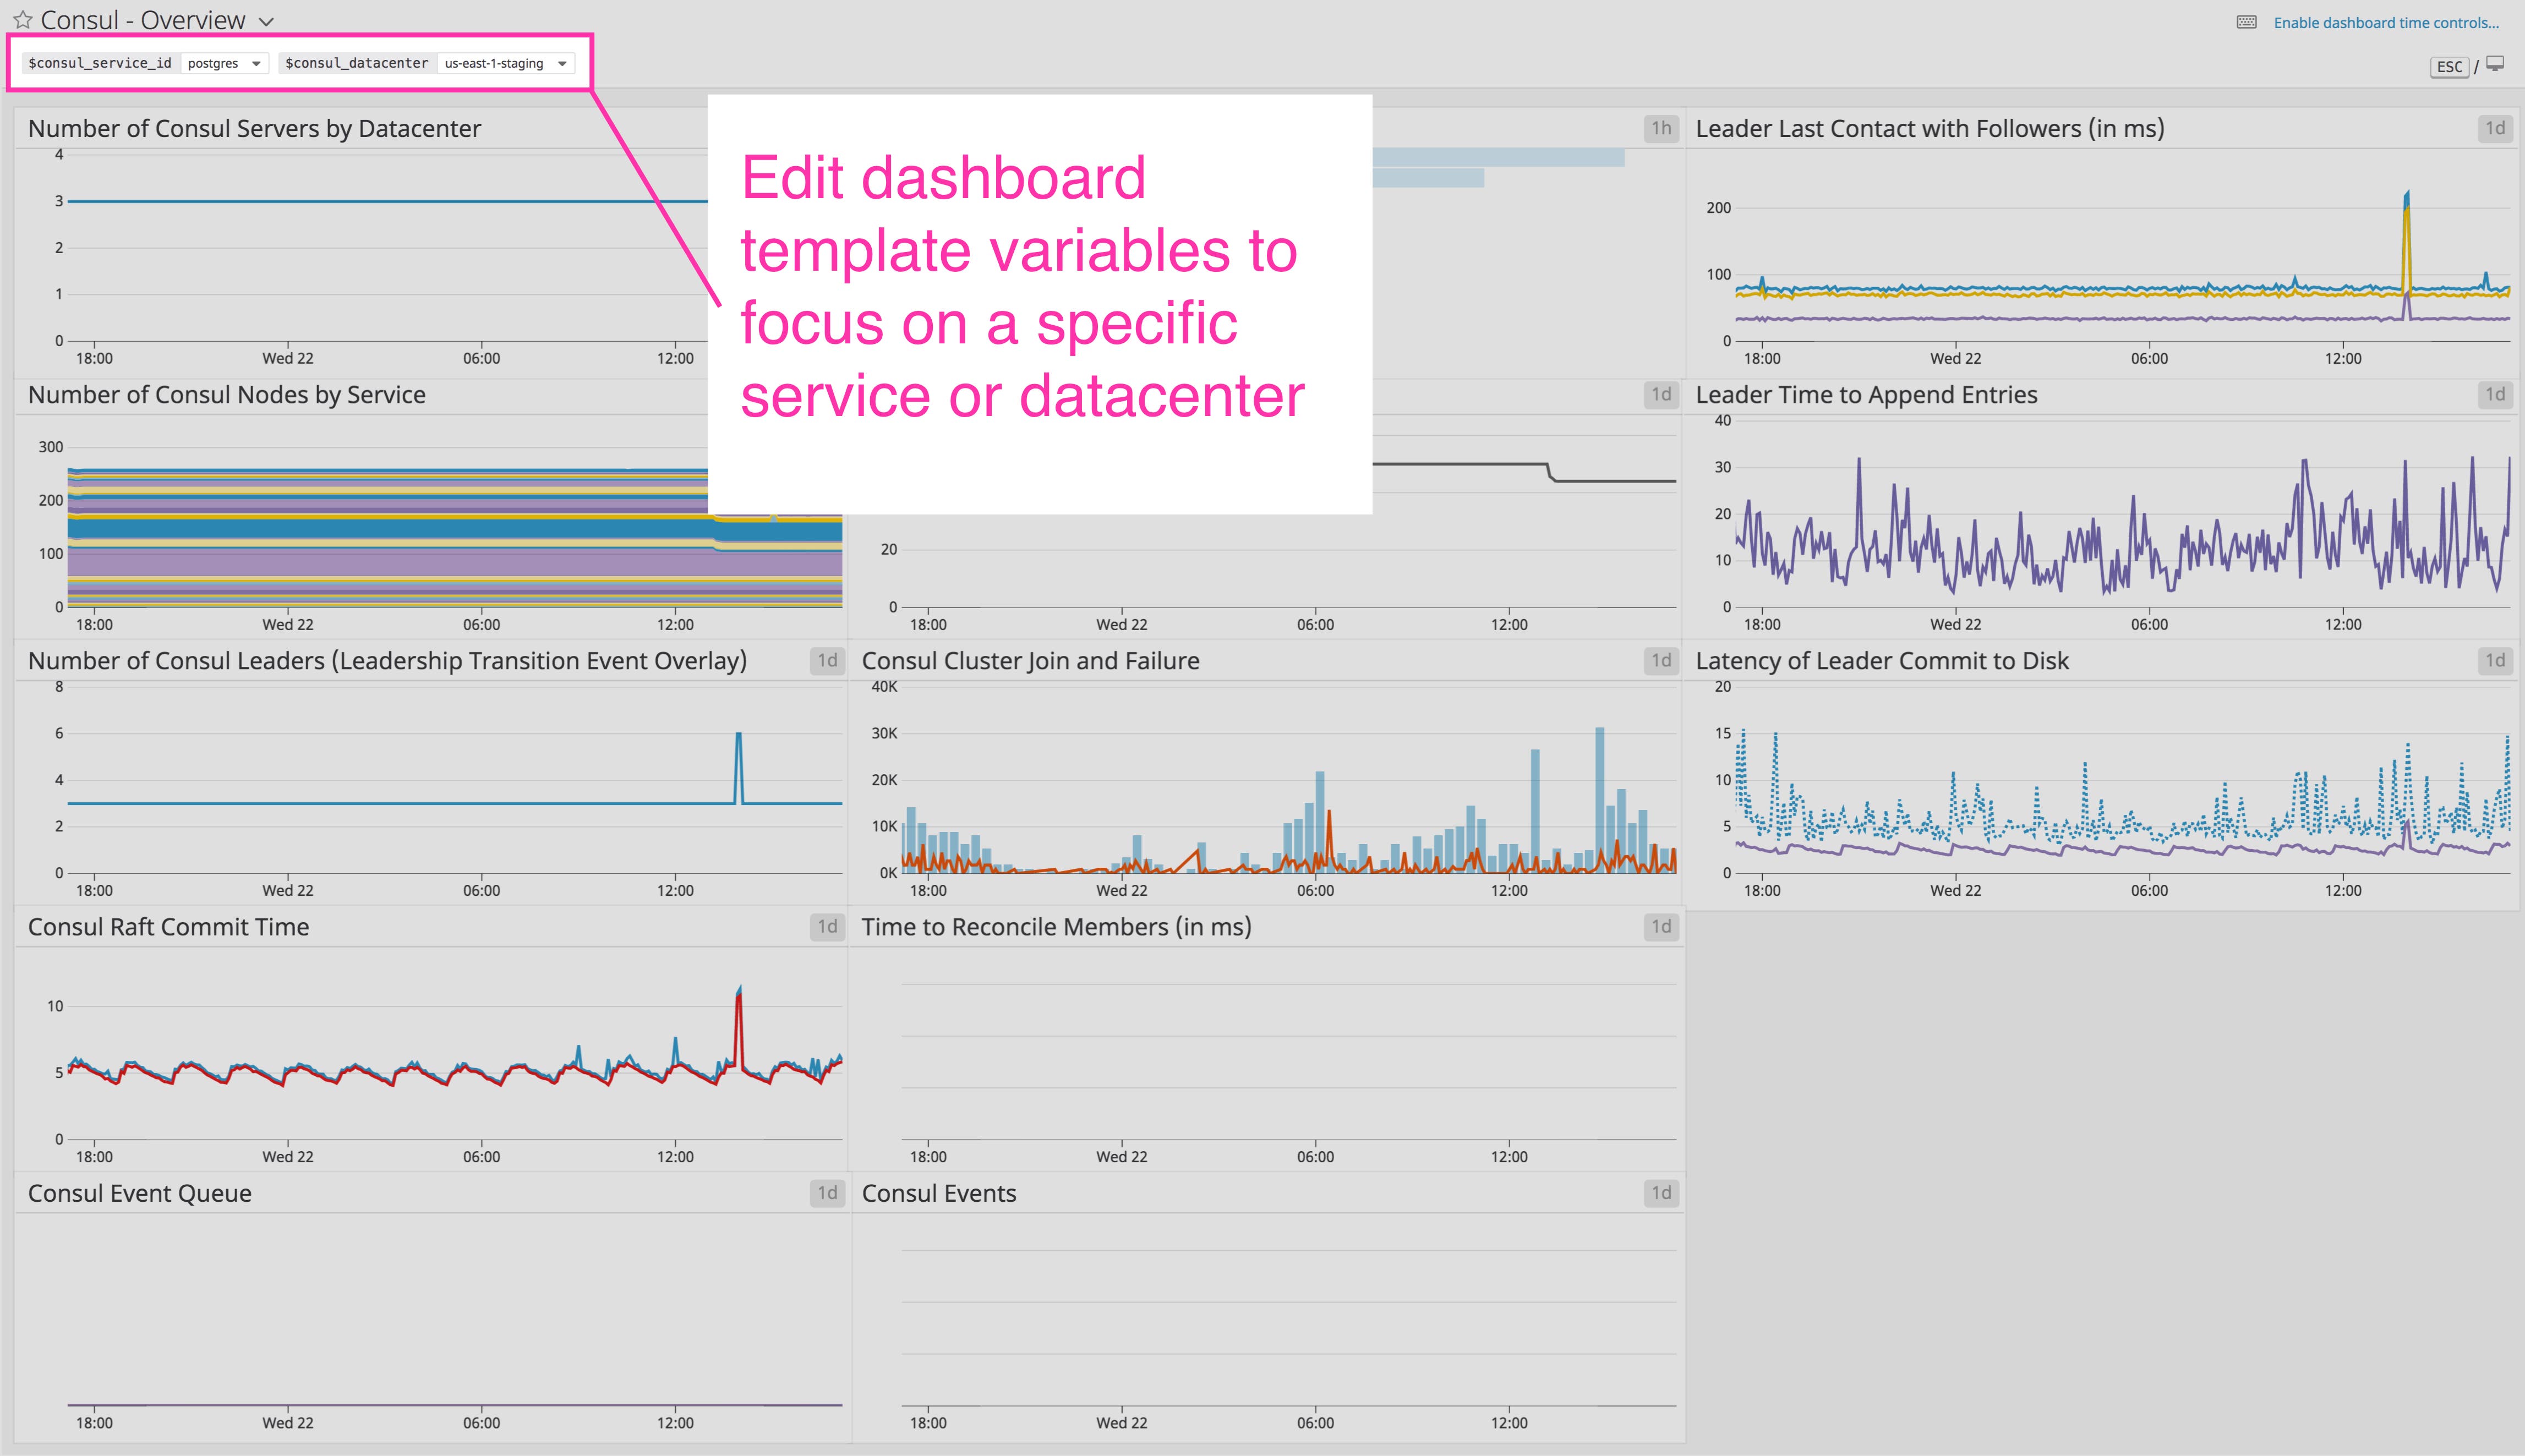
For a more detailed view of Consul’s performance, you can use Datadog’s out-of-the-box dashboard to view metrics key metrics from your Consul environment. The template variables allow you to filter the entire dashboard to display metrics from a particular service or datacenter of your choice. You can clone and customize this dashboard to correlate Consul and system-level metrics with information from more than 1,000 other technologies.
To bring more visibility into your own Consul environment, you can clone the dashboard to add other graph widgets, or track data from any Datadog integration. You can show, for example, metrics from SNMP and DNS, allowing you to get more visibility into the possible causes of underperforming network connections. And if you set network_latency_checks to true within the Consul integration configuration file, you can create graphs that show network latency between a given node and others in the cluster (all metrics beginning with consul.net listed in our documentation).
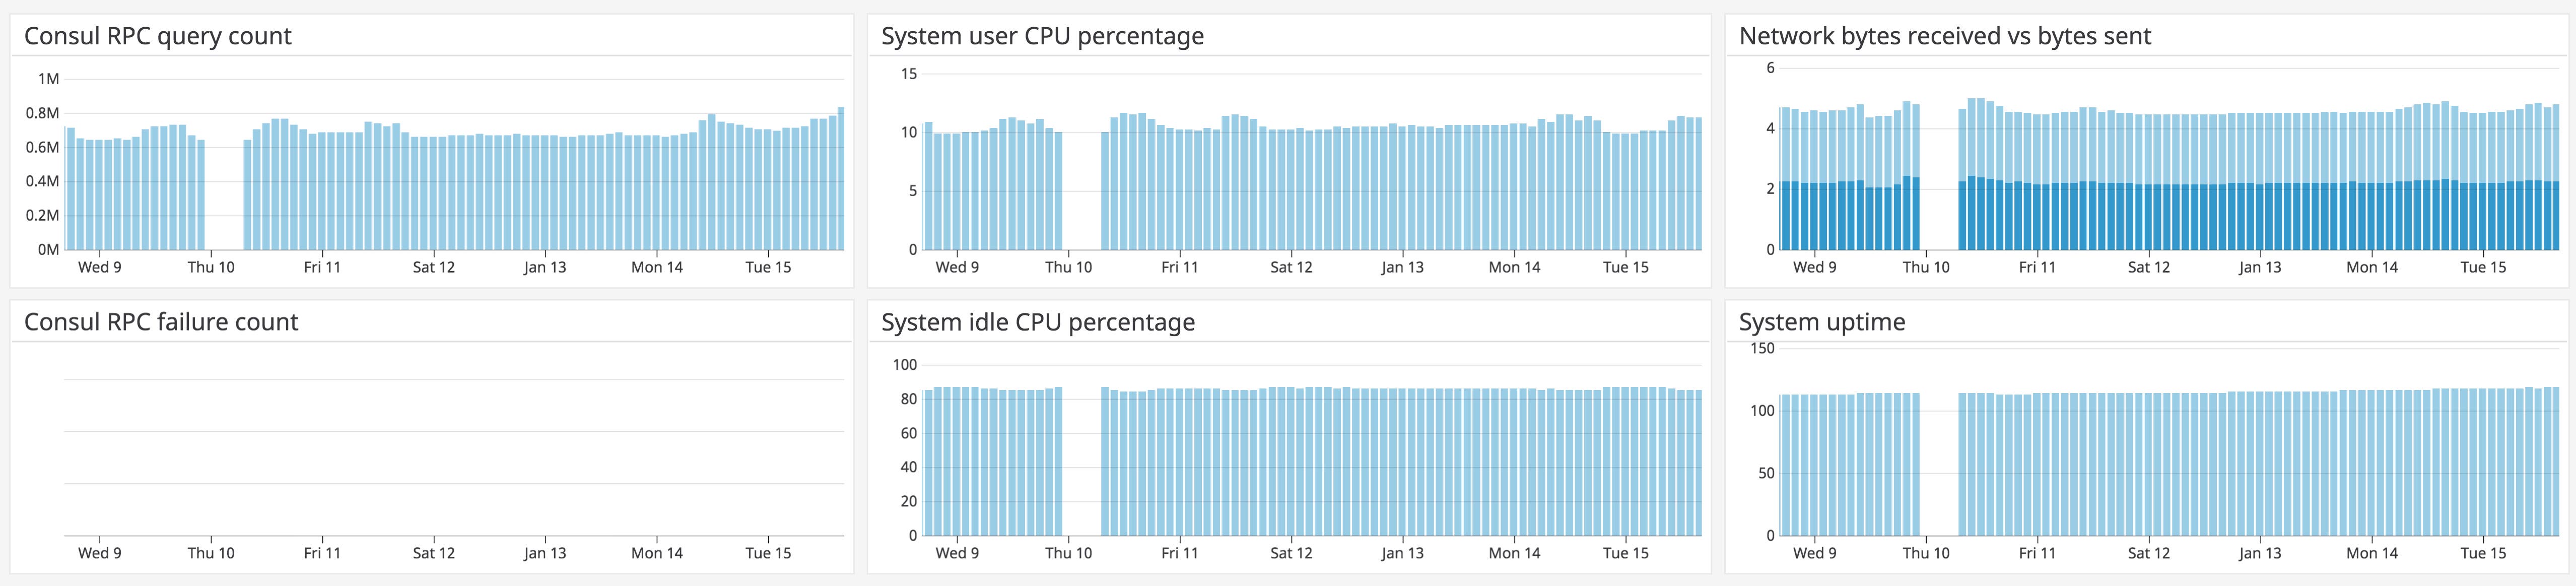
The dashboard below combines Consul metrics with system-level metrics from each host in your cluster to provide context for troubleshooting. In this example, you can see that a drastic decline in RPCs did not accompany a rise in failed RPCs, but rather a system-wide period of unavailability.
If a particular Consul metric shows an unexpected change, you can click on the graph and navigate to logs from the same point in time. The next section will explain how to use Datadog log management to track and analyze all of your Consul logs.
Analyze all your Consul logs in one place
Consul agents include a lot of valuable information in their logs out of the box. Since you’ll have a whole cluster of agents reporting logs, collecting and analyzing them in a single platform is more efficient than SSHing into each node and reading log files locally when Consul encounters an issue. Using Datadog is also well-suited for the kind of dynamic cluster you would manage with Consul, as hosts continue to report logs even as they spin up, shut down, and change IPs, as long as they run a Datadog Agent configured to send logs to Datadog.
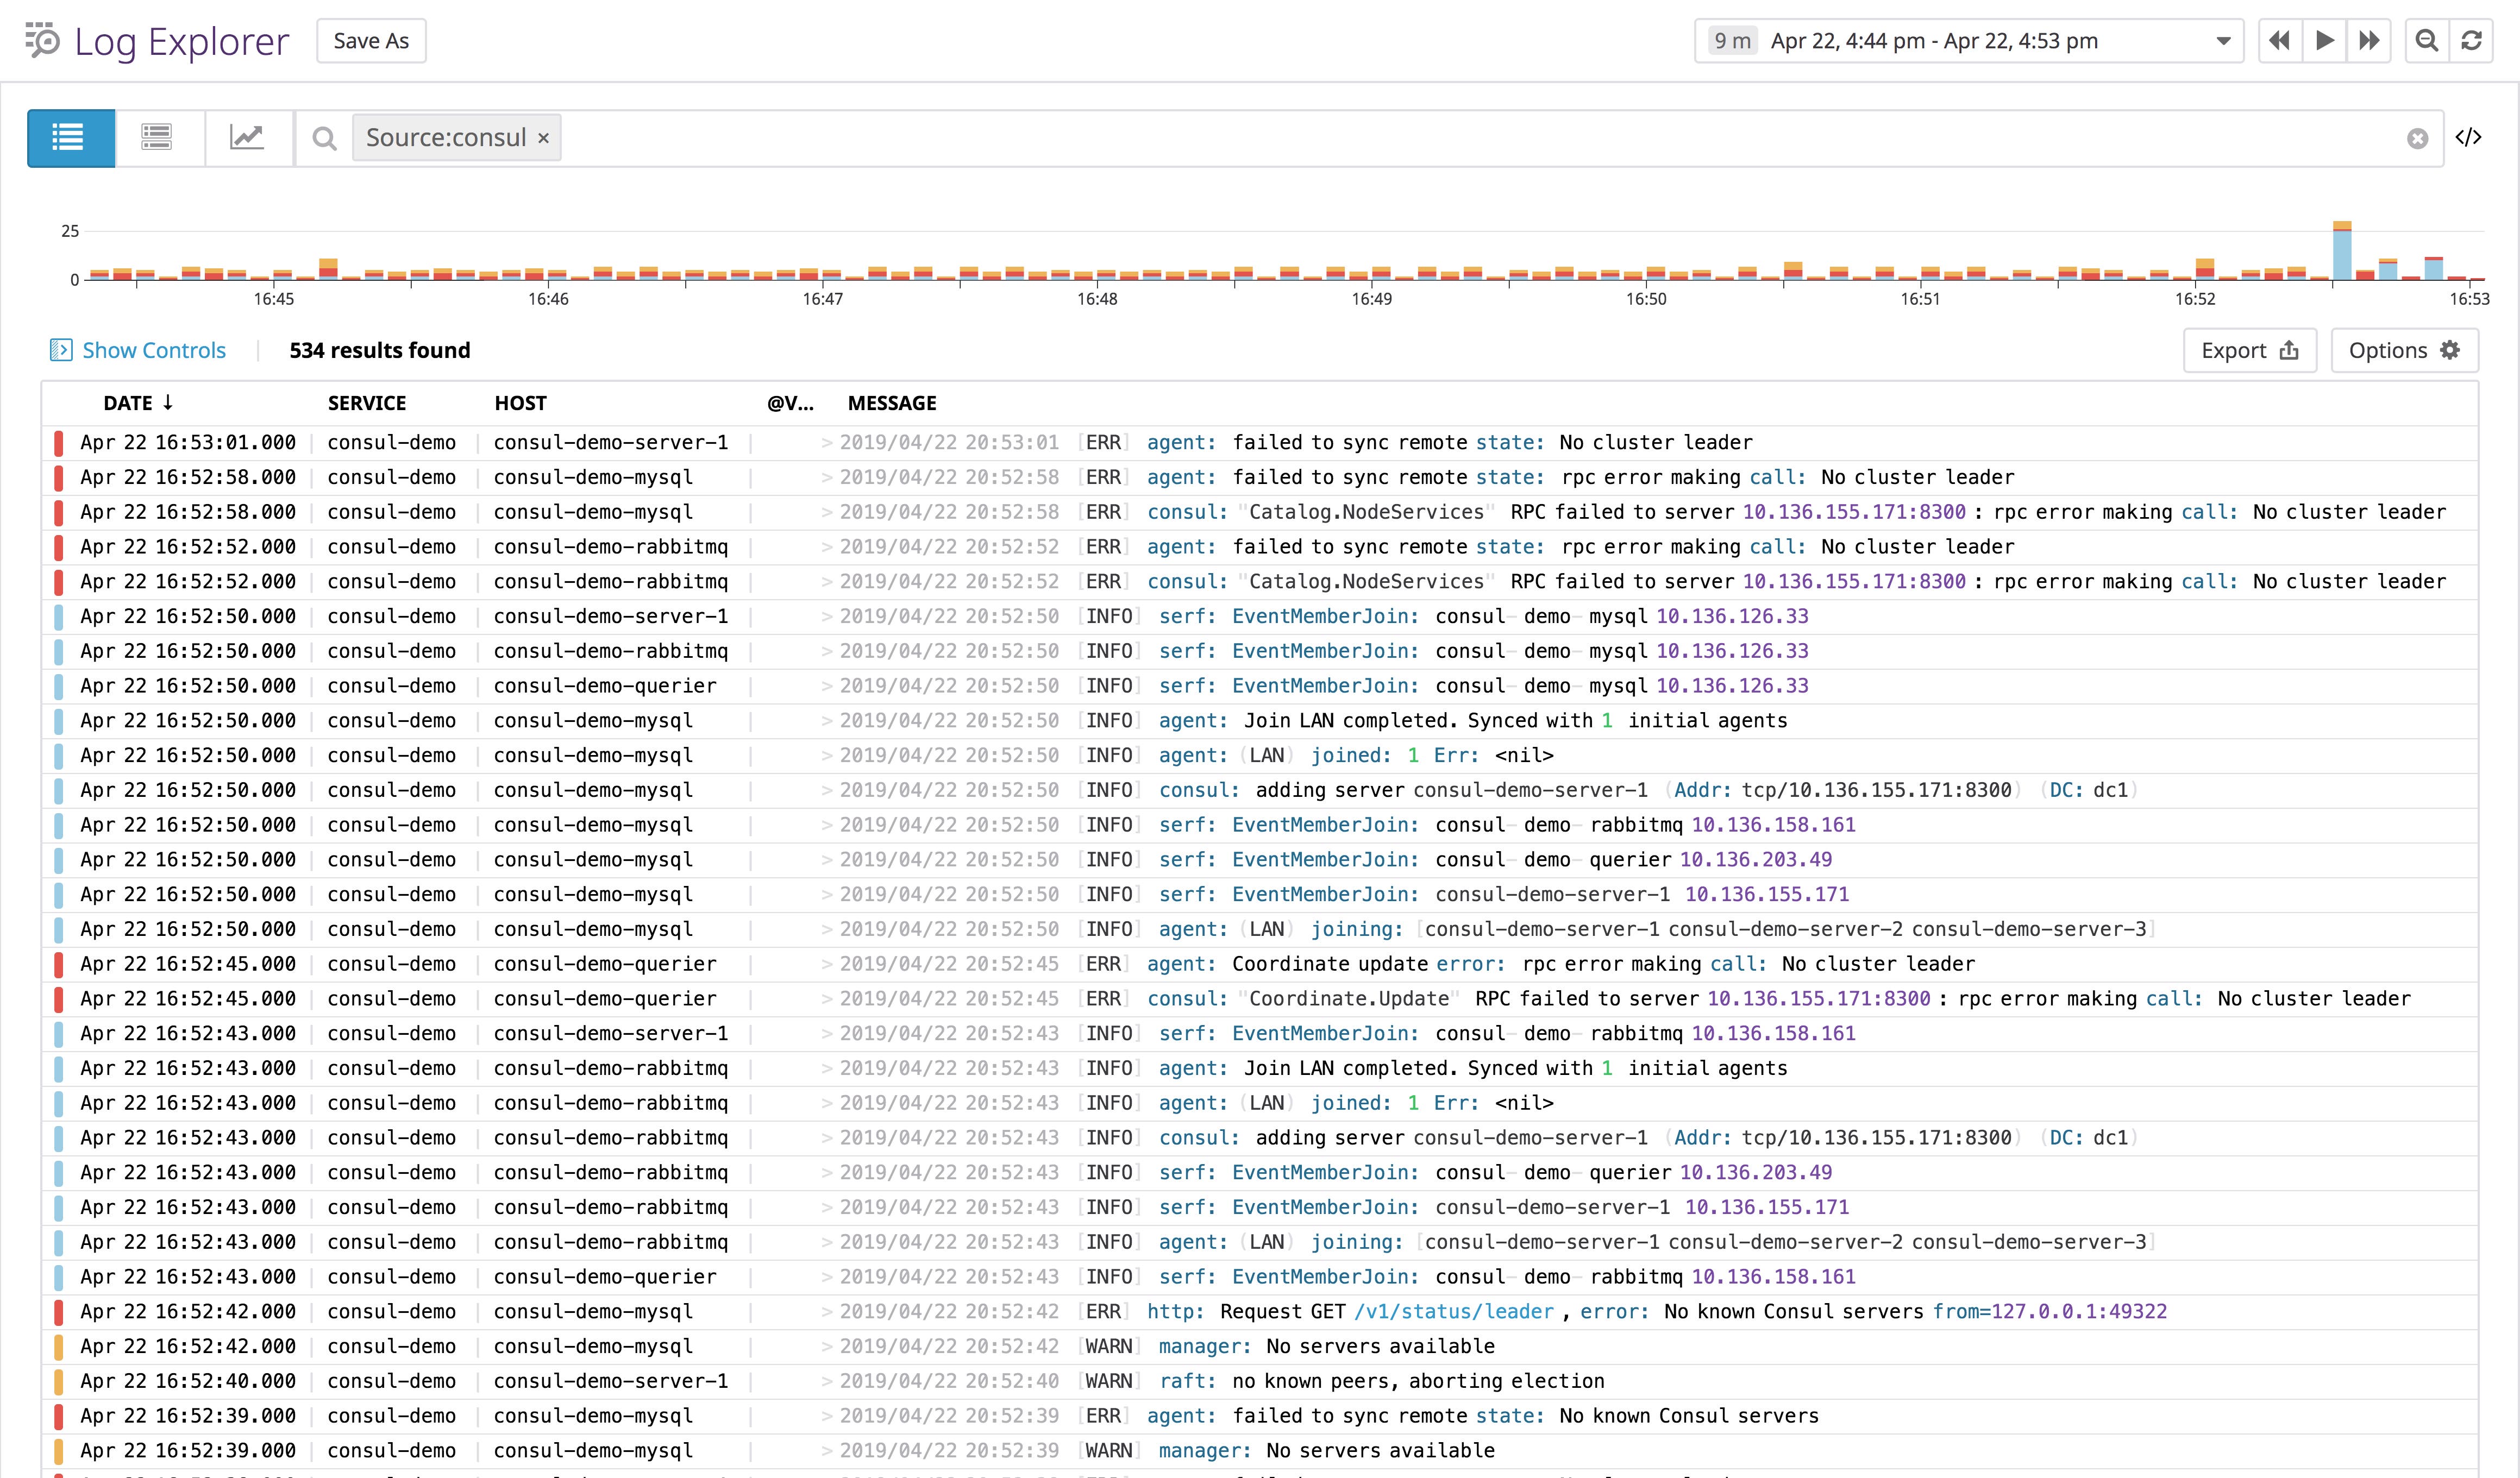
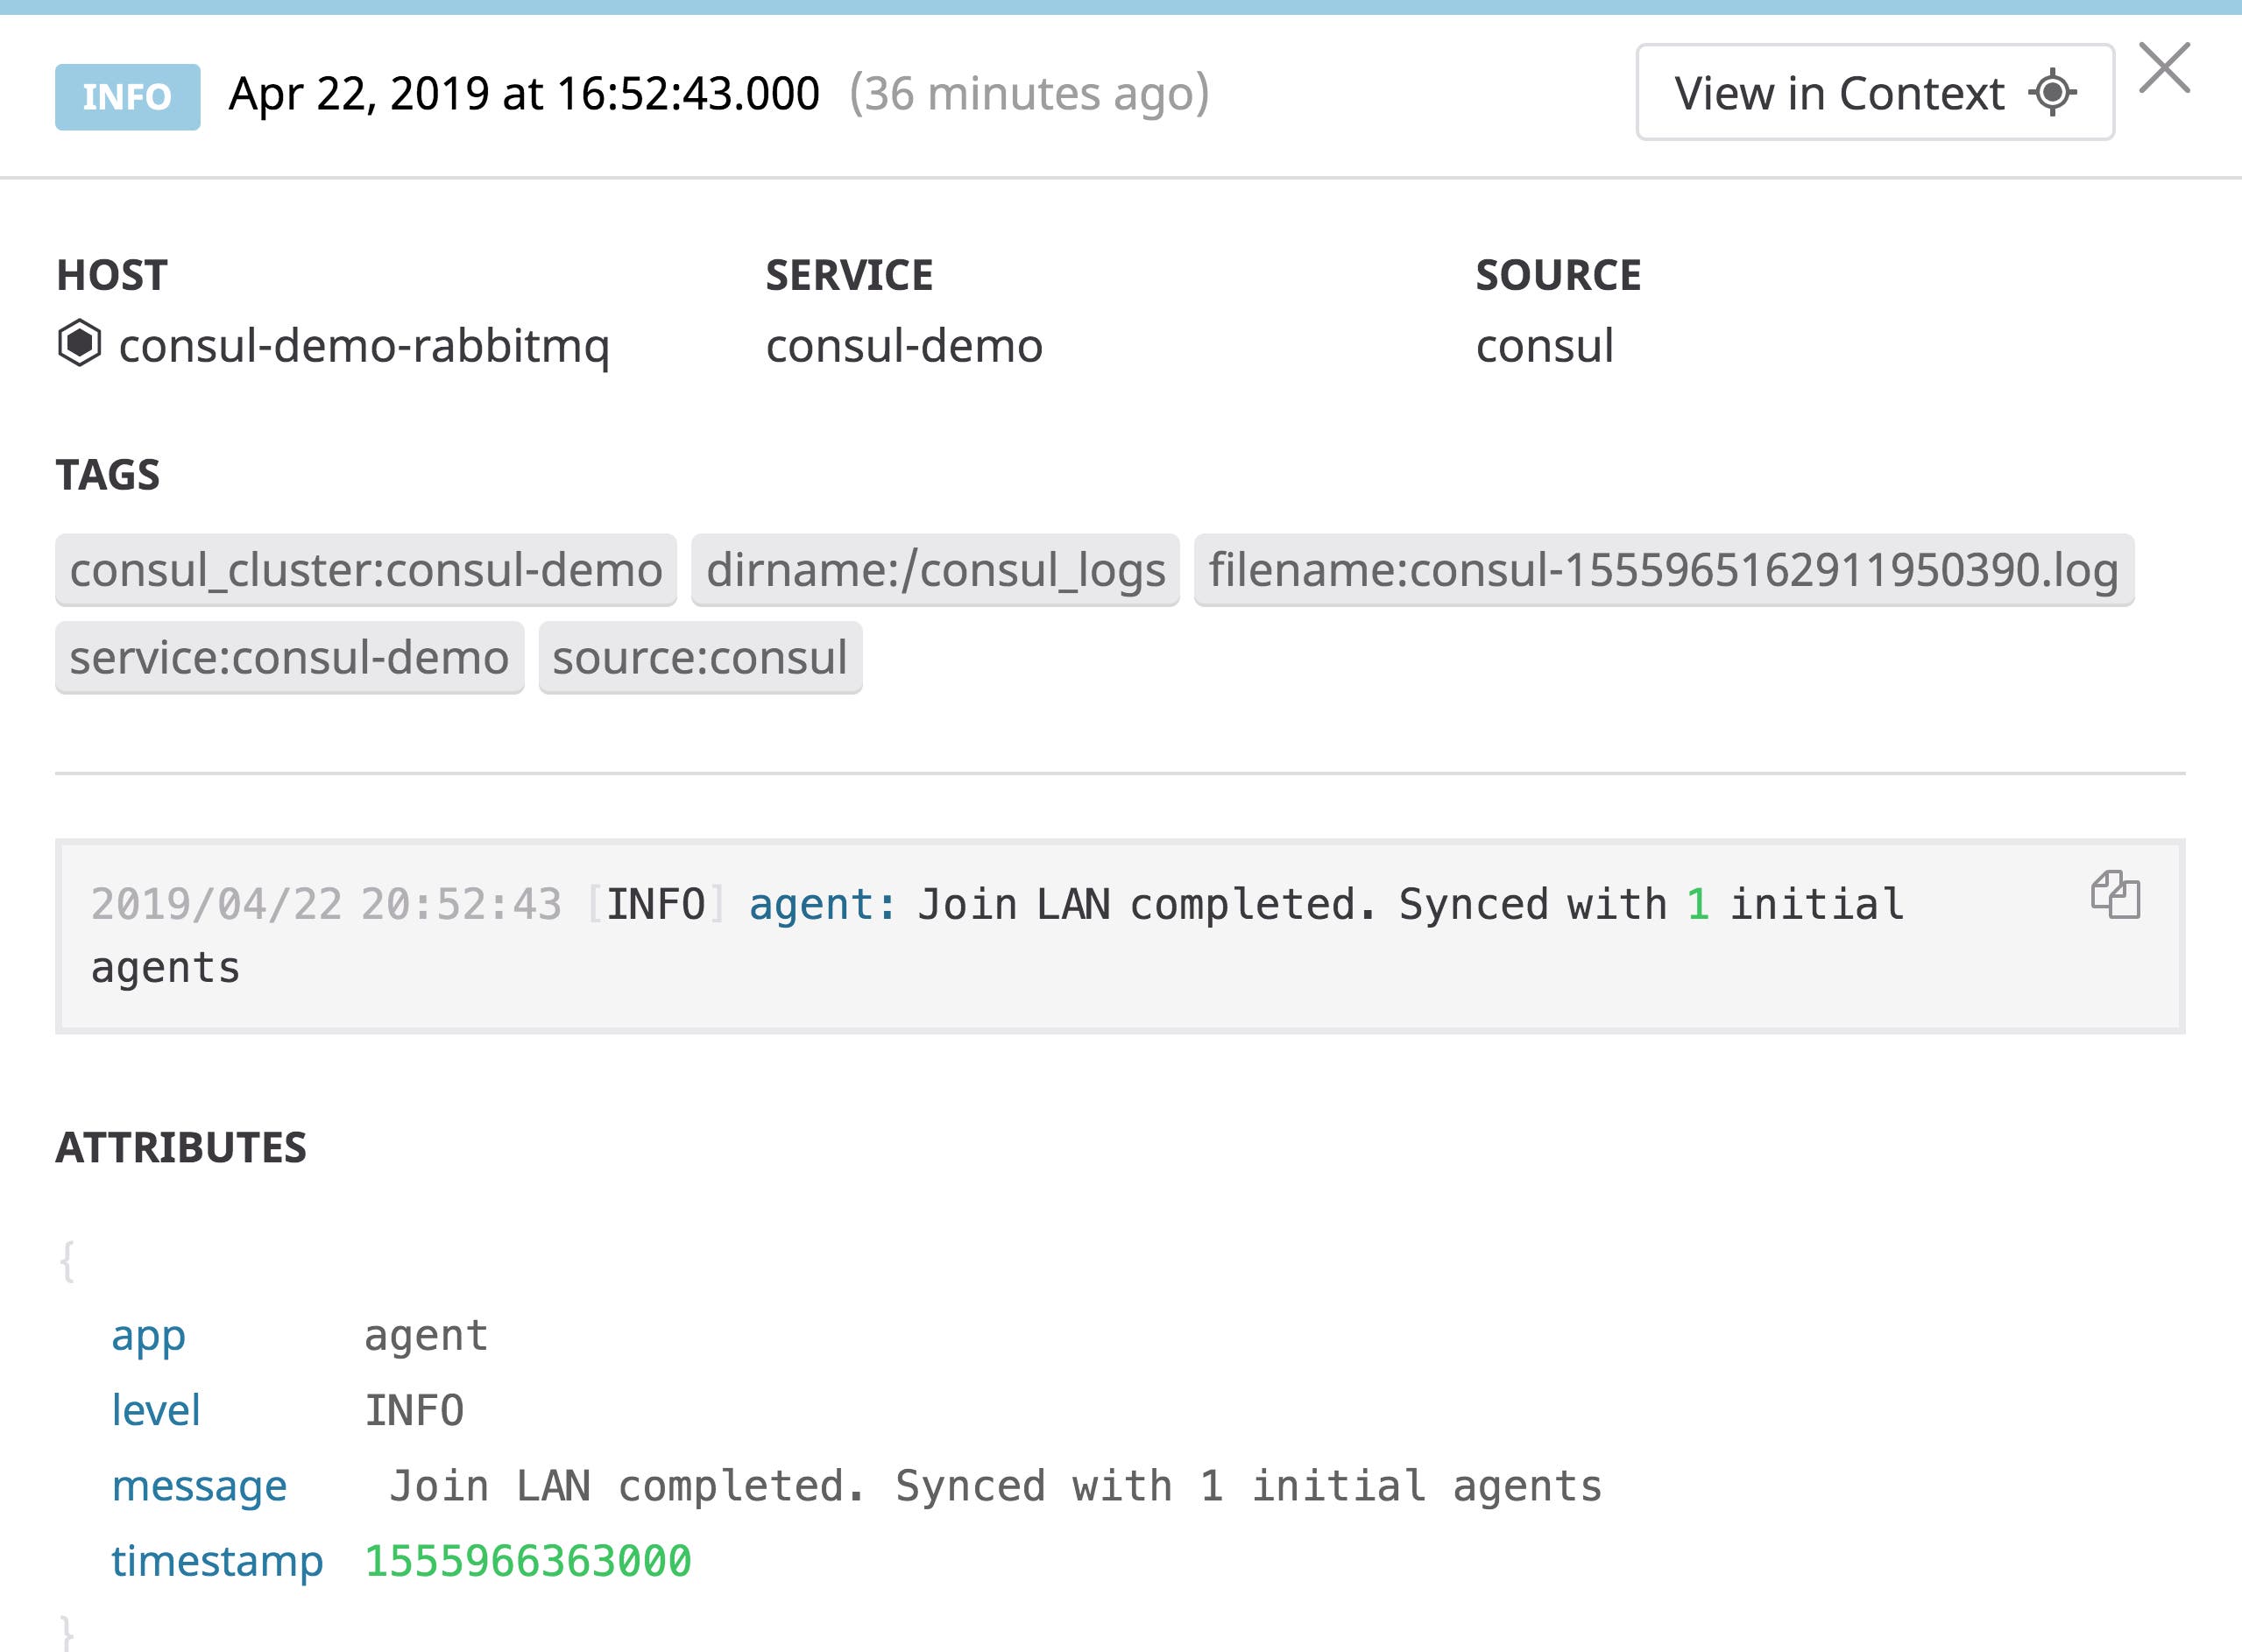
You may recall from Part 2 that Consul logs include several commonalities: a timestamp, the severity, the package that calls the logger, and a message, which can have various formats. Datadog’s out-of-the-box processing pipeline automatically extracts attributes from your Consul logs, and enriches them with any tags specified in the logs section of your integration configuration file (consul.d/conf.yaml).
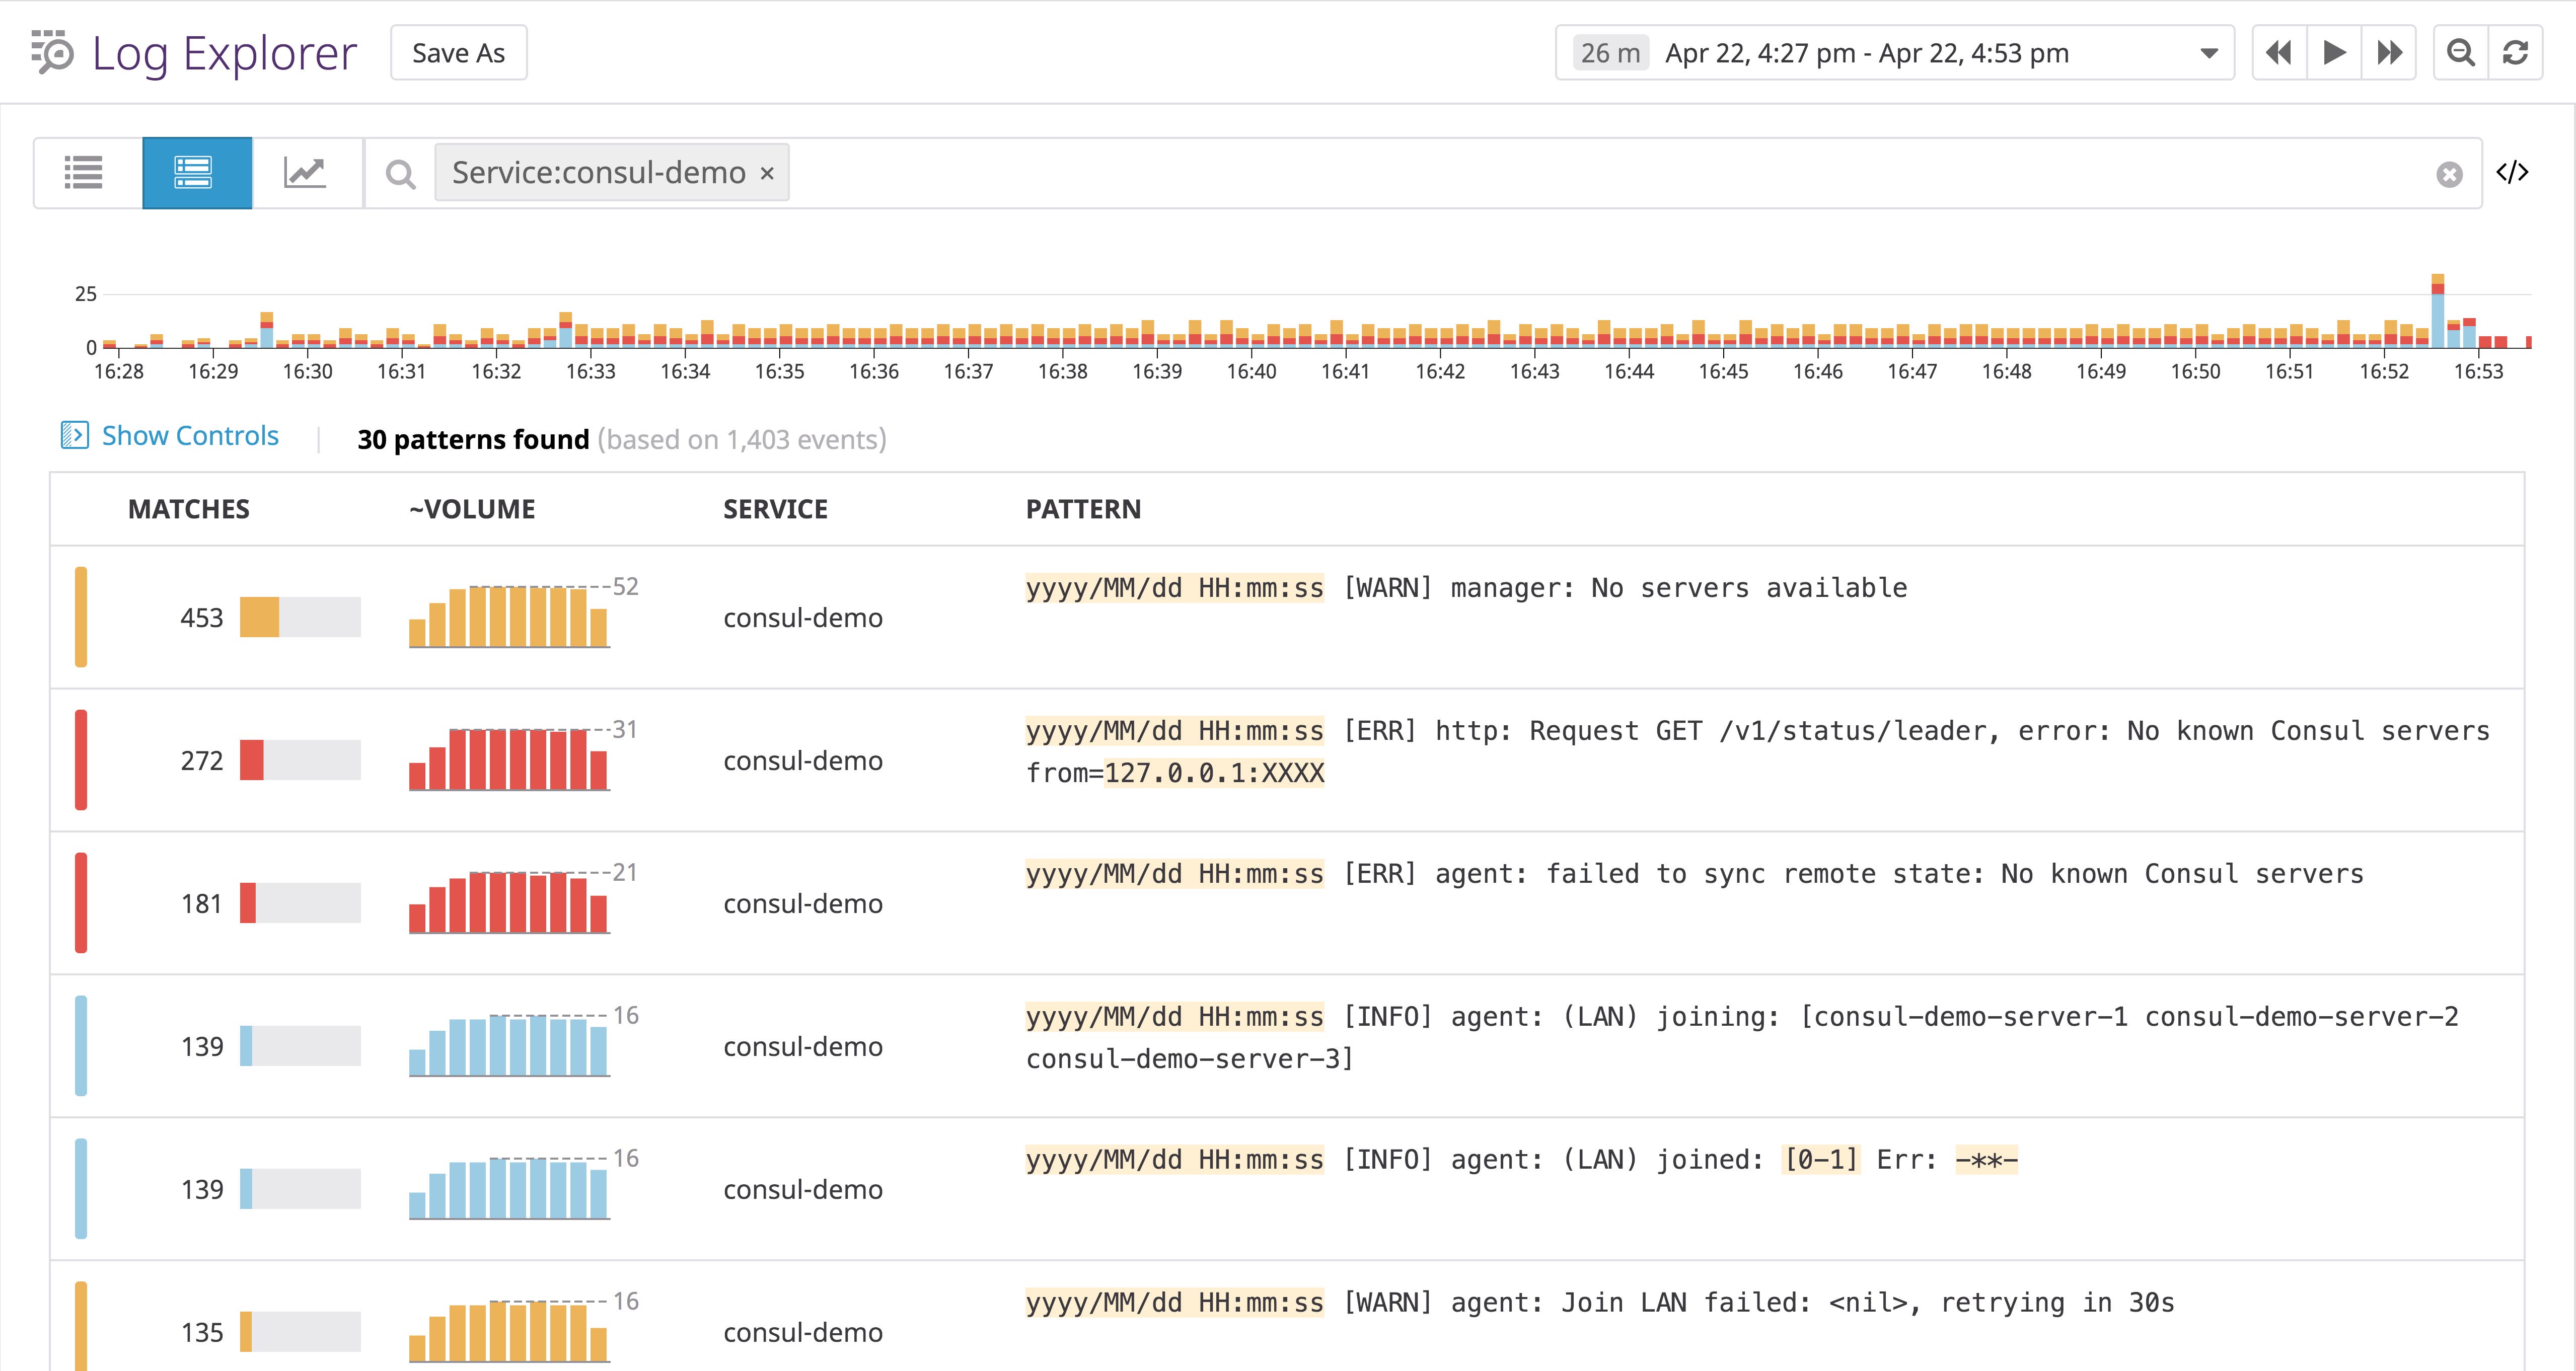
Since Consul’s log messages are written in plain English and sometimes include variable values at different locations depending on the log, they can be difficult to aggregate. Datadog’s Log Patterns view can automatically find commonalities between logs, helping you figure out which kinds of logs are most common and where to take action first.
For example, the Log Patterns view below indicates that logs carrying the message, [WARN] manager: No servers available are the most common over the chosen timeframe, meaning that we’ll want to take further action to investigate why no server nodes have joined the cluster.
Maintain a healthy Consul cluster with Datadog alerts
While Consul already provides some automated monitoring in the form of health checks and watches, Datadog allows you to visualize all of your Consul data in context with the rest of your infrastructure, as well as to tailor your alerting strategy for your specific use case. Datadog can alert you of possible Consul incidents such as frequently failing health checks and unstable cluster leadership.
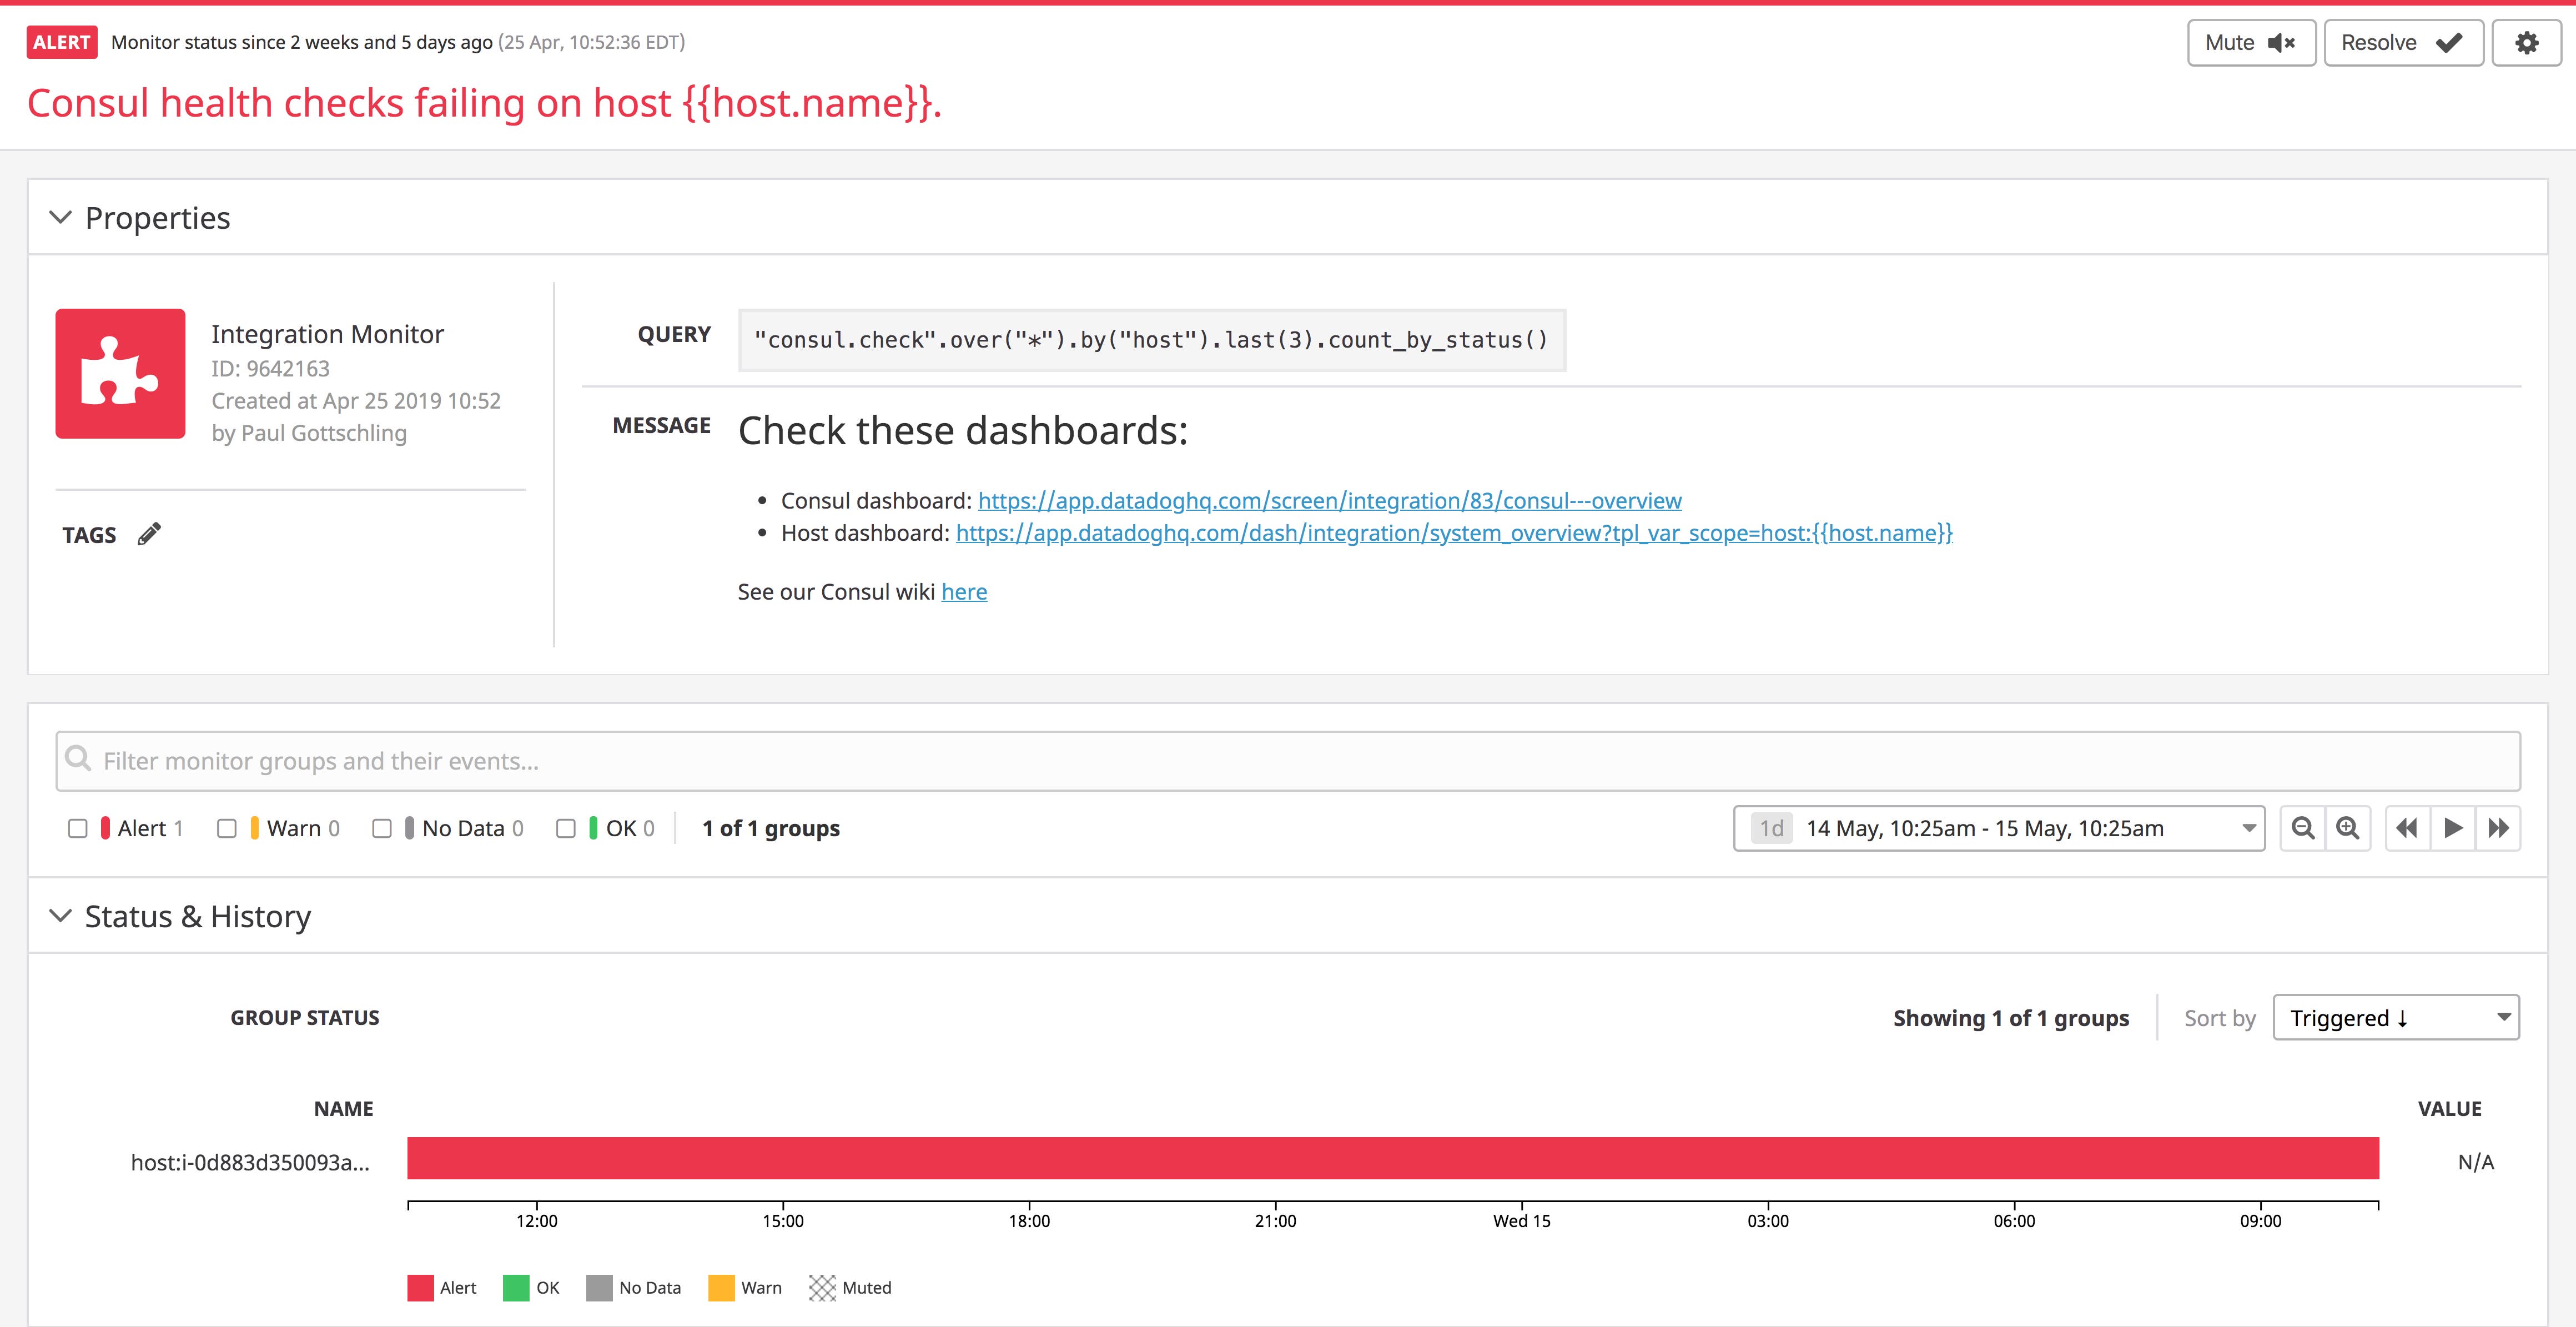
Rather than using manual API and CLI commands to track your Consul health checks, you can let Datadog notify you of their status, and see any related metrics, traces, or logs in the same platform as the rest of your Consul data. Since Datadog monitors Consul health checks automatically as Datadog service checks, you can set an alert when a certain number of checks fail within a specific period of time by creating an integration monitor.
The alert below reviews Consul’s last three node-level health checks (last(3)), counting them by status (“Alert,” “OK,” or “Warn”) and triggering after one “Alert.” You can also configure a similar alert for tracking failed service-level health checks by using the consul_service_id tag (pulled automatically from Consul based on the ID of the service). A custom message gives teammates access to helpful documents and dashboards. You can use a tag variable (such as {{host.name}}) in the dashboard link, so the incident responder can easily view metrics collected from the host that triggered the alert.
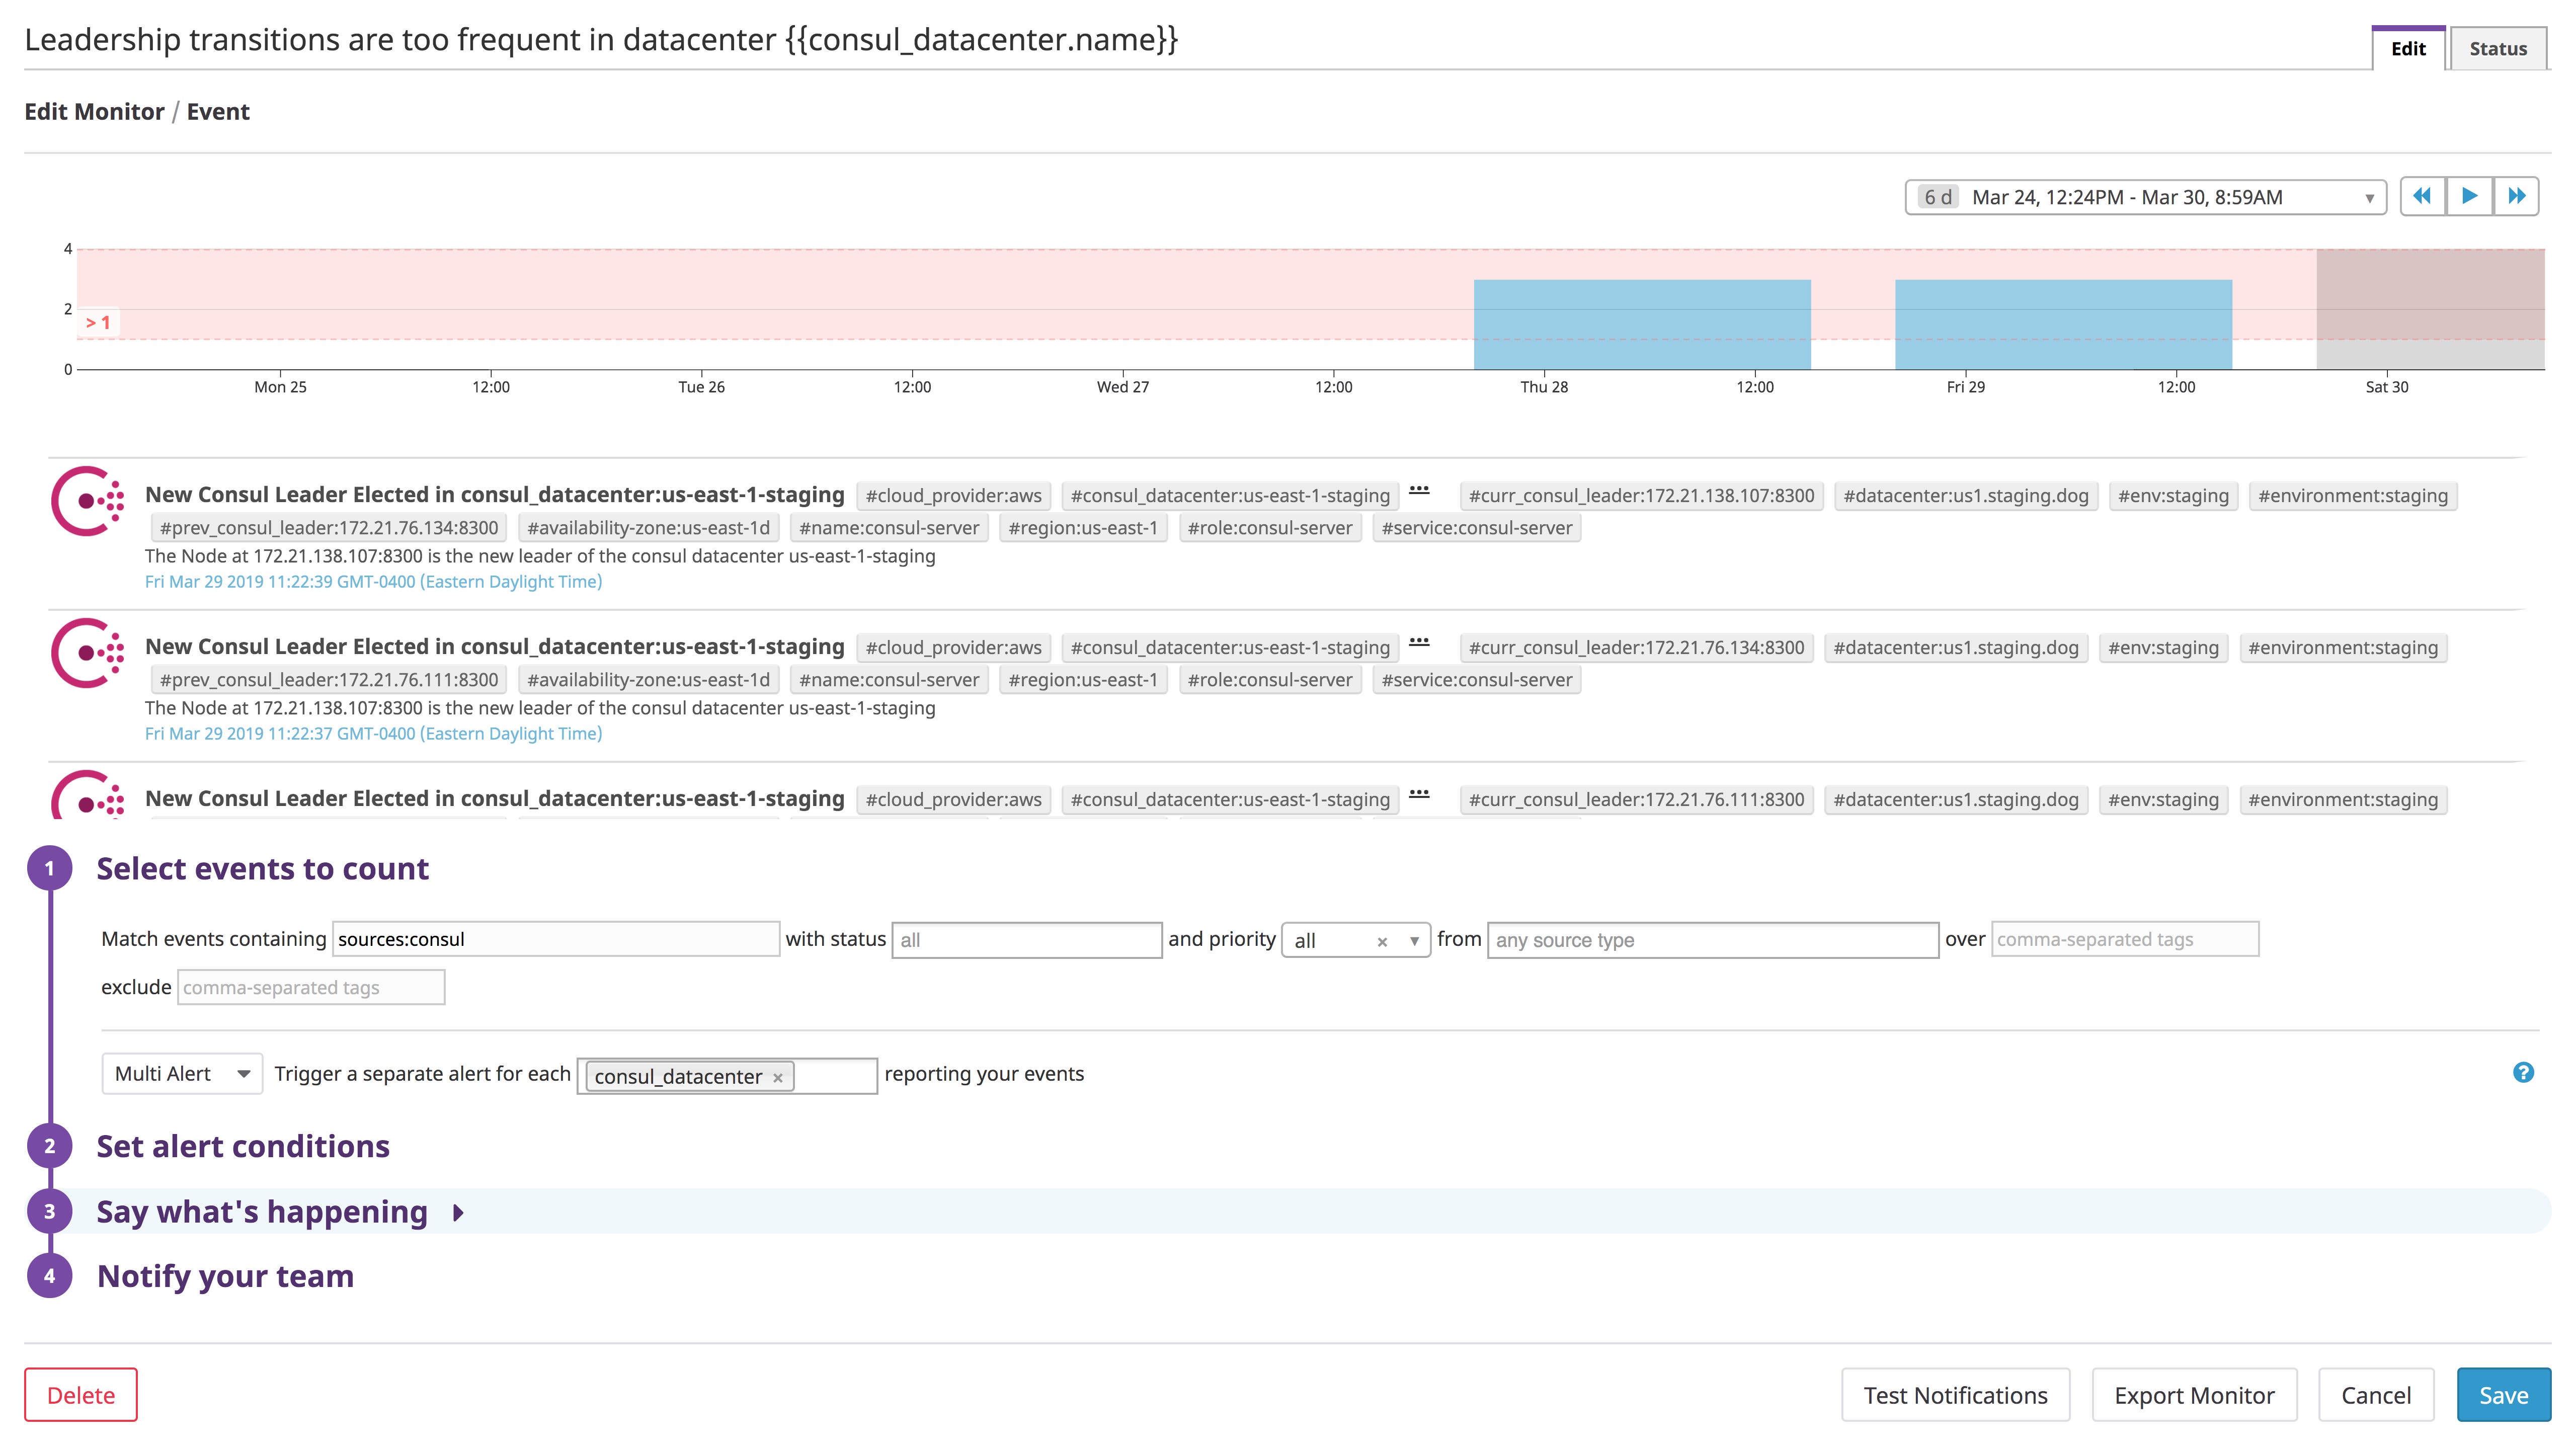
Frequent leadership transitions can compromise the availability of Consul’s strongly consistent data (see Part 1), preventing cluster members from accessing network addresses and configuration details. Datadog produces an event whenever Consul elects a new leader (as long as self_leader_check is set to true in your Consul integration configuration file), making it possible to alert on a certain number of leadership transitions over a certain period of time. In the example below, we’ve used the consul_datacenter tag to trigger a separate alert for each Consul datacenter that breaches our threshold.
You can also alert on the loss of a leader node by using any Consul metric that includes the mode tag, which, as we explained earlier, can have either the value leader or follower depending on a server’s state. Most of these metrics are available after enabling catalog-based checks, though you can also use the metric consul.peers to count the number of servers in the cluster by leader or follower status.
Start monitoring Consul with Datadog
In this post, we’ve shown you how to use Datadog to get comprehensive visibility into your Consul clusters, regardless of how many hosts you’re managing with Consul and how often they change. Datadog allows you to collect the output of Consul’s built-in monitoring capabilities—telemetry, logs, and health checks—visualize them in a single platform, and alert on them to discover issues. If you’re not already using Datadog, you can sign up for a free trial to start monitoring your Consul clusters—and all of the services that rely on them—in one platform.


