Adam Rowan
Partner Alliances Manager, Consul

David M. Lentz
Editor's note: This post covers Cloud Network Monitoring, a Datadog feature that was originally called Network Performance Monitoring.
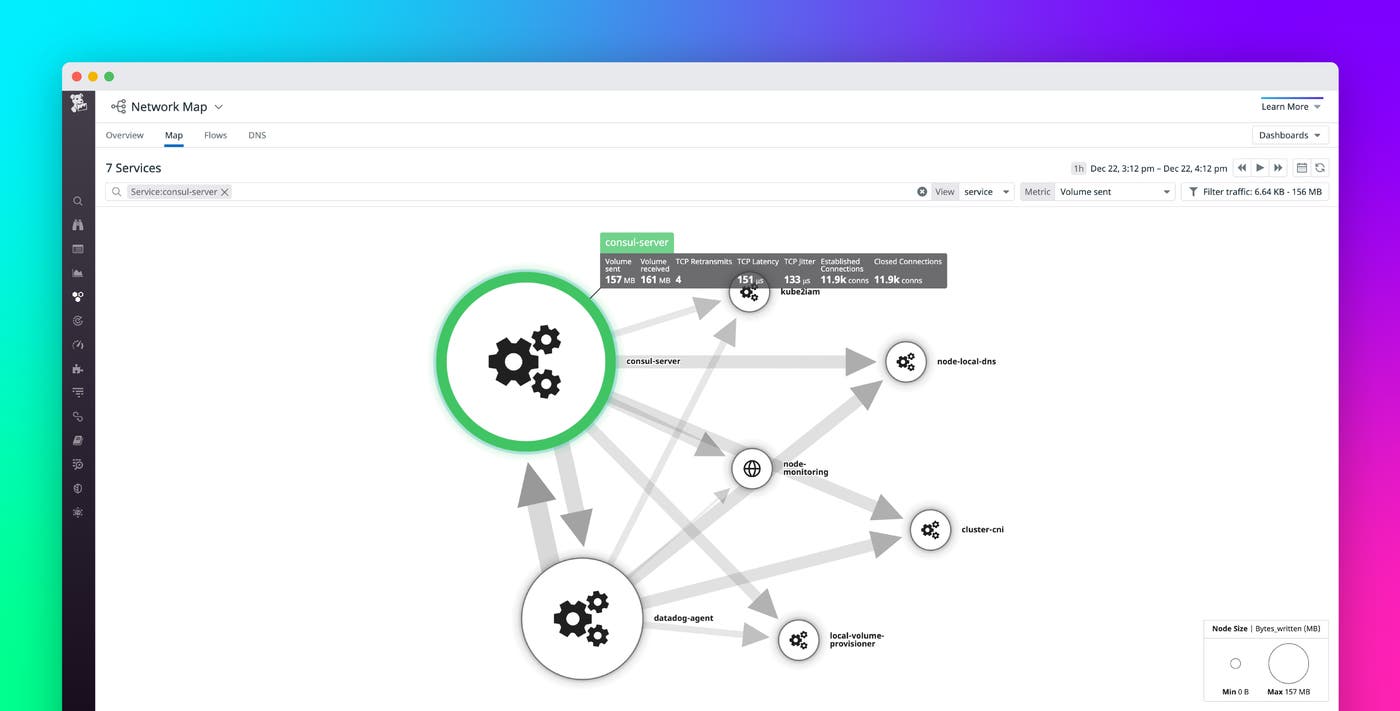
Consul is a service networking platform from HashiCorp that helps you manage and secure communication between microservices. You can use Consul with Kubernetes, and it supports on-prem, hybrid, and multi-cloud architectures. Consul service mesh provides a control plane which allows you to automate the management of traffic between your services via features like service discovery, DNS, load balancing, and routing. Services in a Consul cluster do not need to be aware of network configuration details, since they communicate via the data plane, which is a network of proxies—typically Envoy—that route traffic on their behalf. Datadog Network Performance Monitoring (NPM) gives you visibility into the flow of traffic in your network, so you can understand connections, dependencies, and traffic volume. NPM can help you quickly troubleshoot application errors and latency, showing you at a glance whether the health of your Consul network is a factor. In this post, we'll show you how you can use NPM to:
Monitor traffic between microservices managed by Consul
Ensure the health of your Envoy proxies
Then we'll show you how Datadog brings together network, application, and infrastructure data so you can monitor Consul in context.
Analyze the traffic in your Consul network
Endpoint addresses are dynamic in Kubernetes and cloud-based environments, as containers churn and spin up in new locations across your network. Consul automatically updates its service registry and DNS information so services can reach their endpoints. But if your Consul configuration is incorrect, this information could go out of date, and your services may not be able to communicate with each other.
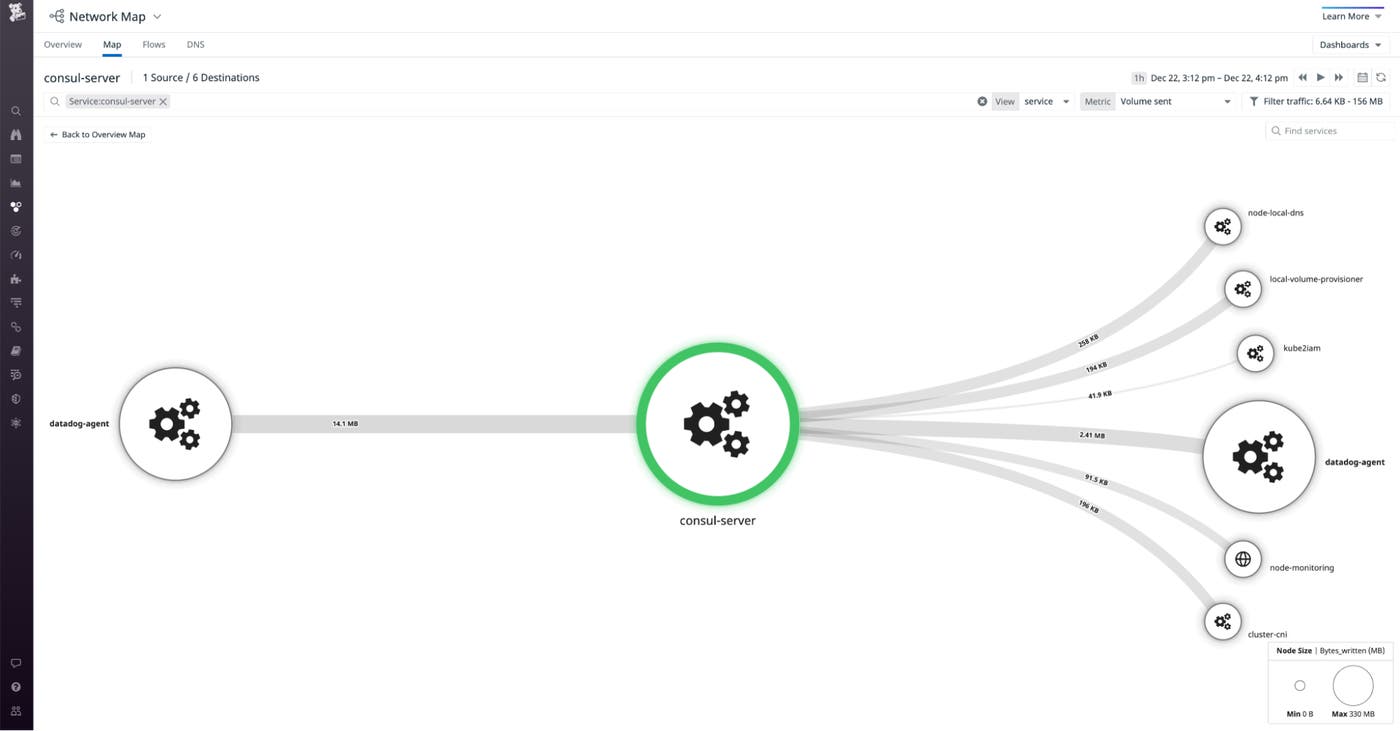
The Network Map gives you real-time visibility into the flow of traffic between your services. This makes it easy to spot issues with the health of the traffic in your Consul cluster, such as high latency or a large number of TCP connections. The screenshot below shows that the volume of traffic from one service in a Kubernetes cluster is relatively low compared to traffic from another service in the cluster. This may be a normal pattern for an application, but if the Network Map shows less traffic than you expect, you may have a configuration issue—for example, one or more invalid host names—that is causing some proxies to be unavailable.
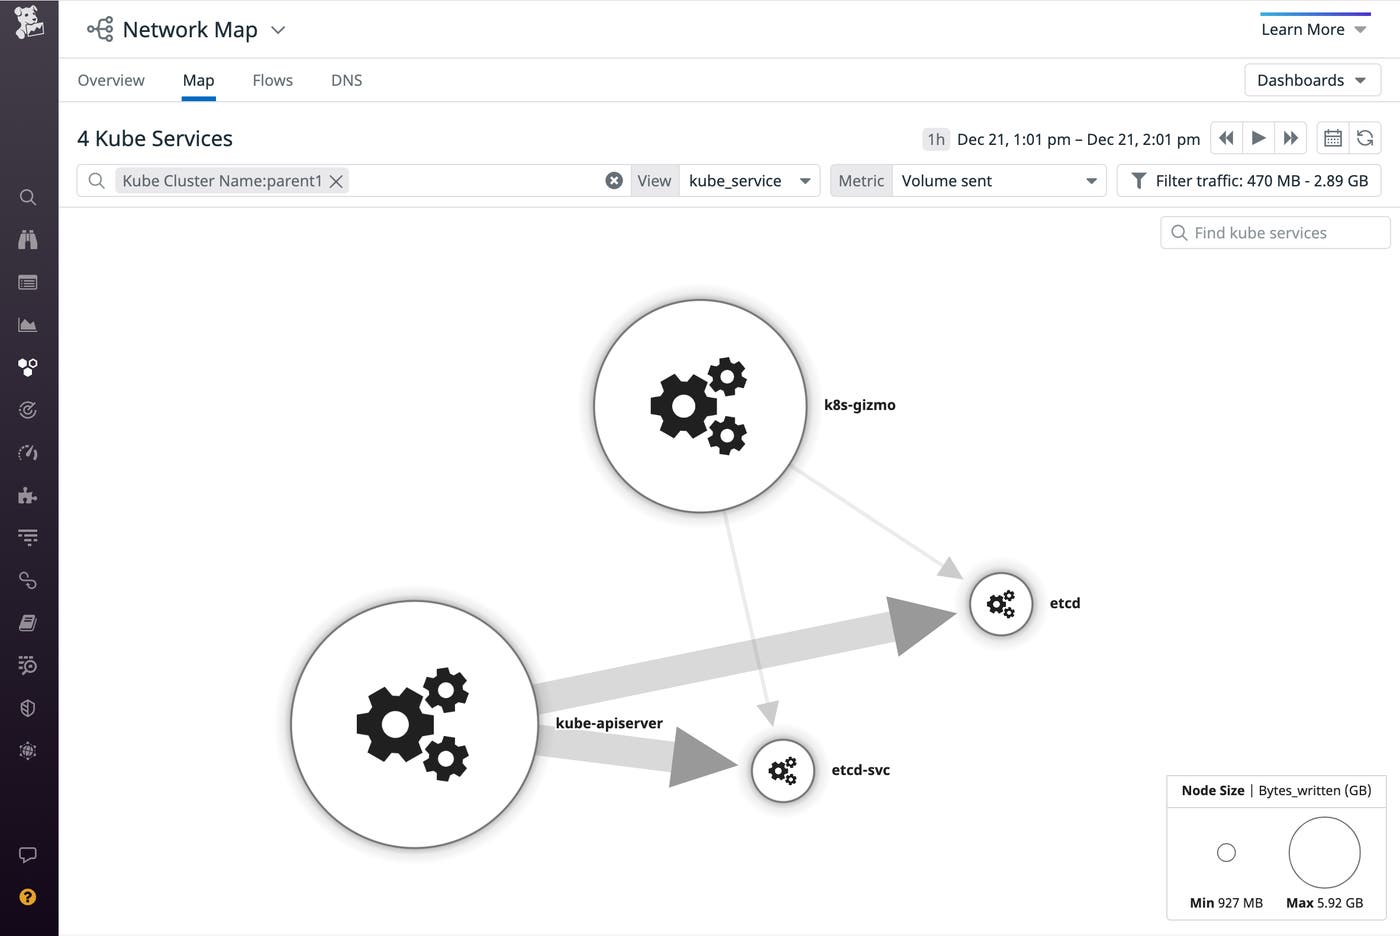
Consul also manages the security of the network, and if the Network Map shows that there's no communication between services, it could indicate incorrect security settings. You can troubleshoot this by reviewing your intentions, which act like firewall rules to define what communication paths are allowed in your Consul cluster. Blocked traffic could also be caused by an issue with Consul's TLS certificates. Consul uses mutual TLS to encrypt data in transit, and also to authenticate the identity of the services that are sending requests. If services can't authenticate due to a Consul configuration error, they won't be able to reach one another.
Monitor the health of your Envoy proxies
When Consul is deployed on Kubernetes, each pod contains both an application container—which runs the service's code—and a sidecar container, which proxies communication to and from the application container. Monitoring the health of your proxies is key in maintaining application performance, and proxy metrics can be invaluable for troubleshooting problems in your microservice architecture.
Consul provides a built-in proxy for development but recommends that you use Envoy in production. Datadog's Envoy integration gives you an out-of-the-box dashboard—shown below—that visualizes the volume, size, and latency of requests your proxies have processed, and the rate of TCP connections opened and closed by each proxy.
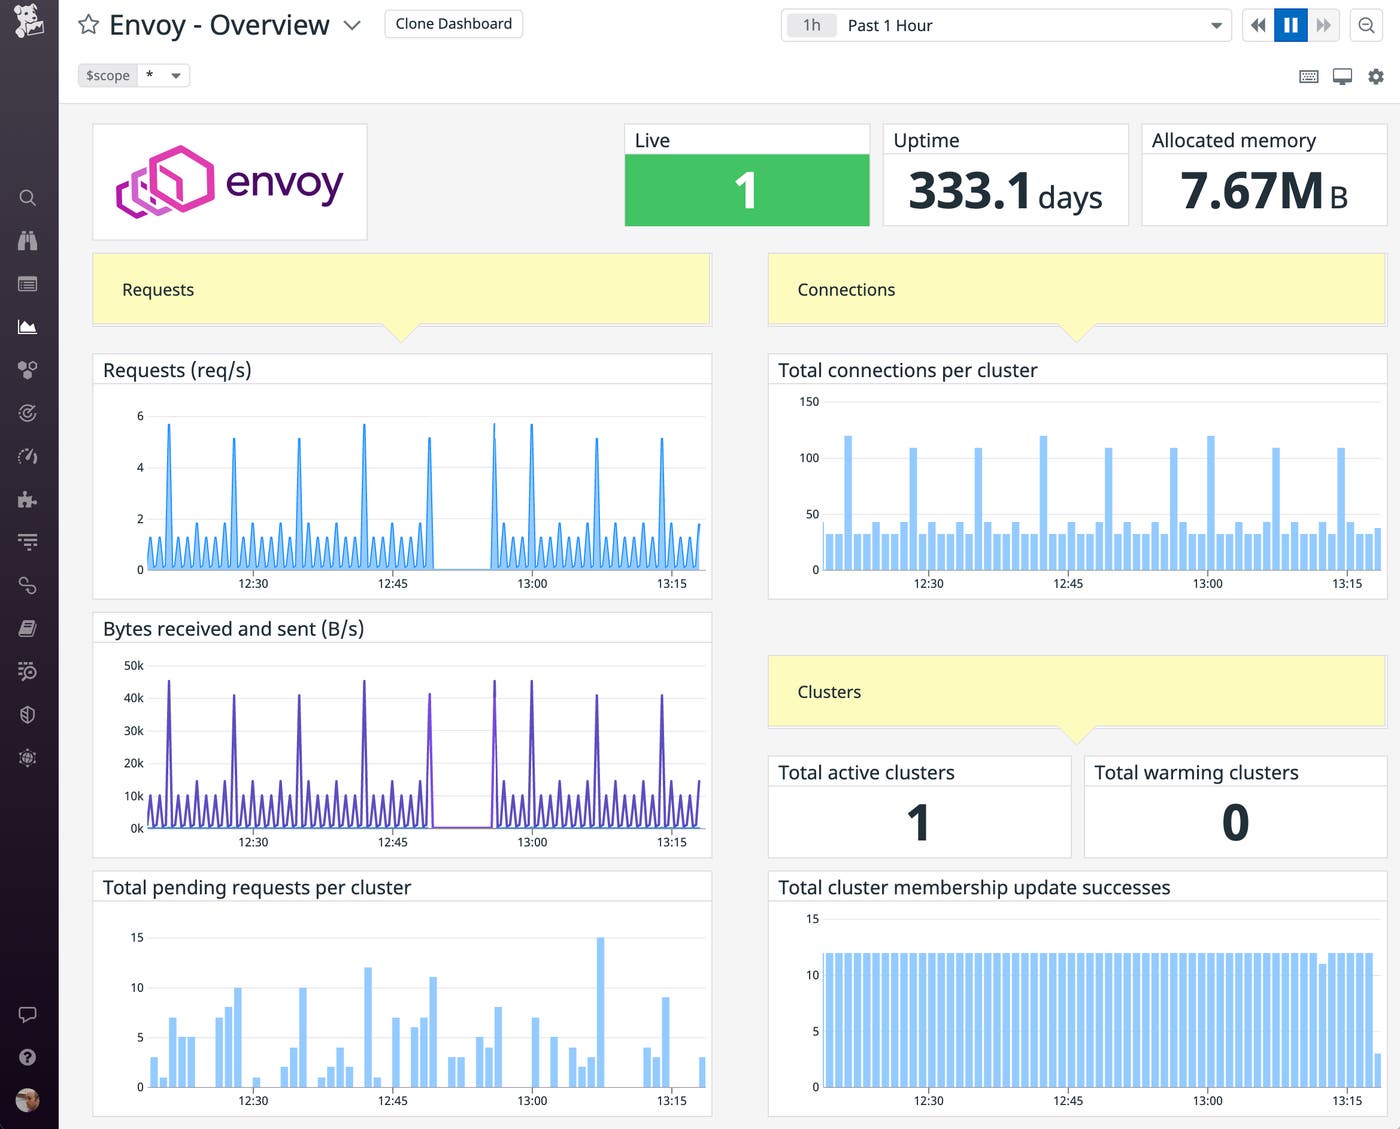
The graphs shown in this screenshot indicate a significant disruption in traffic between proxies, which could be caused by resource constraints on the proxies' hosts. To investigate, you can click a relevant point on the graph to see related hosts and metrics on the host map. The break in traffic could also be due to a misconfigured Consul intention, an expired TLS certificate, or missing environment variables.
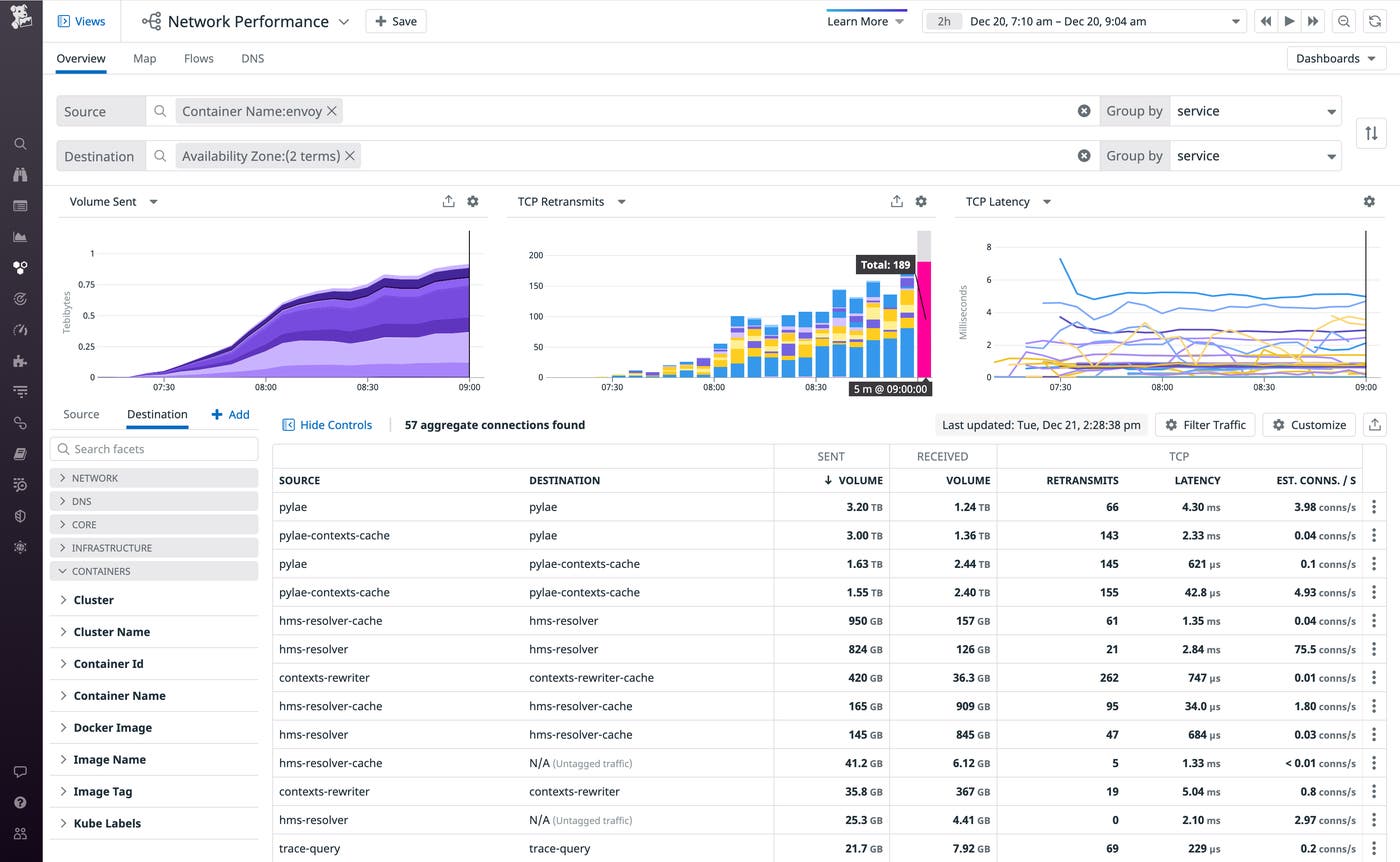
Datadog automatically tags containers with metadata like container_name and image_name, so it's easy to filter your NPM data and explore the traffic sent by your Envoy proxies to any particular subset of your environment, as shown below. You can even see traffic between Consul-managed services and endpoints outside your Consul cluster—including endpoints managed by your cloud provider, such as Amazon S3 and Google Cloud DNS.
In the screenshot below, the Network Page shows traffic from containers tagged container_name:envoy to two different AWS availability zones. The graphs at the top of the page show that the volume and retransmit rate from proxies in all services have increased since just before 7:30. To investigate, you can click a point on the graph to inspect related containers, including their processes and underlying infrastructure.
Correlate and contextualize your Consul monitoring data
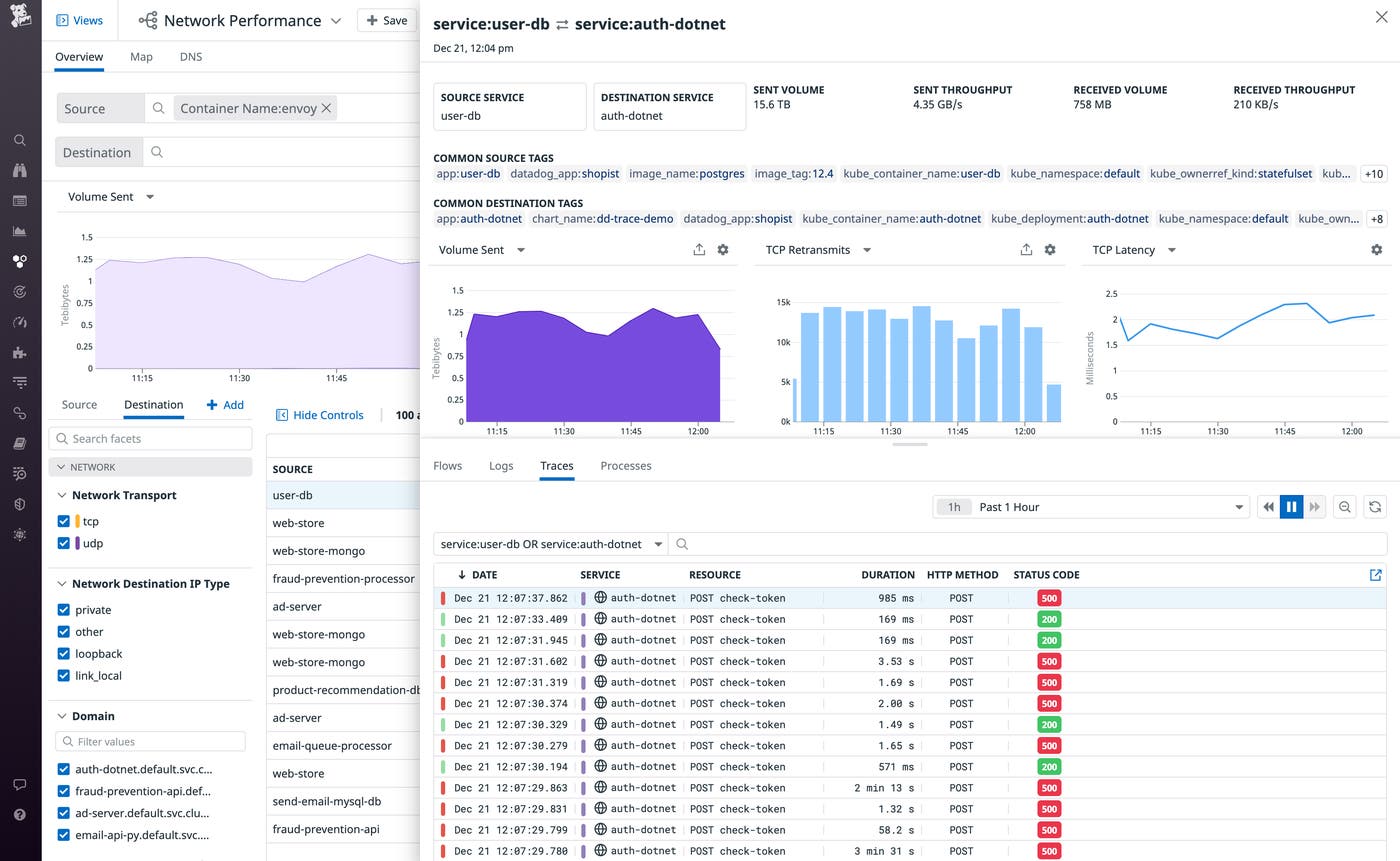
Datadog NPM gives you deep visibility into your Consul network side by side with monitoring data from applications and infrastructure throughout your stack, making it easy to see whether application errors or latency are tied to the health and performance of your Consul cluster. You can inspect individual traffic flows from and to your Envoy proxies, as well as traces, logs, and process data in a single view. The screenshot below shows a list of traces between two services in a Consul cluster. Even though the volume and latency shown in the NPM graphs fluctuates only moderately, the list of traces shows frequent errors and inconsistent durations from the auth-dotnet service, suggesting that the problem stems from application code rather than Consul performance.
In addition to showing you the flow of requests across the data plane, Datadog gives you broader context into the health of your applications that rely on Consul. You can customize your existing dashboards to include Consul metrics, allowing you to easily correlate changes in the performance of your Consul cluster with that of your application or infrastructure. For details about what Consul metrics are most valuable for you to monitor, see our Consul monitoring guide.
For any key Consul metrics you're tracking, you can create an alert based on a threshold you define, or use an anomaly monitor to automatically get notified about unusual Consul behavior. And if your dashboards and alerts indicate Consul performance issues that appear to correspond with a recent configuration change, you can use Automatic Faulty Deployment Detection to investigate and decide whether to roll back the new code.
See inside your Consul cluster with Datadog
Whether you host your own Consul clusters or use the managed control plane provided by HCP Consul from HashiCorp Cloud Platform (HCP), Datadog NPM brings deep visibility into Consul performance so you can quickly detect and remediate any configuration issues or unhealthy proxies.
See our guide to get started on monitoring Consul with Datadog NPM. And check out this blog post for more information about monitoring service meshes with Datadog. If you're not yet using Datadog, sign up for a free 14-day trial.
