Conor Branagan
In late 2014 we announced Availability Monitoring in Datadog, which lets you monitor your hosts, apps, and services and customize alerts for availability issues.
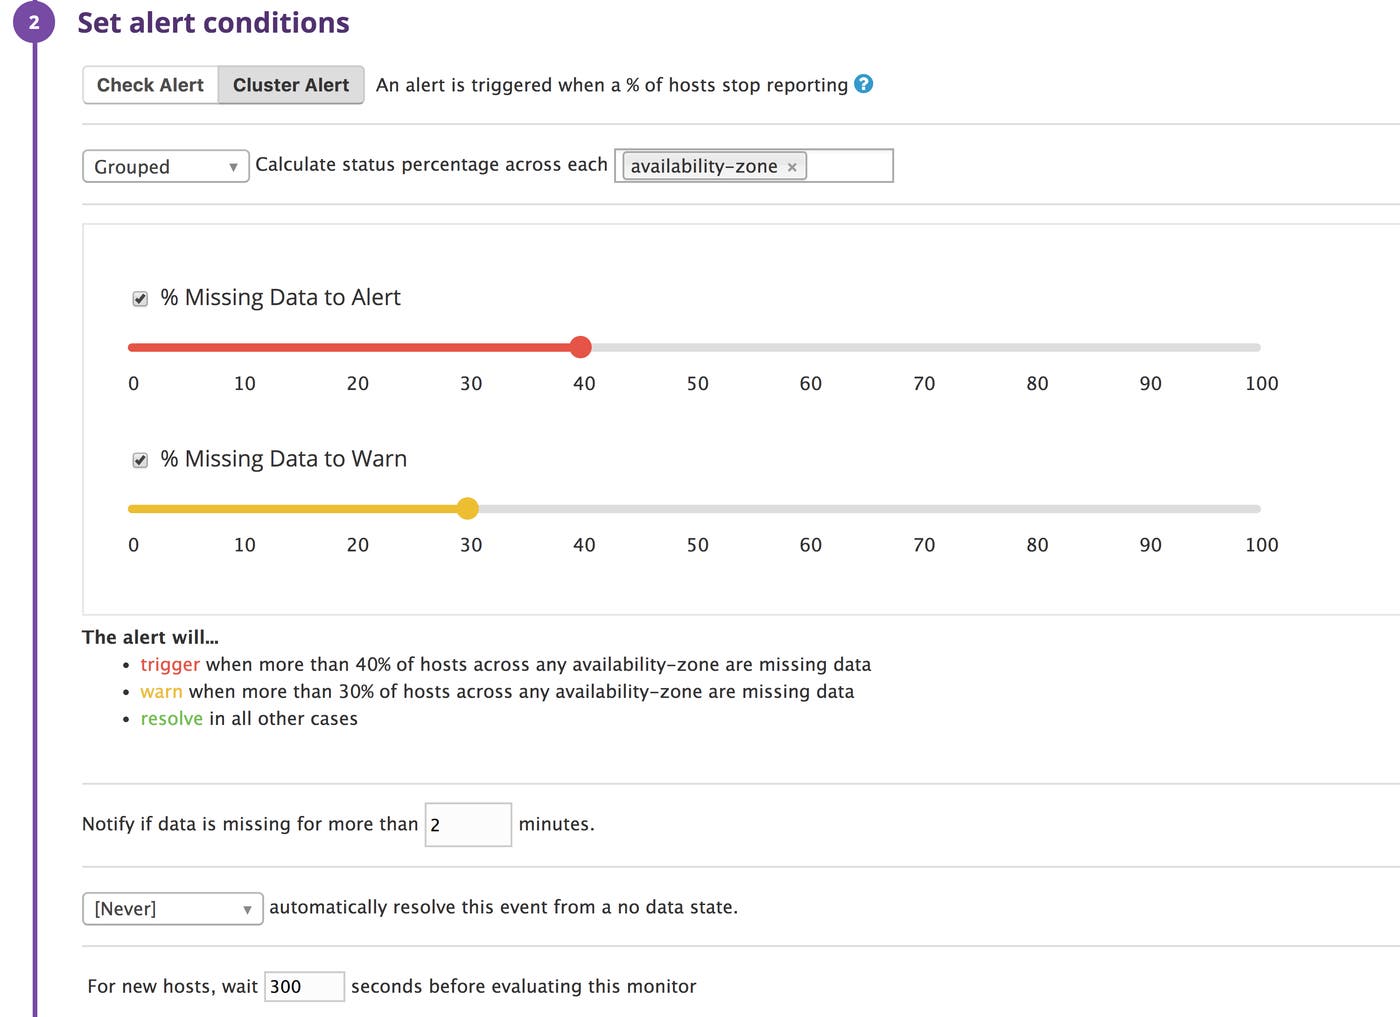
We're pleased to announce a major update to our availability monitoring: you can now set alerts that trigger when a percentage of servers in a given cluster experience availability issues.
Resilient monitoring for cloud-based applications
Traditional availability monitoring lets you set an alert if a server or a single application on a server becomes unavailable. With the rise of cloud-computing and platforms like AWS, it's irrelevant if one server—or even dozens—goes down. What's more important is whether the application or the service as a whole is up and running. And given its distributed nature, that usually depends on the percentage of the total that go down (else, you have a single point of failure).

For example, you may run hundreds or thousands of web servers spread across your infrastructure. You don't want to receive an alert every time a single server goes down; it's too commonplace an occurrence in cloud environments. Unfortunately with traditional monitoring, you either leave all monitors on and you quickly get accustomed to a noisy environment or you turn them all off and risk missing out on a major outage. There was no middle ground.
With the ability to set alerts for percentages of servers at the level of a cluster, you can effectively cut the noise and track down real issues.
Two alert thresholds: Warning and Critical
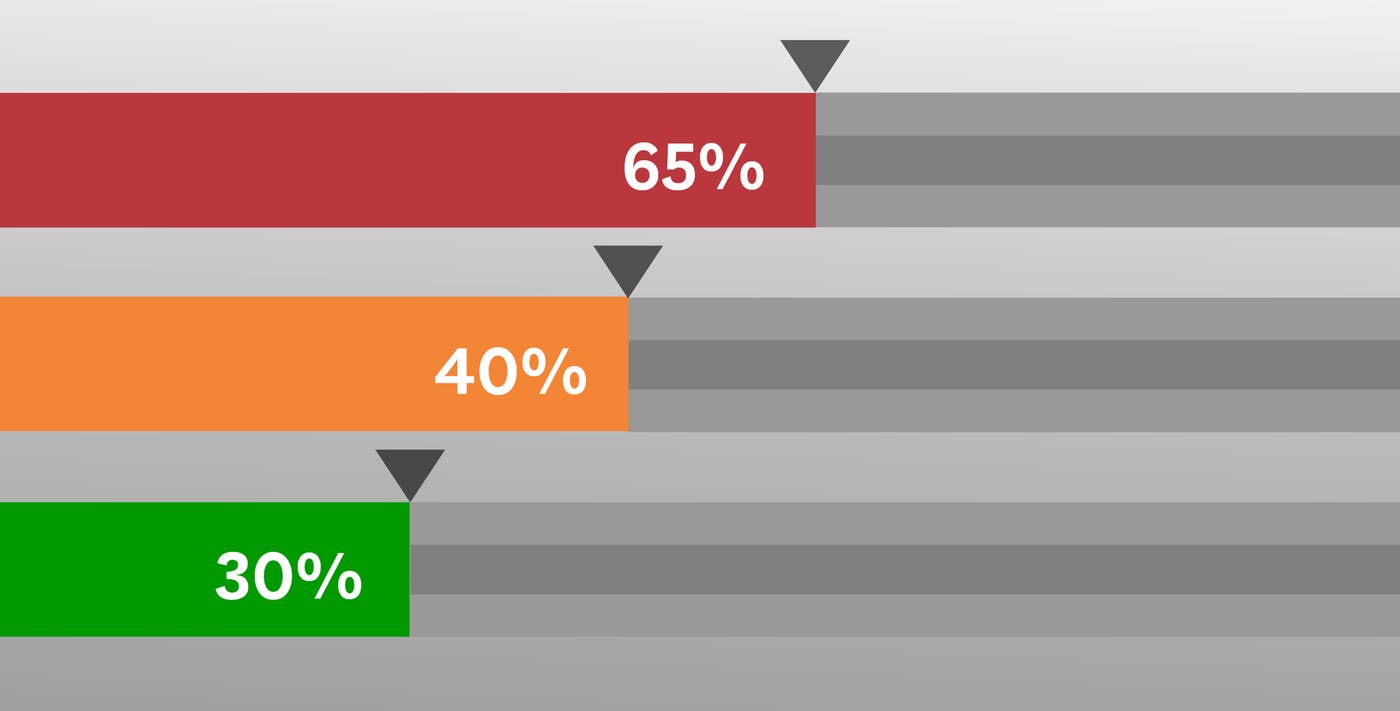
Datadog gives you the ability to set two types of alerts: a Warning alert and a Critical alert. Here's an example of how you might set these alerts. For your web cluster, you might set a Warning threshold of 10 percent and a Critical threshold of 20 percent. So, if 10 percent of your web servers go down, your team would automatically get the Warning alert, and if 20 percent went down, they'd get the Critical alert.
Monitor by availability zone, environment, roles, and other groupings
Datadog gives you the ability to group your alerts by any combination of tags you set up. If your application runs on AWS, you might want to alert when more than 40 percent of servers are down in any AWS availability zone. In this example, you are able to trace the problem to the alerting zone instead of being overwhelmed with the noise of each server going down. If you use a configuration management tool like Chef, you may want to set up a role-wide alert: send a critical alert when 20 percent of all nodes with the role "hadoop-hdfs" go down.

Different groupings can have different alert threshold percentages specified. For example, your database cluster might have a pretty low percentage threshold set before throwing an alarm. Your load balancers, on the other hand, might be much more resilient and could be mostly inactive before any performance issues are noticed, justifying a much higher threshold of unavailable hosts before throwing an alarm.
If you think that your team could benefit from cluster-level service monitoring or improved visibility into their applications and infrastructure, try Datadog for a free 14-day trial. Percentage-based availability monitoring is available after introducing the Datadog Agent on your hosts.

