Matt Williams
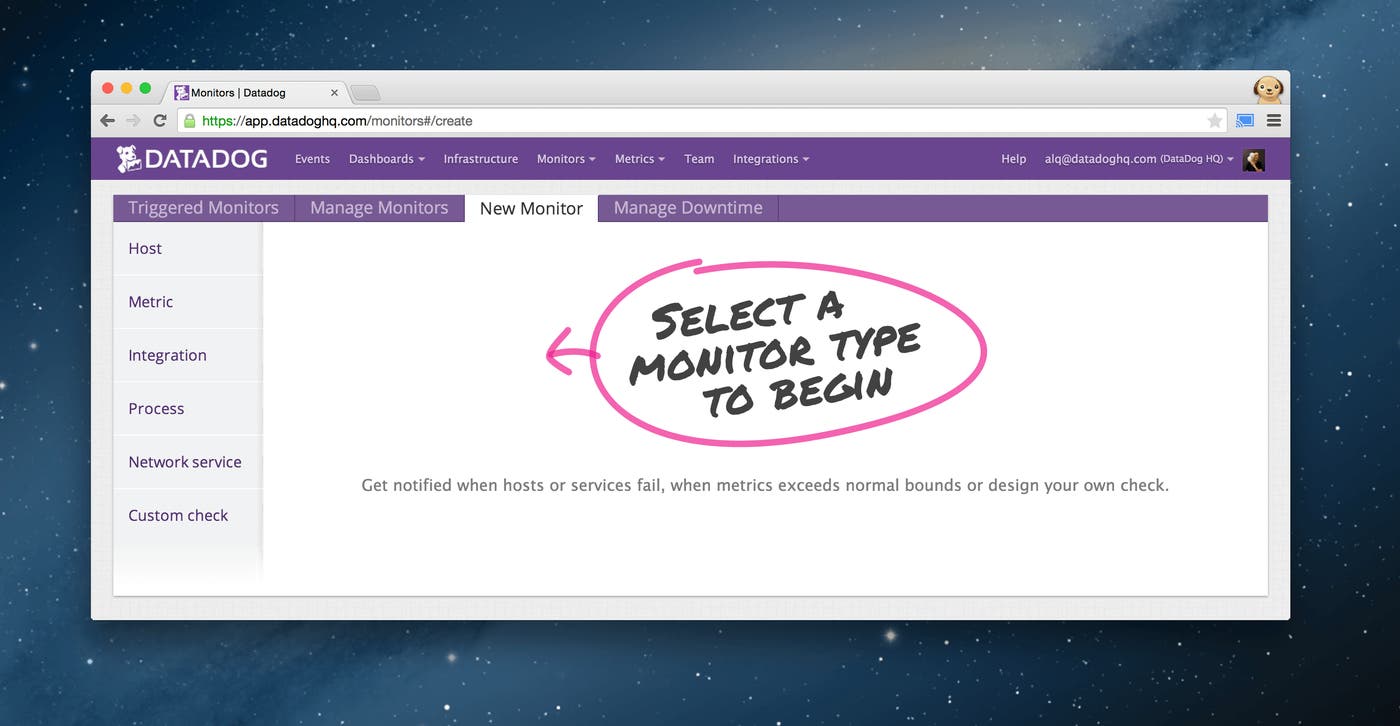
We just released a major extension to Datadog monitors in the Datadog Agent 5.1.0 called Availability Monitoring. Availability Monitoring introduces five new kinds of monitors on top of our existing metric-based ones:
- Host monitors
- Integration monitors
- Network monitors
- Process monitors
- Custom monitors
Metric-based monitors let you monitor apps and services in a sophisticated way. However, sometimes you just want a simpler monitor to know when a host or a service is up or down. That is exactly what Availability Monitoring lets you do.
Like metric-based monitors, the new monitors are particularly well-suited for large-scale deployments thanks to their use of tags. With tags you can apply a host monitor on all hosts that belong to the same environment, are in the same data center, or run the same AWS AMI. There is no need to reconfigure anything if your infrastructure is elastic. Datadog monitors keep up with changes in real-time.
An example: Monitor Elasticsearch
At Datadog we use Elasticsearch extensively to power our correlation engine. Lets look at how you can monitor it effectively using the new monitors on top of the existing metric-based monitors.
In this example we will use two of the new monitors: host monitors and integration monitors, in addition to the existing metric monitors to get comprehensive coverage.
Monitor all Elasticsearch hosts at once
To monitor all Elasticsearch hosts at once you can use the new host monitor. In this example, all Elasticsearch hosts have a tag that lets you track the whole cluster: name:es-events-data. Datadog automatically tags AWS instances and converts Chef roles and Puppet facts into tags. In addition, you can use the infrastructure overview UI or our API to tag hosts. Youll never have to reconfigure the monitor as long as hosts are tagged properly.
Every minute Datadog will check whether it has received a heartbeat from all hosts with that tag and trigger an alert if any host is missing. Datadog can even tell the difference between a host that stopped reporting and one that was terminated on purpose on AWS.
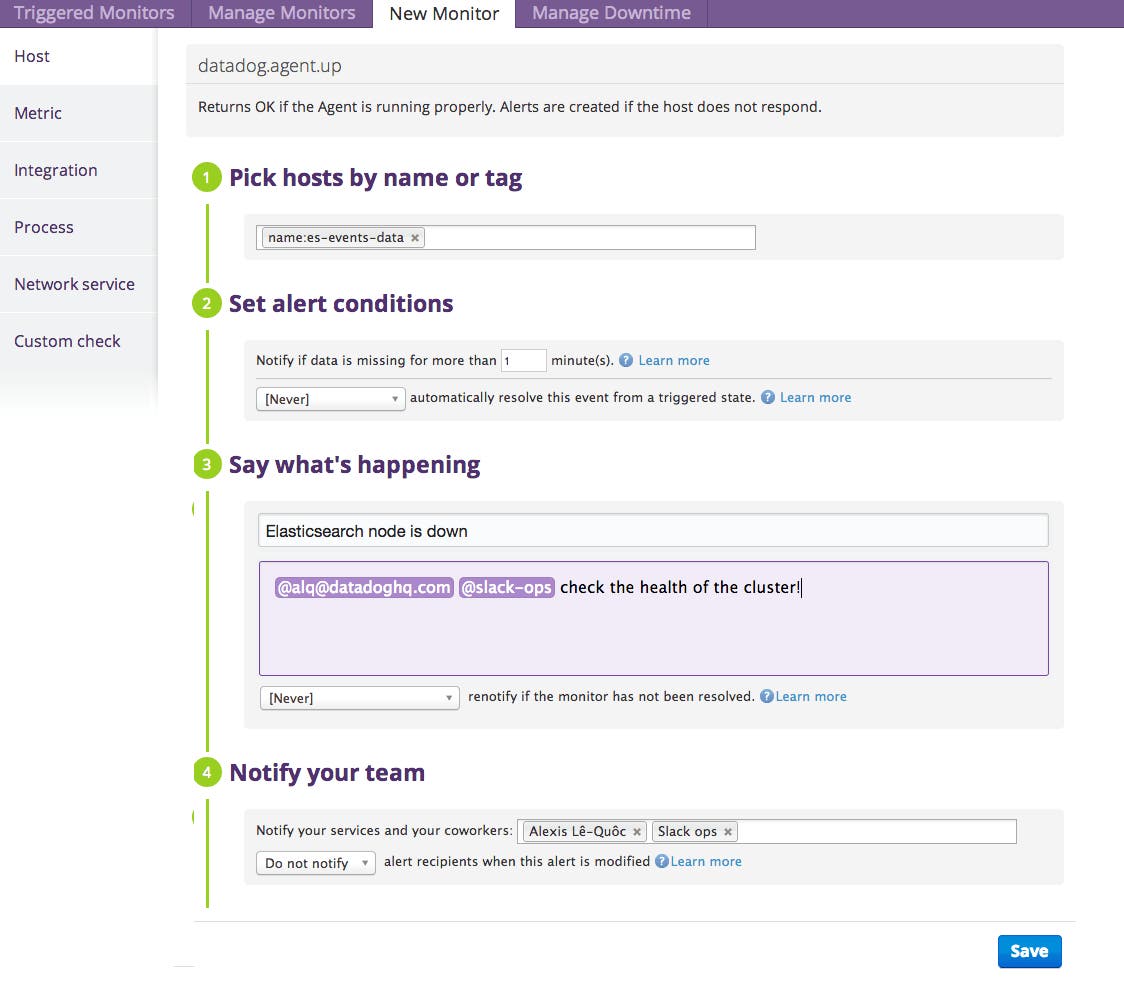
The rest of the monitor definition is one you are already familiar with: say whats happening and decide who to notify in your team.
Monitor Elasticsearch cluster health with an integration monitor
Elasticsearch is a distributed data store: it can survive the loss of a number of its hosts so the host-based monitor is useful but coarse.
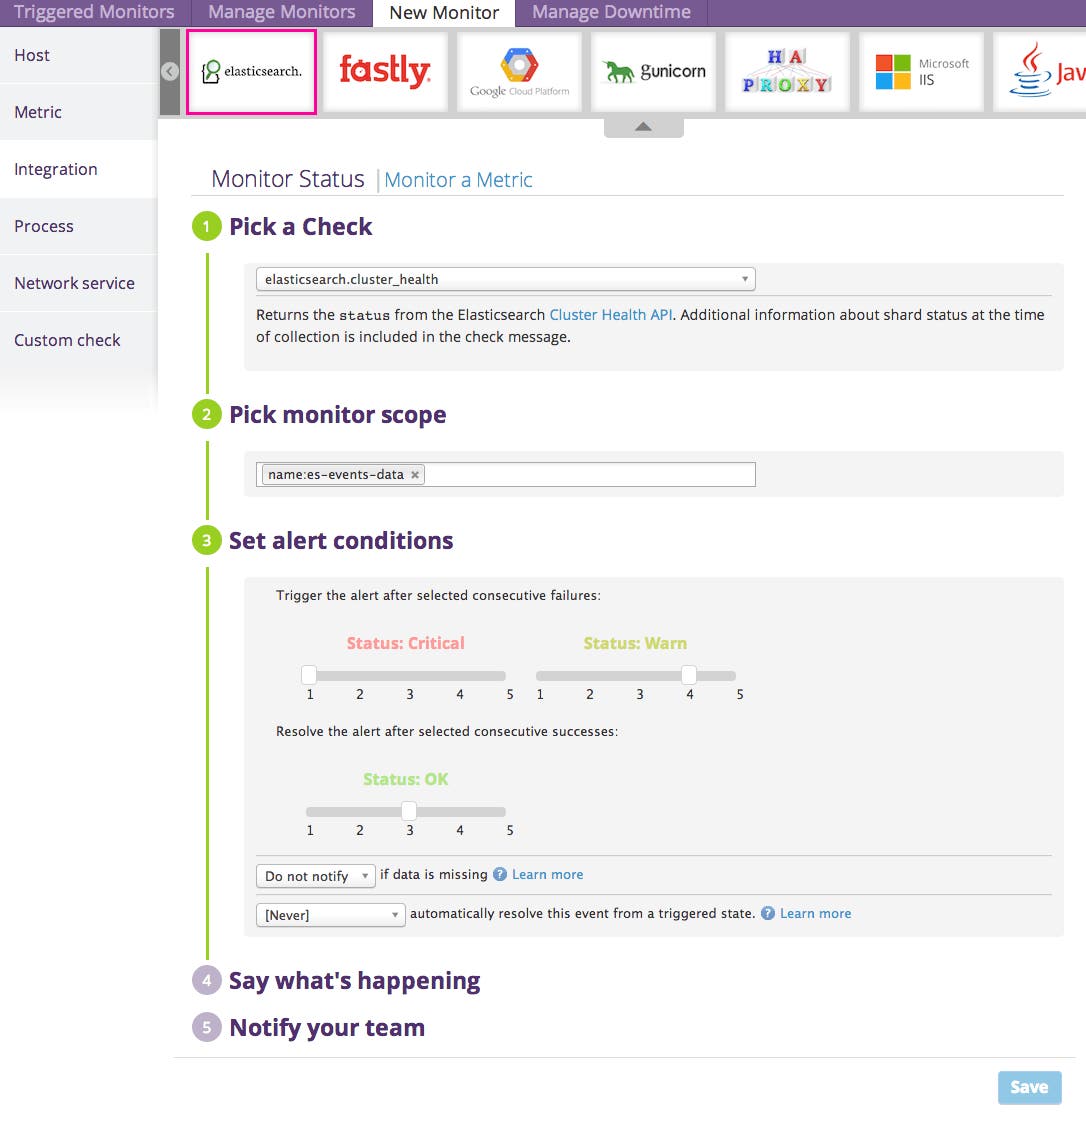
The Elasticsearch integration monitor understands the Elasticsearch cluster health API natively so you can easily alert on the health of the whole cluster, using tags if you have multiple clusters.
Monitor Elasticsearch metrics with a metric monitor
With the previous two monitors, you can track the health of the cluster and that of each individual node. Metric-based monitors give you a more granular view into Elasticsearch.
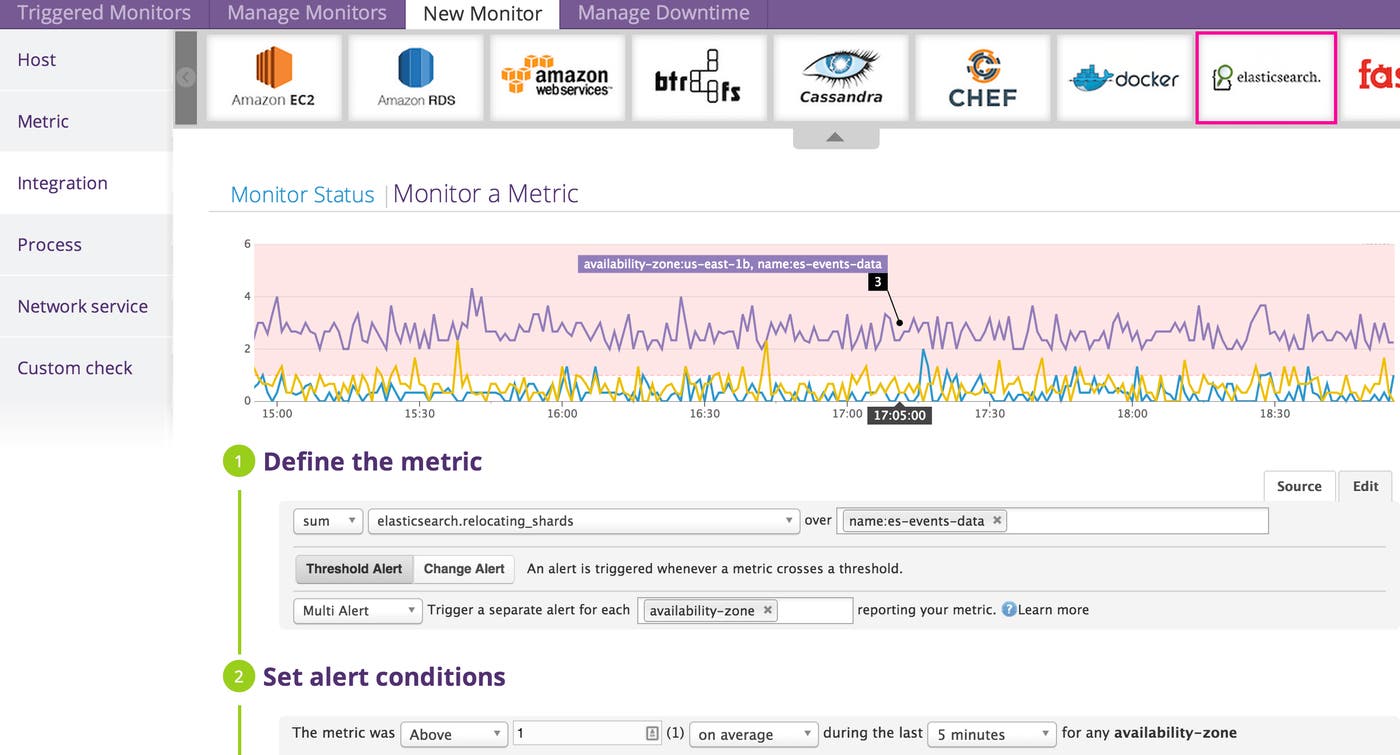
Relocating Elasticsearch shards may negatively affect runtime performance of the cluster so they are a good metric to keep an eye on. The metric elasticsearch.relocating_shards is monitored availability zone by availability zone and triggers if any shard relocates over a period of 5 minutes.
Learn more about monitors
We have updated our API and documentation to describe Availability Monitoring in greater detail. We will follow up this introduction with more in-depth posts. Stay tuned.
If you’re new to Datadog and want the ability to be alerted based on the availability of your hosts and services, sign up for a 14 day free trial and check it out for yourself.

