Nicholas Thomson
Technical Content Writer
As organizations adopt Kubernetes, they face gaps in security, reliability, and observability such as unencrypted communication, lack of multi-cluster support, and missing reliability features like circuit breaking. Buoyant Cloud is the dashboarding and automated monitoring component of Buoyant Enterprise for Linkerd, which helps organizations secure and monitor communication between Kubernetes workloads. Buoyant Cloud measures the health of your Linkerd deployments and proactively alerts you to potential issues—such as unauthorized traffic and required updates—before they escalate.
Datadog now offers an out-of-the-box Buoyant Cloud integration and software license through the Datadog Marketplace so you can monitor and alert on Linkerd workload traffic, rollout events, and metrics alongside telemetry from across your stack.
In this post, we'll show you how to:
Monitor Buoyant Cloud events in Datadog to troubleshoot security issues
Visualize real-time and historical metrics from Buoyant Cloud in Datadog
Monitor Buoyant Cloud events in Datadog to troubleshoot security issues
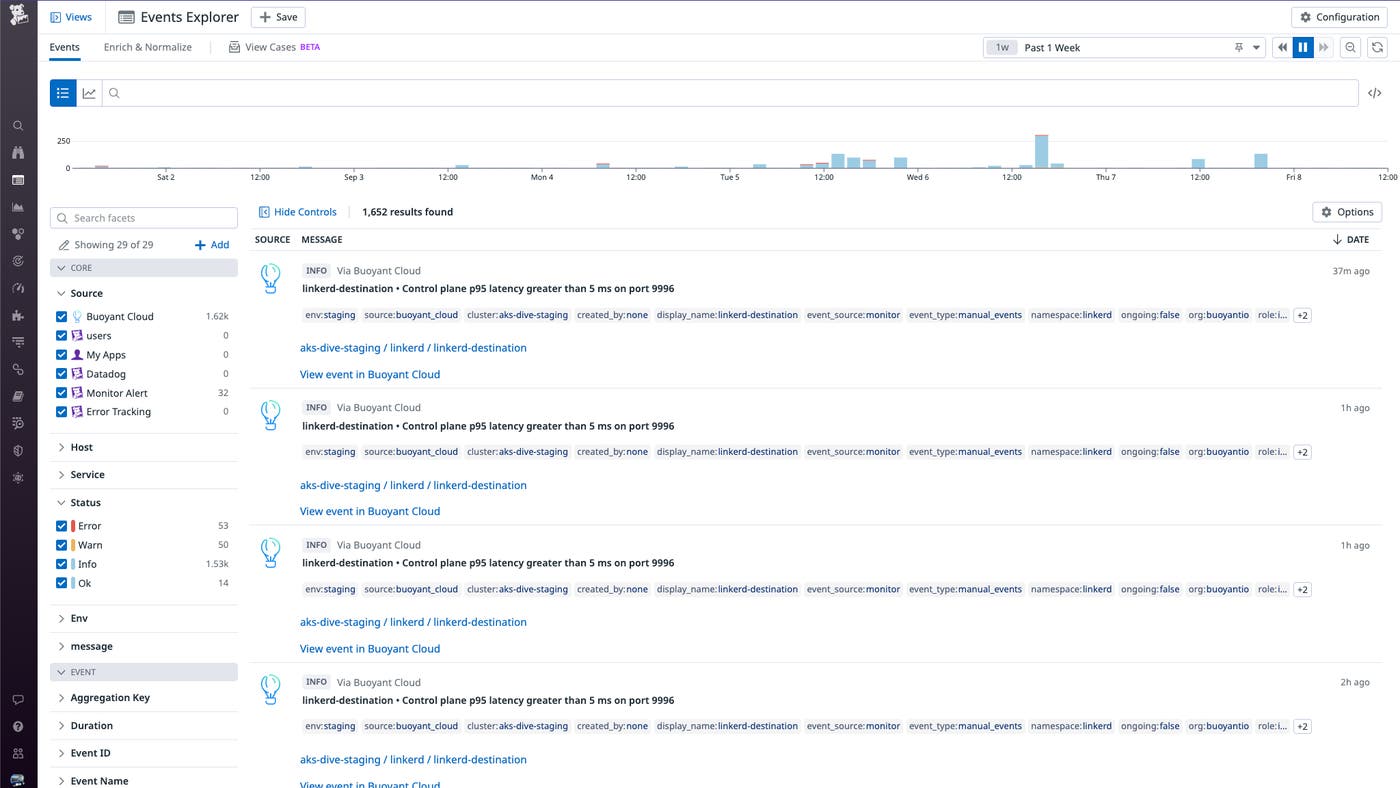
Once you've set up the integration, Buoyant Cloud events will stream into the Datadog Events Explorer alongside events from the rest of your Datadog-monitored services. These events can help you discover issues in your system and provide the jumping-off point for troubleshooting.
Say you're a security engineer at an e-commerce site that runs on Kubernetes. You notice a WARN-level event from Buoyant Cloud at the top of the Event Explorer indicating that traffic has been denied to Port 9000 because it violated Linkerd's zero-trust authorization policies and thus was not allowed to go through.

You click into this event to see more information. Because your team takes advantage of Datadog's unified service tagging, the event is tagged with helpful metadata, such as service, host, cluster-name, availability-zone, and more. This information enables you to correlate this event with other events, metrics, traces, and logs generated by the same service, host, or other attributes in order to get a more holistic picture of how the issue played out across your system.
In this case, the event is tagged with the login service, so you search for other events from this service by filtering in the facet search bar. You find a large number of failed attempts to log in to a user's account. This kind of suspicious activity can be a sign of a brute-force attack—a trial-and-error method used by attackers to gain access to sensitive information such as a password or login credentials. To confirm this, you pivot to the Datadog Log Explorer and search for logs related to the login service. After inspecting the error logs that arise, you find that they all indicate that the login attempts failed due to an incorrect password—further evidence that suggests a brute-force attack.
With this information in hand, you block all incoming traffic from the malicious IP in order to stop brute-forcing attempts while you investigate further remediation steps.
Visualize real-time and historical metrics from Buoyant Cloud in Datadog
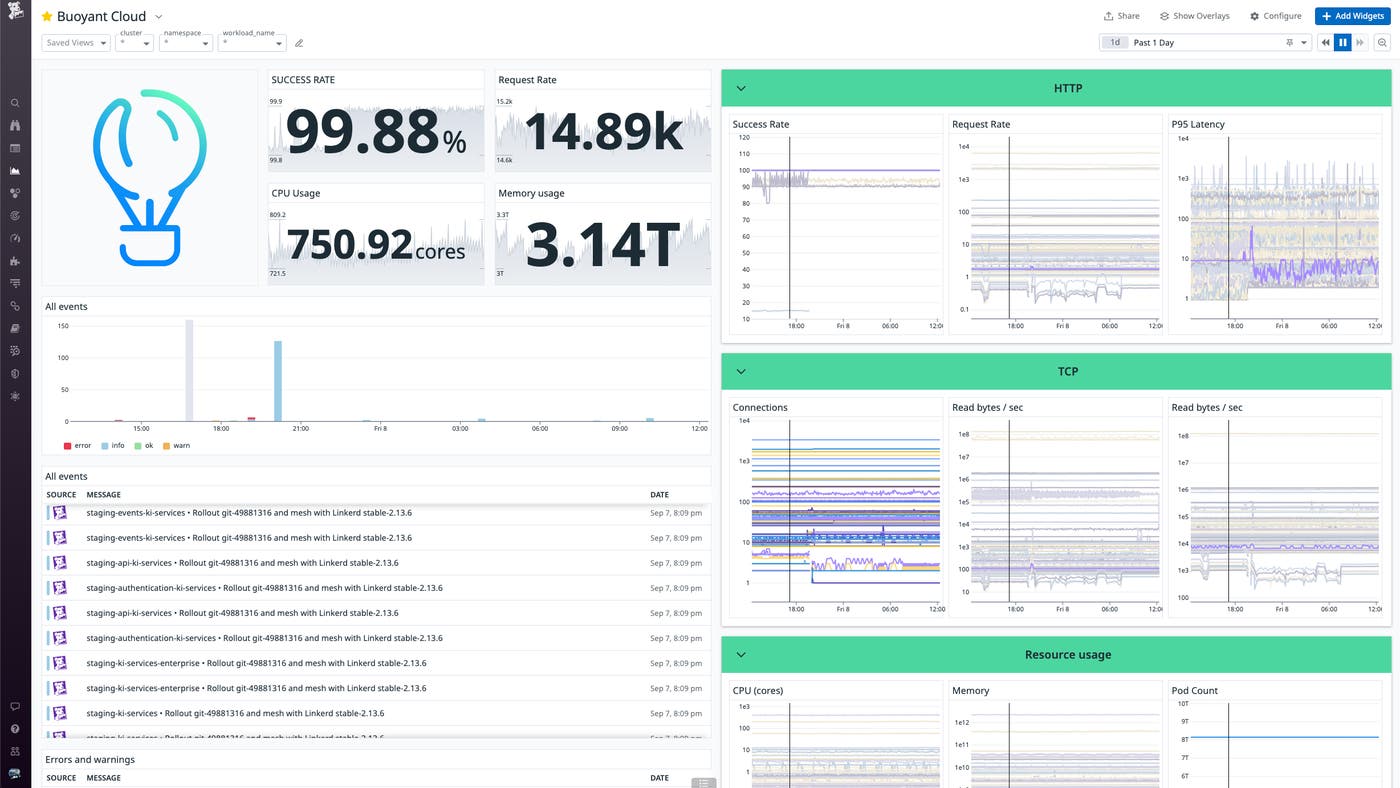
The Buoyant Cloud integration comes with an out-of-the-box, customizable dashboard in Datadog which you can use to monitor critical metrics, such as HTTP and gRPC call success rates, latency percentiles, and request volumes, as well as resource consumption on the cluster.
Say you're a DevOps engineer at the same e-commerce site monitoring the health of your application's workloads. You can view metrics, such as HTTP, TCP, and gRPC call success rates, latency percentiles, and request volumes, as well as resource consumption on the cluster, side by side in the Buoyant Cloud dashboard. Seeing all of this data correlated in once place can help connect the dots when debugging an issue.

During your investigation, you notice that HTTP P95 latency for a certain service is spiking. To dive deeper into the issue, you open Datadog Network Performance Monitoring (NPM) and filter for client and server communications based on the relevant service tags. You discover that that data isn’t being transmitted between two key hosts. Upon further investigation, you determine that one of the hosts is stuck in a CrashLoopBackOff state and decide to contact the infrastructure team to come up with a solution.
Monitor Buoyant Cloud events and alerts in Datadog
Buoyant Cloud enables teams that manage Kubernetes networking via the Linkerd service mesh to automate security best practices and more easily manage network performance. Datadog’s integration with Buoyant Cloud offers deep visibility into Linkerd workloads, allowing teams to correlate the information collected by Buoyant Cloud with Datadog’s powerful monitoring capabilities, including Datadog NPM, Events Explorer, Log Explorer, and Dashboards. Now, joint users can more easily enforce security guardrails and reduce MTTR to ensure their applications remain performant and secure.
If you’re new to Datadog, sign up for a 14-day free trial.
The ability to promote branded marketing tools is a membership benefit offered through the Datadog Partner Network. You can learn more about the Datadog Marketplace in this blog post. If you’re interested in developing an integration or application that you’d like to promote, you can contact us at marketplace@datadog.com.

