Kai Xin Tai
Editor’s note: We’ve continued to expand the capabilities of Bits AI SRE since its launch. To learn more about the latest enhancements, explore our related posts.
Getting paged pulls engineers away from meaningful work, yet incident response in many organizations remains manual, reactive, and draining. An alert fires and teams scramble to find the root cause, relying on siloed knowledge, incomplete context, and a few on-call experts who are already stretched thin. The rise of AI coding agents has only intensified this challenge: As teams ship code faster with less human oversight, production systems grow increasingly complex and harder to understand. More deployments mean more alerts, edge cases, and unexpected failures. Traditional incident response simply cannot keep up in this new reality.
Today, we’re announcing the general availability of Bits AI SRE, an autonomous AI teammate that’s always on call and built for the most complex environments. Bits works completely autonomously, without requiring any initial prompting to begin its work. By the time you get to your laptop after being paged, it has often already identified a likely root cause and even proposed a code fix. Bits reasons like your most senior SRE: It reads the same telemetry, understands the topology of your systems, and follows your runbooks. But unlike a human, it can explore exponentially more hypotheses in parallel to converge on the root cause far faster than any individual could.
In building a truly capable SRE agent, data is the defining factor. To operate effectively in real production environments, these agents must handle the same kinds of messy, high-stakes, interconnected problems that engineers face every day. That meant grounding Bits in how real systems behave, rather than abstracted examples or synthetic failure modes. Datadog processes data from tens of thousands of organizations across every industry, architecture, and scale, capturing a wealth of telemetry as well as critical metadata that provides context. This combination provides Bits an exceptionally deep understanding of how real systems behave. Paired with the unique agentic architecture we’ve built, Bits can reason like an expert SRE: forming hypotheses, understanding how services interact, cutting through noise to pinpoint root causes, and identifying fixes faster than a human ever could.
In this post, we’ll cover how Bits AI SRE’s agentic model of on-call response helps you scale your operations and give engineers time back to do what they love most: building and shipping great software.
Autonomous alert investigation
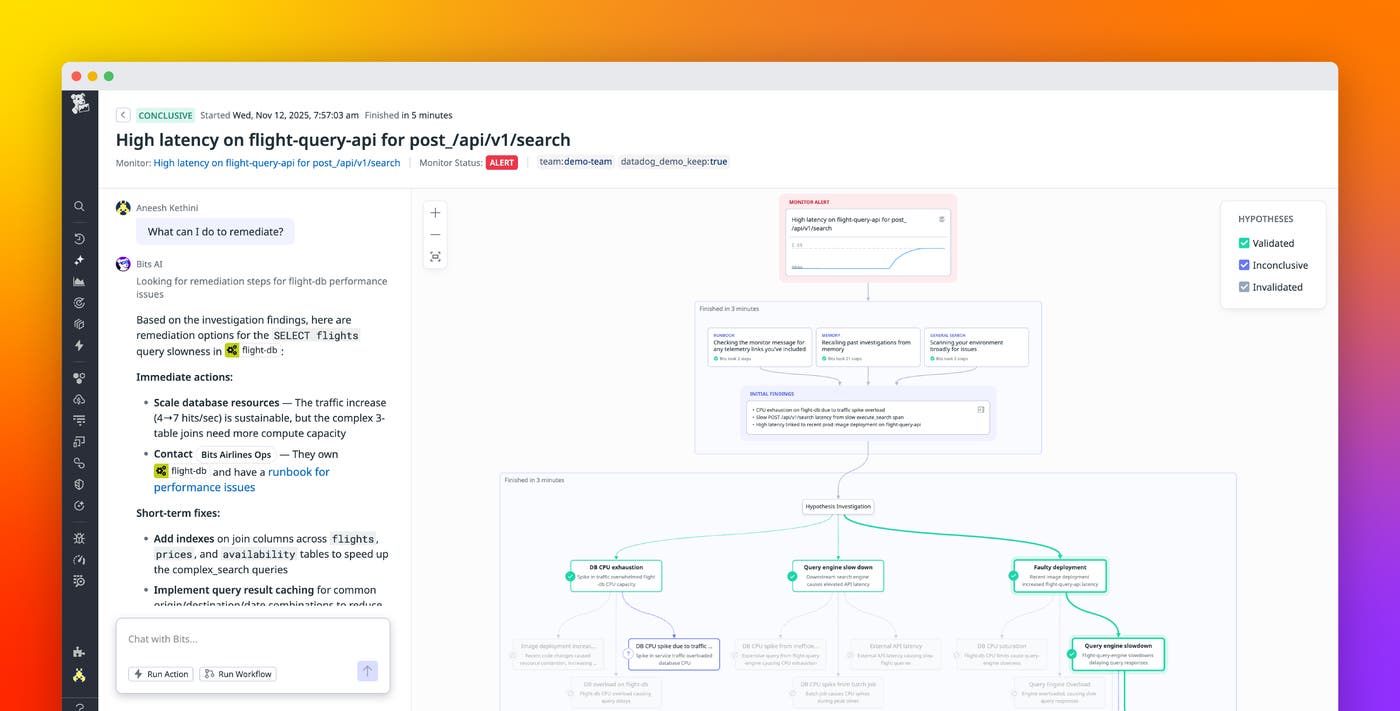
When an alert fires, Bits AI SRE immediately launches an investigation. It starts by gathering context by reading the monitor message, checking linked Confluence runbooks, referencing past investigations of the same monitor, and running exploratory queries across your environment.
Based on what it learns, Bits dynamically generates multiple root cause hypotheses and tests them by querying data across your environment and reasoning over the results. Like an engineer scanning dashboards, analyzing logs and traces, or checking recent changes and Kubernetes events, Bits performs these steps using purpose-built tools. At each step, it decides which tool to call and what additional data to fetch.
Bits methodically invalidates hypotheses without supporting evidence and digs deeper into promising leads. Each hypothesis is classified as validated, invalidated, or inconclusive, enabling teams to quickly see what’s confirmed, what’s ruled out, and where further investigation is needed. What once took more than 30 minutes of manual triage now happens automatically, often before you’ve even opened your laptop.
Now, speed is only part of the story. Bits is a reasoning agent that learns from every investigation. It draws on memory from past alerts to recognize patterns and accelerate investigations. You can correct Bits when it makes a mistake or reinforce its conclusions when it gets them right. Every investigation becomes a feedback loop, making Bits faster, smarter, and more aligned with how your team works.
When Bits identifies a likely root cause, it shares its findings—complete with supporting evidence—back to Slack, so engineers can quickly review or build on the analysis. In addition to Slack, Bits is natively integrated into the Datadog mobile app, On-Call, and Case Management (fully synced with ServiceNow and Jira), ensuring collaboration continues seamlessly across the tools you rely on for your on-call operations.
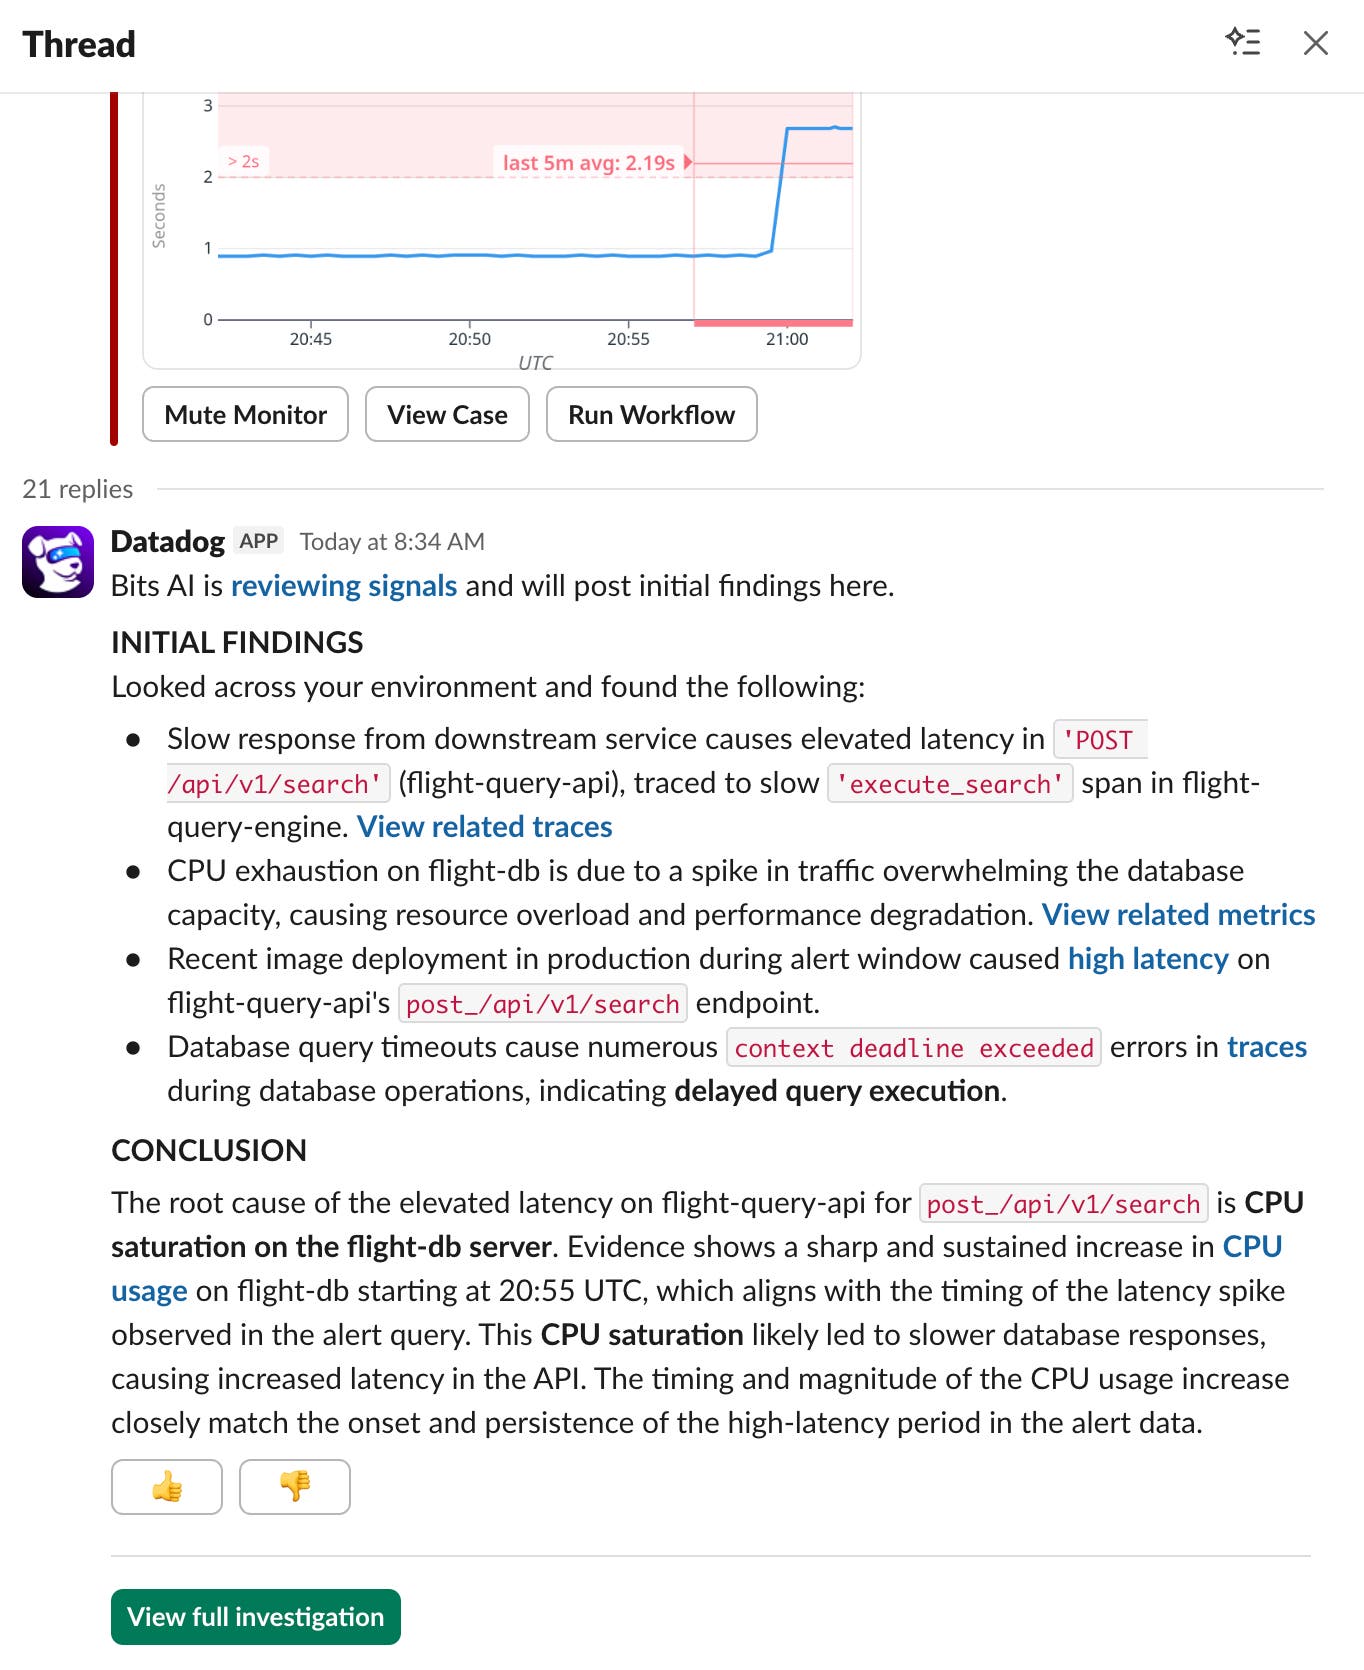
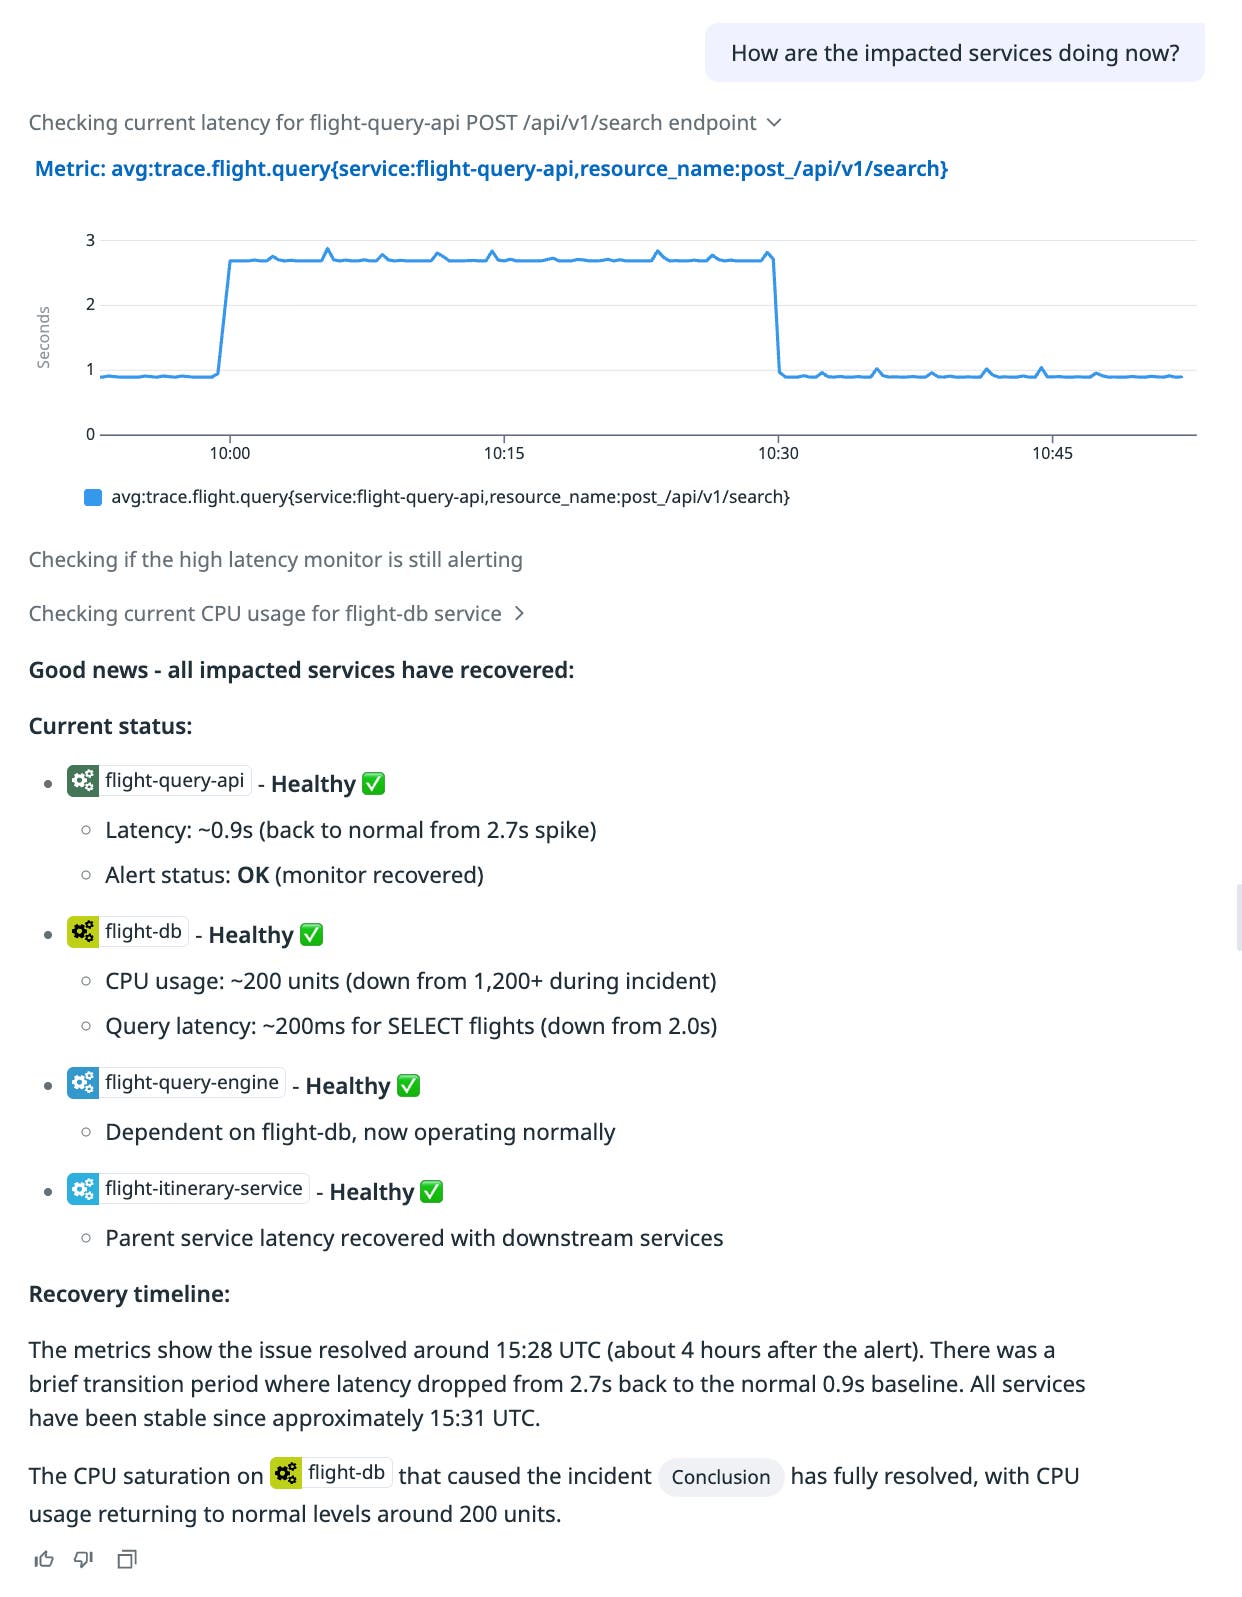
Last but not least, you can chat with Bits to ask clarification questions about an investigation, request further analysis on certain steps, retrieve service ownership details, query additional telemetry, assess customer impact through RUM, or search documentation, all in natural language. Because Bits has full context of both the investigation and your Datadog environment, it responds with rich widgets and citations to the exact points in the investigation it references, making it easy to verify and trust its answers.
New capabilities, now in preview
Since our limited availability earlier this year, thousands of organizations have used Bits AI SRE in production, and feedback has been overwhelmingly positive. Many customers have highlighted Bits’ ability to identify root causes in minutes, and in some cases, prevent incidents entirely.
Today, we’re extending Bits’ capabilities along three dimensions that reflect where we’re taking the product next: going deeper into remediation, expanding the surface area for launching investigations, and connecting proactive detection with immediate root cause analysis. These features are now in private preview, which you can sign up to try:
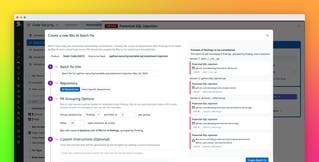
- Generate code fixes: Once Bits AI SRE identifies a code-related root cause, the Bits AI Dev Agent takes over to propose a fix. Engineers can review and merge the resulting pull request directly, resolving the issue from end to end without starting from scratch.
- Investigate synthetic API test failures: Run autonomous investigations on failing synthetic API tests to quickly pinpoint what’s breaking and why.
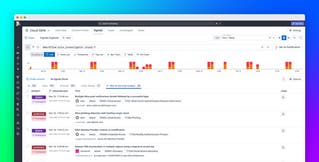
- Start investigations from APM latency graphs and APM Watchdog stories: Not every issue is triggered by an alert. You can now launch investigations directly from latency graphs on the APM service page and from APM latency Watchdog stories.
- Recommended actions: Bits AI SRE now suggests next steps based on its findings and lets you execute triage actions, like sending summaries to Slack or creating Jira tickets, with a single click.
Bits AI SRE reimagines the way you run operations
Bits AI SRE introduces a new way to operate production systems, one designed for the scale, speed, and complexity of AI-augmented software delivery. Like a true teammate, Bits deeply understands your systems, analyzes telemetry in real time, applies structured reasoning, and continuously learns from every investigation. Unlike simple chat-based assistants that require you to prompt your way to a root cause, Bits operates as a deep research agent, independently performing complex, multi-step root cause analyses across your entire stack. By automating the heavy lifting of investigation, Bits bridges the gap between human reasoning and AI-scale complexity, keeping pace with the velocity of modern software delivery. And because it takes on the most time-consuming parts of on-call work, engineering teams save meaningful time every single day.
Get started with Bits AI SRE today. If you don’t already have a Datadog account, sign up for a 14-day free trial.
