Ryan Warrier
Knowing how to deploy and run applications has become a key part of modern app development, meaning that developers need expertise in a number of areas beyond their core application code. Whether it’s container orchestration, networking, scaling, or load balancing, there is a steep learning curve to being able to deploy and run an application at scale.
To solve this problem, Amazon has launched AWS App Runner, a new service that makes it extremely simple for customers to deploy and run containerized versions of their web applications, mobile backends, and API services. Customers simply provide their source code or a container image and App Runner automatically handles the build, deployment, load balancing, and TLS encryption of their application. And, because it's backed by AWS Fargate, App Runner can automatically scale your application containers to ensure availability and performance without your needing to worry about provisioning additional infrastructure.
Monitoring your applications managed by AWS App Runner is vital to ensuring that they are secure and perform as expected, and that you have configured the App Runner service appropriately. As a launch partner, Datadog fully integrates with AWS App Runner and collects key metrics, logs, and events, giving you full visibility into your containerized applications.
In this post, we’ll walk through how Datadog can help you:
Identify and troubleshoot errors
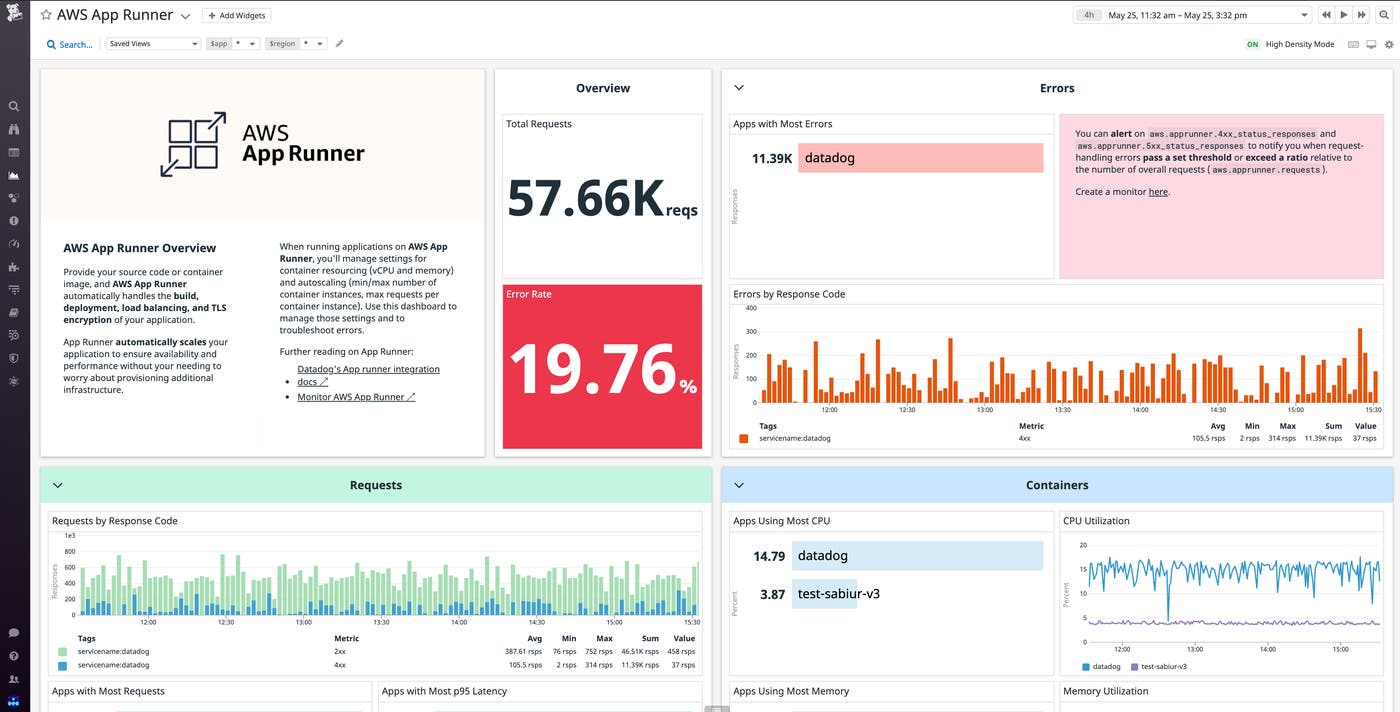
For any application, you’ll want to know about any spikes in request-handling errors so you can immediately begin troubleshooting. You can use Datadog to track client- and server-side request error counts across your applications managed by AWS App Runner. You can alert on key metrics like aws.apprunner.4xx_status_responses and aws.apprunner.5xx_status_responses to notify you when request-handling errors pass a set threshold or exceed a ratio relative to the number of overall requests (aws.apprunner.requests).
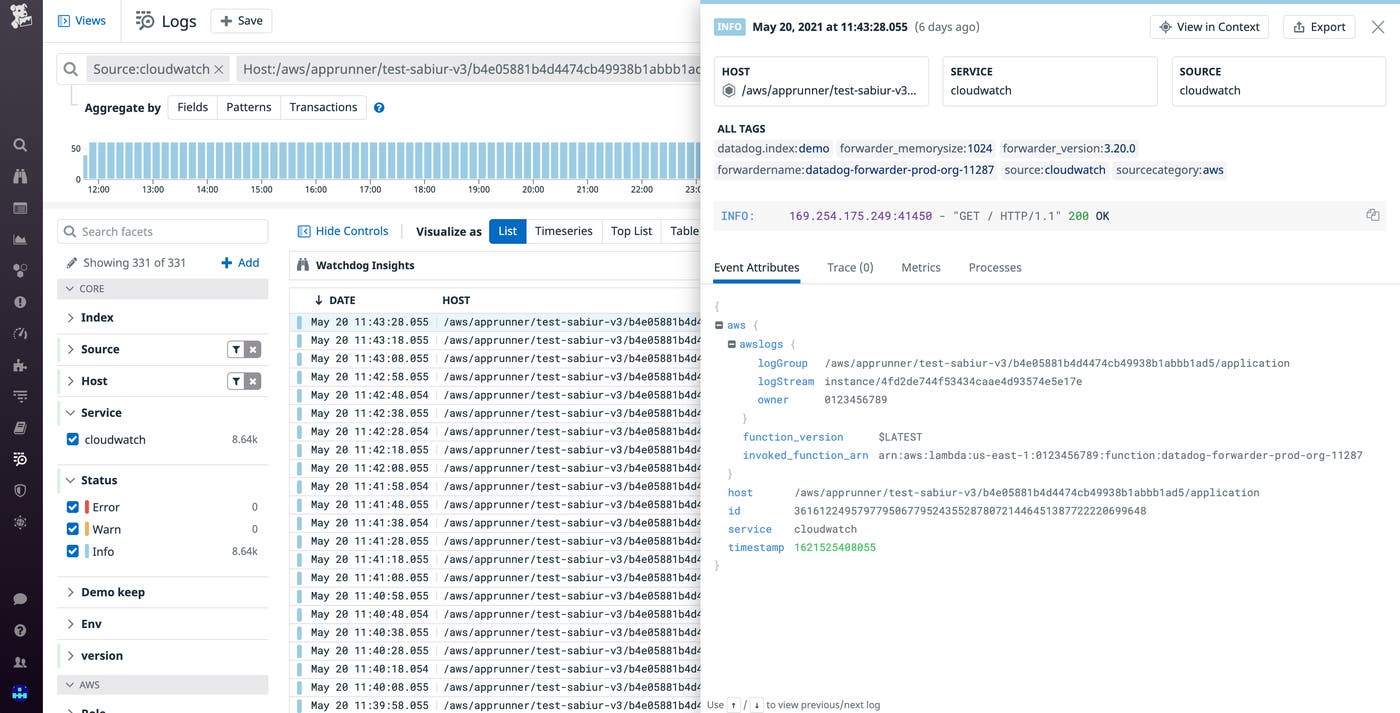
Once you notice an increase in errors, you’ll want to determine what might be causing this as quickly as possible. A great starting point is to look at your application logs to see if this is an issue with your application logic or dependencies. You can use Datadog’s AWS log integration to send logs from your application's CloudWatch application log group and view them in Datadog’s Log Explorer. You can scope your logs to the specific time periods when errors occurred, or use the Live Tail view for real-time troubleshooting.

It's also important to know if errors are related to any deployed changes to your application. AWS App Runner has a separate service log group for detailed logs on all builds and deployments, as well as service status change events. By forwarding logs from this log group to Datadog, you can get greater context around changes to your application to help determine if the issues you are seeing are correlated to a recent deployment.
For App Runner service and status change events specifically, you have an additional option to ingest these into Datadog as events, which you can see in an event stream feed on your dashboards right alongside your metrics. AWS sends App Runner events to EventBridge, and you can use EventBridge API Destinations to push these events to Datadog’s events API.
Manage application resourcing and auto-scaling
There are two types of settings AWS App Runner requires to properly handle resourcing and scaling for your application. The first is the number of vCPUs and the amount of memory to allocate per container instance. The second is auto-scaling rules where you define the minimum and maximum number of container instances your application can be scaled to, as well as the maximum number of concurrent requests each container instance can process. Alerting on and visualizing resource metrics and work metrics for your container instances and correlating that information with how many instances your application is running is key to making the correct adjustments to these settings to lower costs and improve performance.

Manage application underprovisioning
If your App Runner resources are underprovisioned, increases in application usage and the number of aws.apprunner.requests could result in performance issues. For example, with the help of a Datadog monitor or dashboard, you might see an increase in aws.apprunner.request_latency, indicating a slower experience for your users. Alternatively, you may observe high percentages for the average aws.apprunner.cpuutilization or aws.apprunner.memory_utilization across your application containers, implying further spikes in requests could exhaust those resources. If all of those metrics look fine, you still may be in trouble if aws.apprunner.active_instances, the number of container instances actively processing HTTP requests, is getting close to your configured setting for the maximum number of possible container instances.
Depending on the situation, the remedy for this underprovisioning could be one or a combination of adjustments to the resourcing and auto-scaling settings. For performance degradation and resource overutilization, you may solve the issue by increasing the number of vCPUs and amount of memory allocated to each container, or by decreasing the number of maximum concurrent requests each container can process. If you are running out of the number of instances that can be provisioned, you either need to increase your maximum number of container instances or increase the number of concurrent requests each container can process.
Manage application overprovisioning
To know if you are overprovisioned, the key scenarios to look for are if you are consistently underutilizing your vCPUs and allocated memory, or if you are not using your minimum number of provisioned container instances. For resource underutilization, you will want to observe if aws.apprunner.cpuutilization and aws.apprunner.memory_utilization consistently stay in the lower percents. For configuring your minimum number of containers, you should watch to see if aws.apprunner.active_instances stays consistently below your configured minimum number of container instances, meaning that your application is provisioning container instances it isn't using.
To solve the resource underutilization problem, the solution could be as simple as lowering your vCPUs and memory per container, or increasing the number of concurrent requests each container can process. If you choose the latter, make sure it doesn’t degrade application performance. If your minimum number of containers setting is too high, you should simply decrease that number.
Monitor the security of your service
Beyond errors, performance, and cost, knowing your application is secure is another area where monitoring can help. AWS App Runner is integrated with AWS CloudTrail, and every AWS action is audited and logged. You can integrate your CloudTrail logs via Datadog’s CloudTrail integration and set up monitors and saved views to catch any unauthorized accessing or managing of your App Runner service.
Get started
With our new integration, you can monitor key metrics, logs, and events from your AWS App Runner applications along with the rest of your AWS infrastructure and more than 1,000 other services and technologies.
If you already have Datadog’s AWS Integration installed, you can start collecting metrics from your applications managed by AWS App Runner in minutes by going to the AWS integration tile, checking “AppRunner” in the left sidebar, and then updating your configuration at the bottom left of the page. To collect App Runner logs and events, follow the steps in our documentation. If you're not already a Datadog customer, get started today with a 14-day free trial.

