Jinwu Liu

Jonathan Parisot
Datadog collects a wide range of telemetry, from infrastructure metrics and logs to traces and cloud cost data. But when you need to explore relationships across datasets or conduct deep analysis, basic querying may not be enough. Historically, teams have had to export data into scripts, spreadsheets, or BI tools for more flexible investigation.
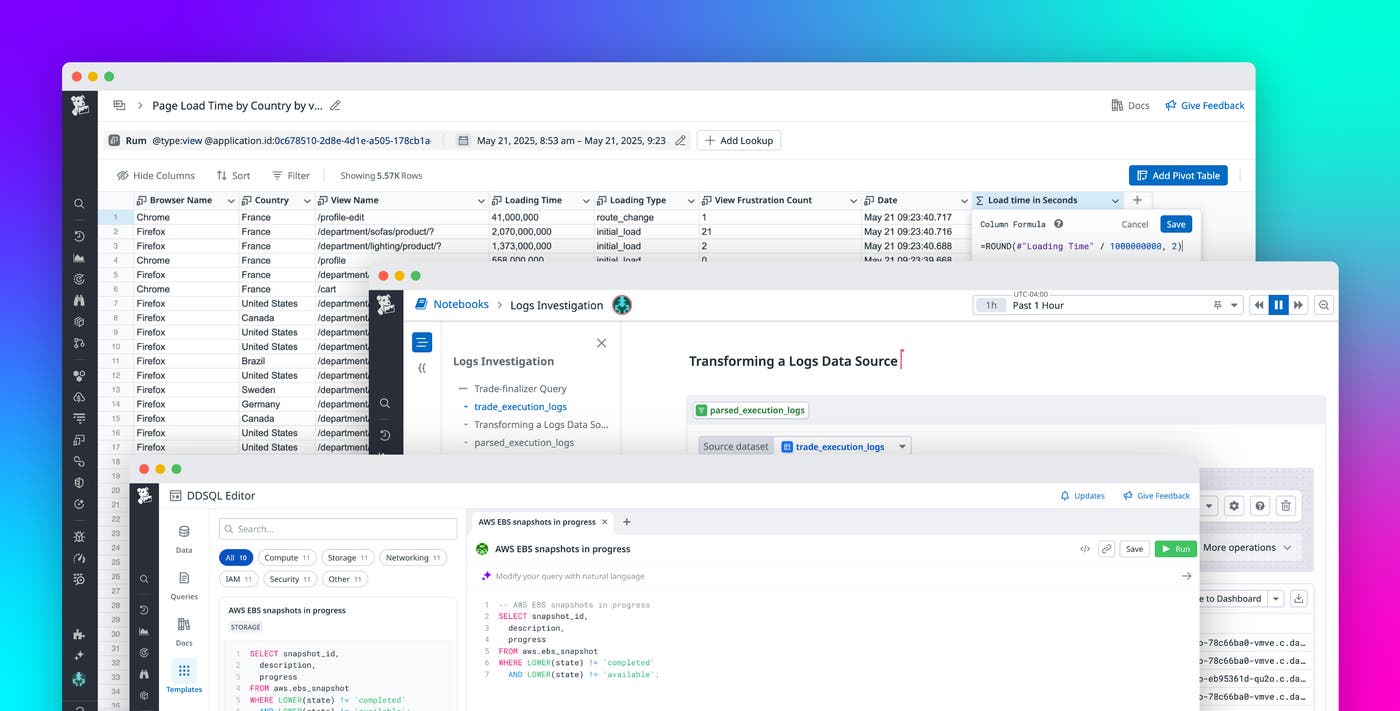
Now, Datadog offers three built-in tools designed for advanced, customizable analysis: Sheets, DDSQL Editor, and advanced analysis features in Notebooks. These tools enable you to ask complex questions and visualize the resulting insights, all without leaving the platform. Each tool supports a distinct workflow and user profile, from spreadsheet users to SQL analysts to engineers documenting investigations.
In this post, we’ll look at how each tool supports different types of analysis, including:
- Analyze telemetry data in a familiar, spreadsheet-style interface with Sheets
- Write SQL to query and join datasets across sources with DDSQL Editor
- Chain together multistep queries for iterative, visual exploration in Notebooks
Explore data in a familiar spreadsheet interface with Sheets
For teams that are already fluent in spreadsheet workflows, Datadog Sheets offers a flexible and intuitive way to manipulate large volumes of telemetry data, including logs, RUM events, infrastructure metrics, and cloud cost data. You can create calculated columns, sort and filter rows, and visualize your results, all within a familiar grid view.
You can use Sheets to filter and investigate logs, such as by isolating entries with status:error or parsing logs messages with calculated columns. You can extract values like document reference IDs, account IDs, or products per request using regex, then count unique errors or analyze error volume by service with pivot tables. You can also use pivot tables to summarize errors by method or region, or create high-level reports with metrics grouped by dimensions relevant to your team.
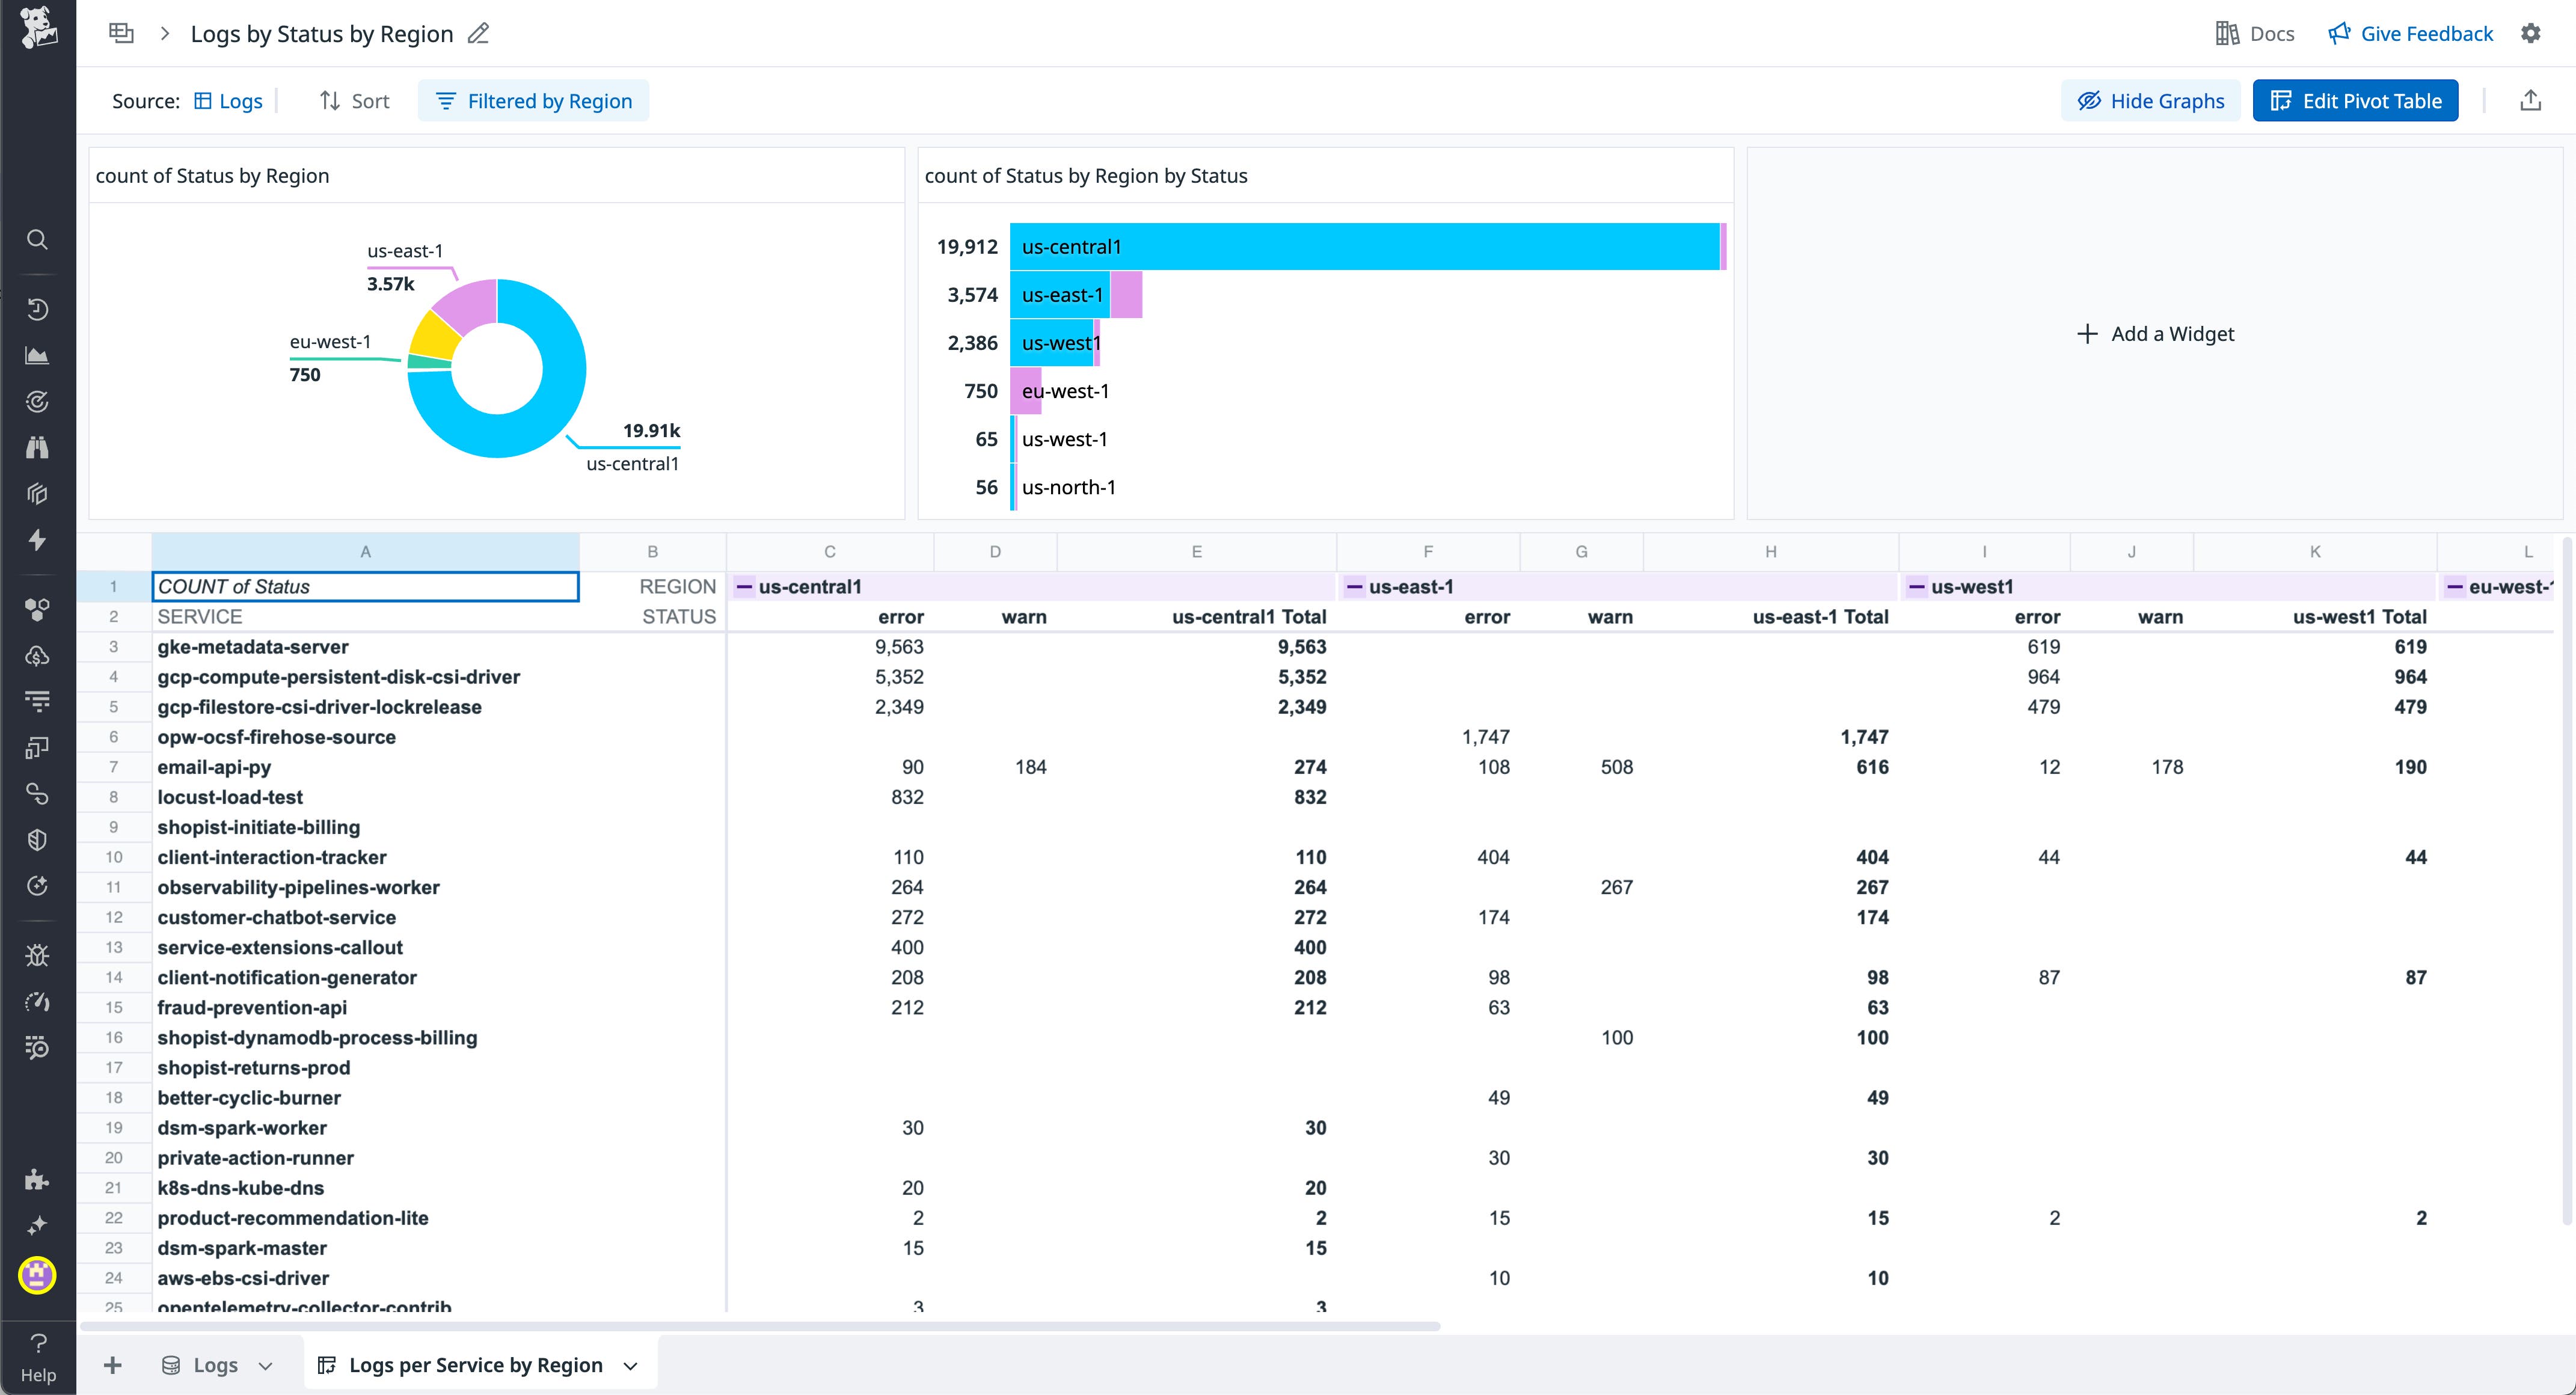
The Lookup feature in Sheets enables you to add context to your datasets. For example, you can match user emails in your Real User Monitoring (RUM) data against a Reference Table to determine which teams those users belong to.
Sheets can help you accelerate investigations by enabling you to extract and transform fields from log messages. You can concatenate values into a single reference string or join two sets of logs to explore relationships between events.
Sheets are especially useful for less technical users, business stakeholders, or anyone who prefers structured data views over freeform queries. And when you’re ready to share your analysis, you can save your spreadsheet to a dashboard or export it to share with your team.
Analyze and join data using SQL with DDSQL Editor
DDSQL Editor gives users the full power of SQL to query Datadog telemetry data. You can write queries to analyze infrastructure data and more, all from a purpose-built IDE that supports cross-source joins and exporting results.
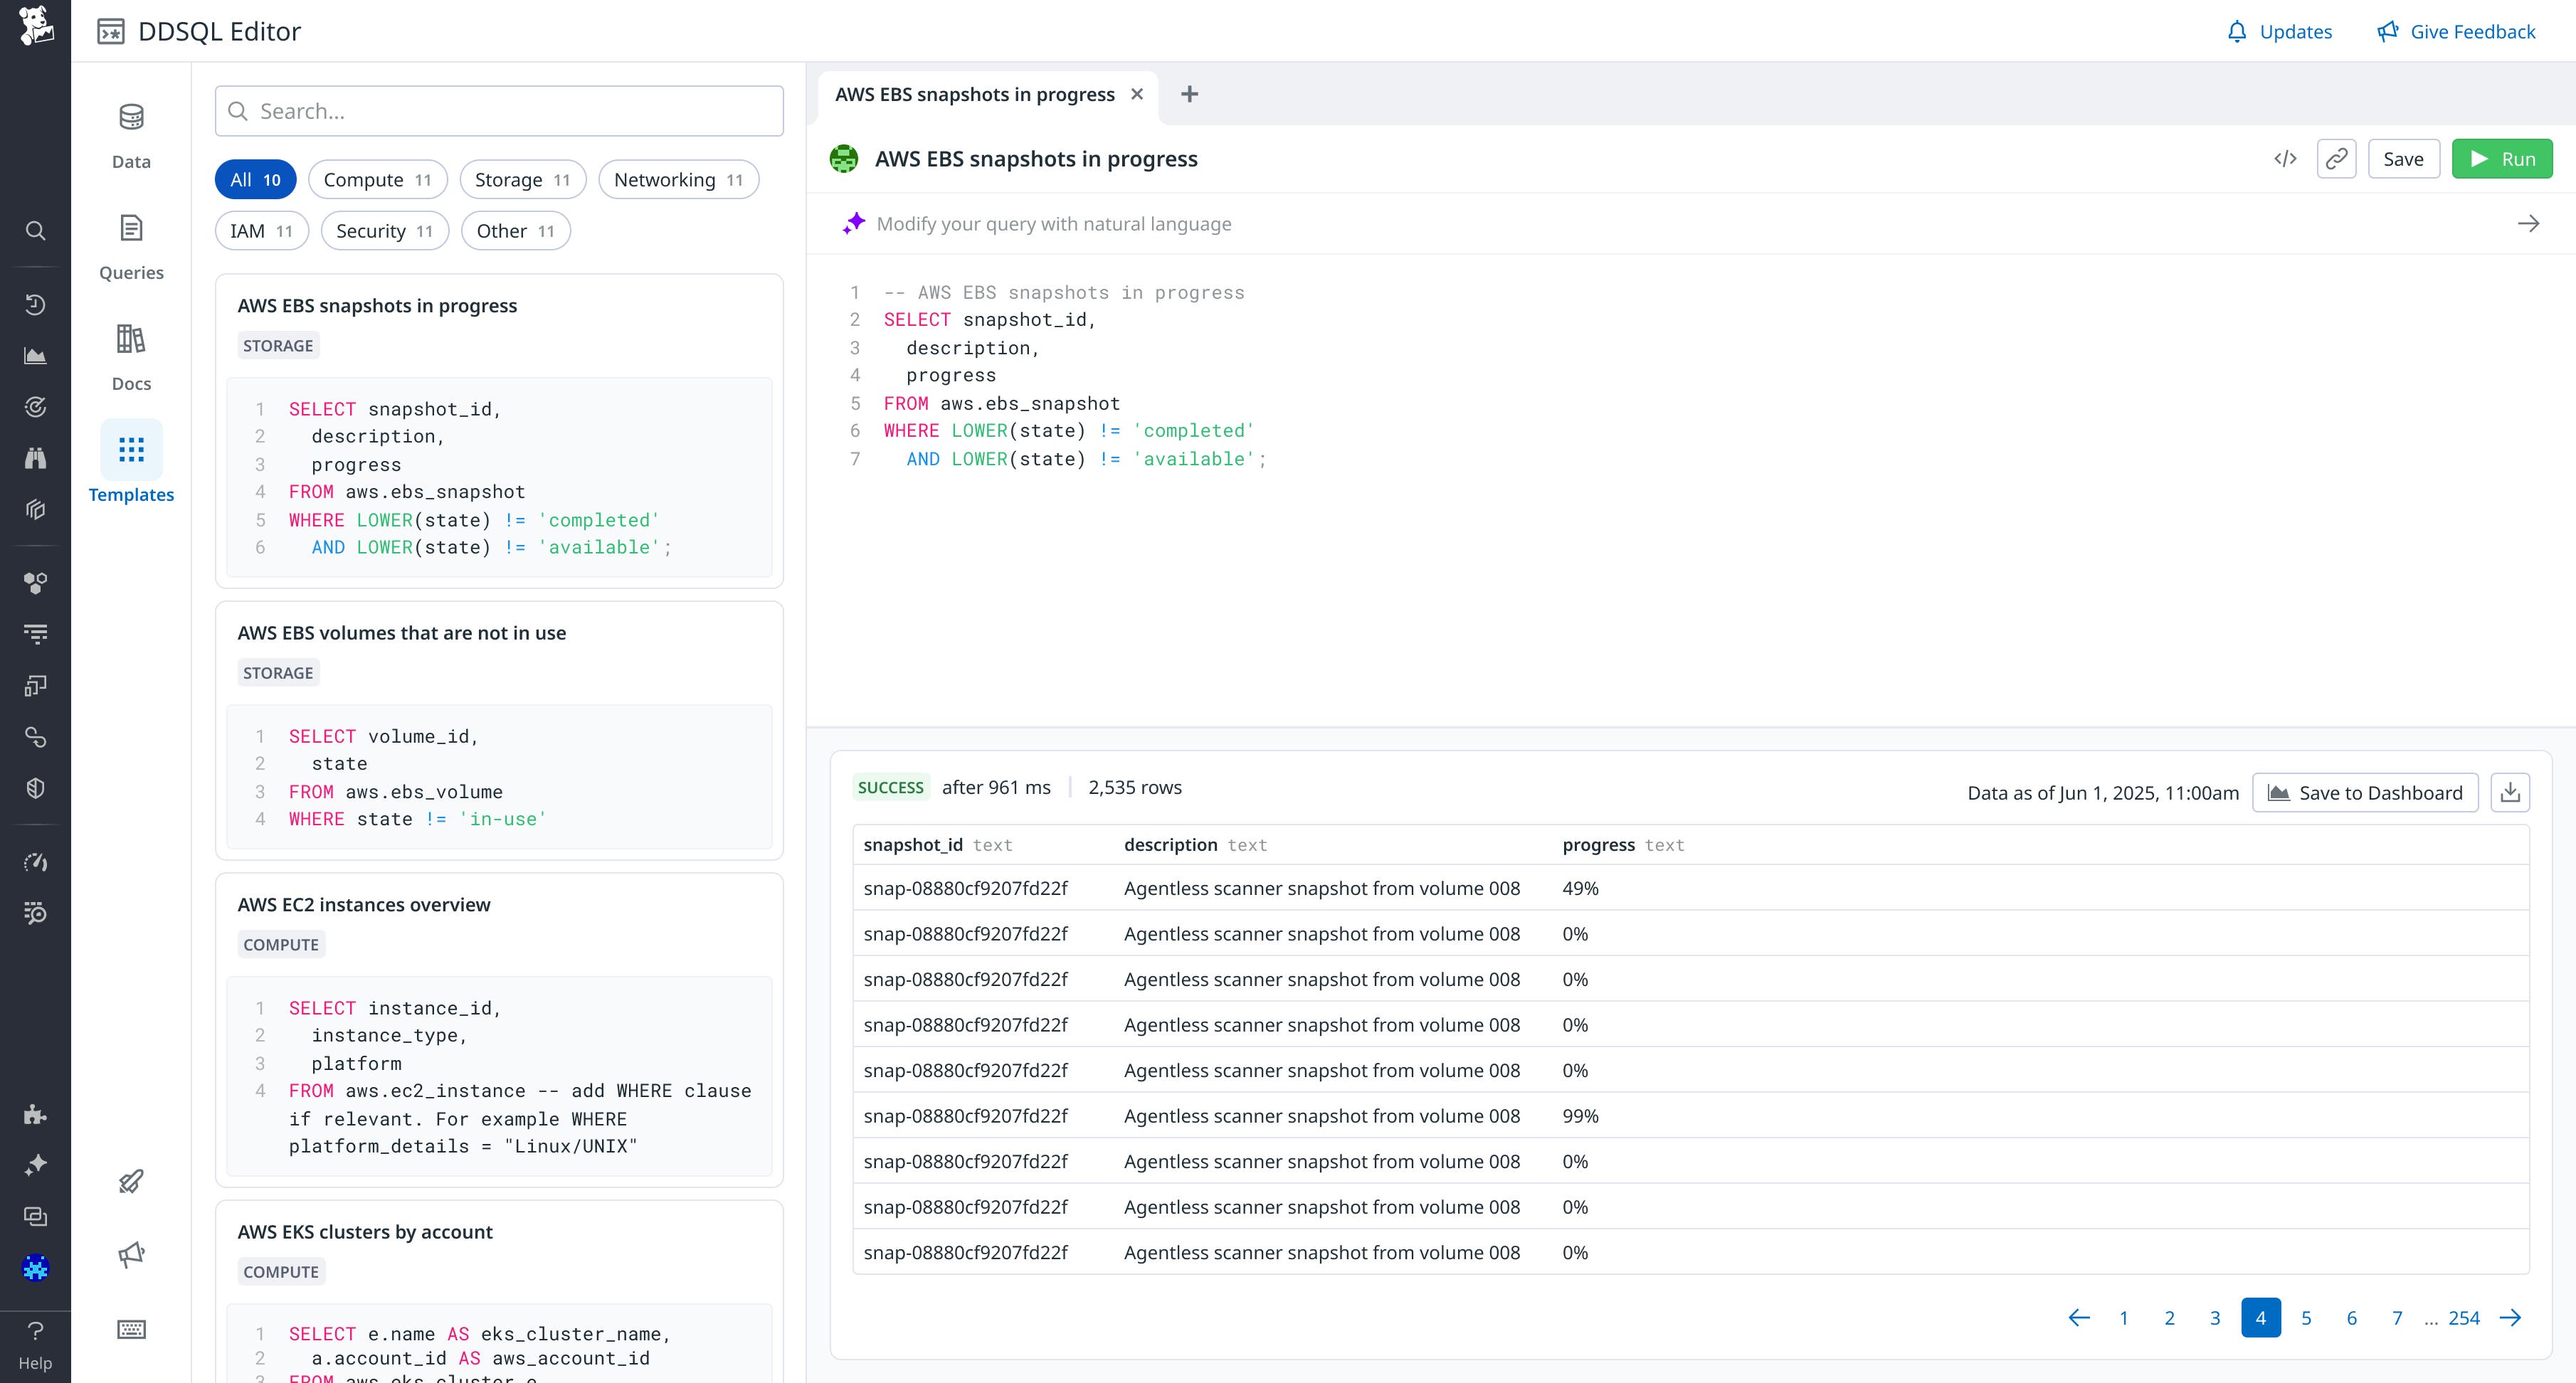
DDSQL Editor is ideal for users who want the precision, flexibility, and control of code. You can run advanced queries like joining Amazon EC2 instance inventory across all accounts with APM-enabled services or counting the number of hosts per agent version and region. You can also instantly query across hundreds of AWS accounts to surface out-of-policy resources and tagging, and then export inventory reports for vulnerability and compliance reviews. Additionally, identify over-provisioned clusters and orphaned Amazon EBS volumes to drive cost savings and resource optimization.
Results can be sent to dashboards, shared as scheduled reports, or embedded in Notebooks for broader visibility. Whether you’re exploring cost anomalies or tracing behavior across sources, DDSQL lets you do it with a single query.
Build multistep analyses with rich context in Notebooks
Datadog Notebooks now supports advanced analysis features that were previously only available in Logs Workspaces. You can now flexibly query, join, and transform telemetry data such as logs, RUM events, spans, and Reference Tables—as well as seamlessly correlate it with other types of data—directly within Notebooks. In addition to existing Notebooks features (such as inline comments, collaboration, and version history), these new capabilities create a collaborative, visual environment for building complex, multistep queries.
You can start with a logs or metrics query and then apply transformations, filters, or aggregations, chaining together steps to refine your results. This workflow is ideal for investigating incidents, correlating changes across datasets, or building internal playbooks. Alongside each query step, you can add rich text between cells to explain your logic, document findings, and guide collaborators through the workflow.
Notebooks are a powerful tool for log transformation and analysis. You can pull logs into a Notebook to apply transformations and extract structured insights from unstructured data by parsing log messages, isolating key fields, and comparing logs across environments. For example, you might aggregate account numbers mentioned in logs or analyze performance metrics across staging and production systems.
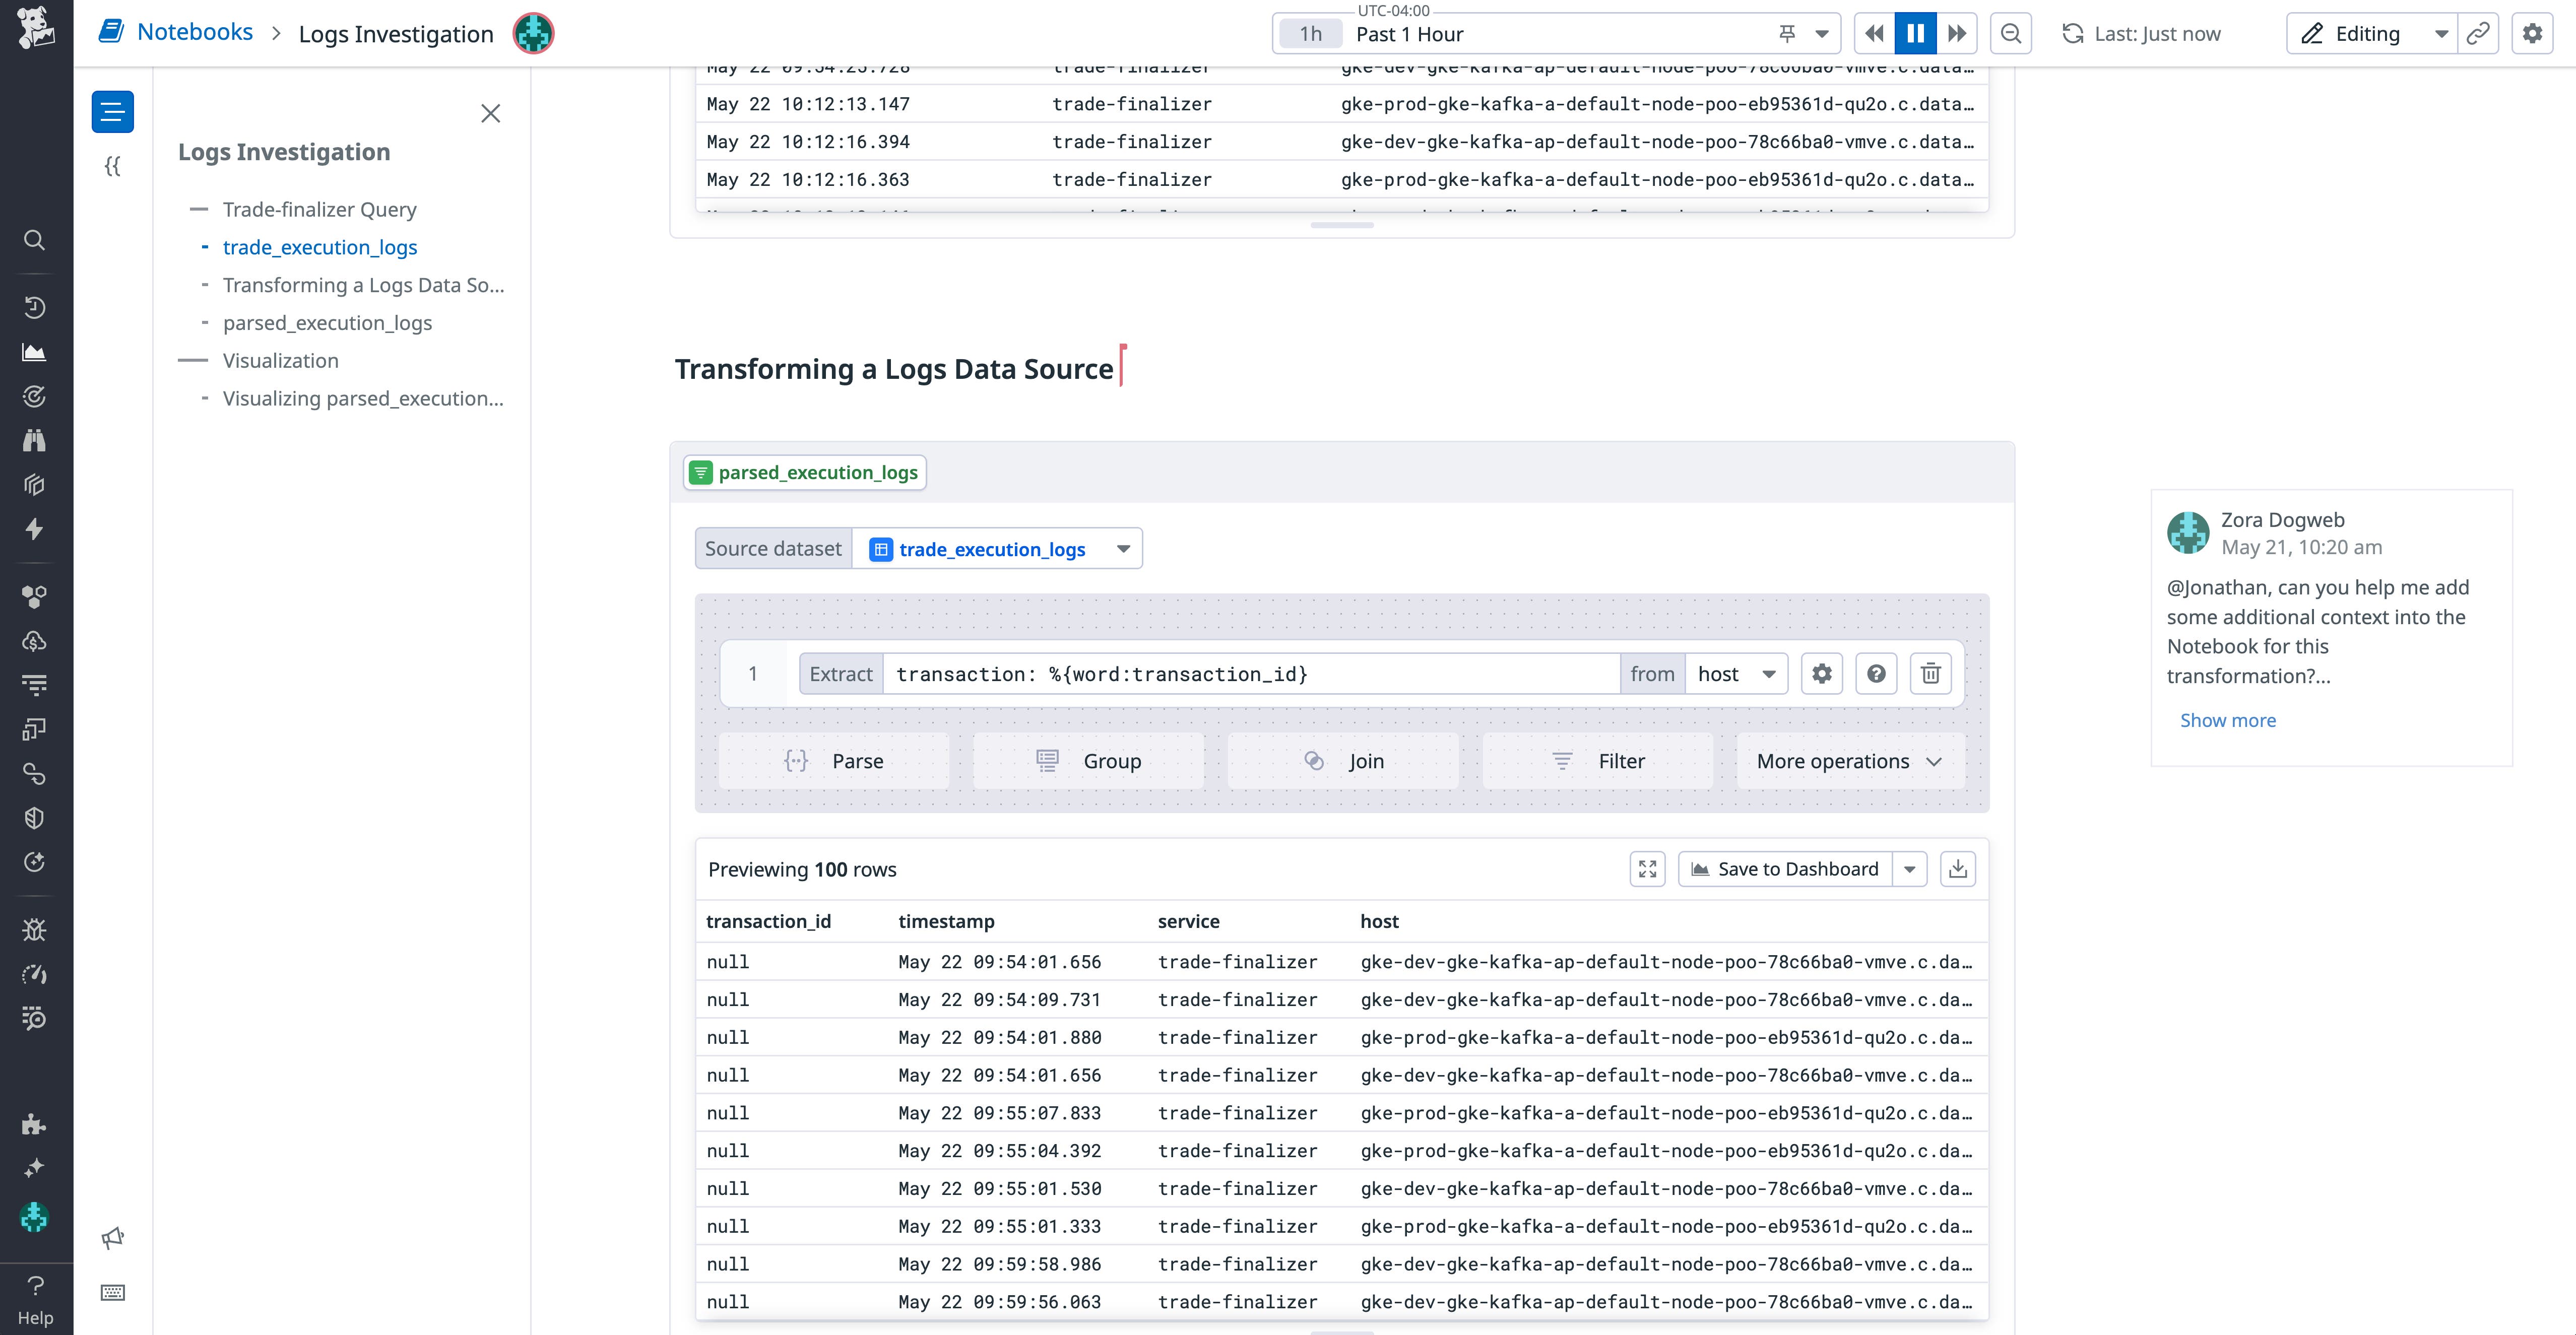
Notebooks are especially useful for digging into complex issues. You can use them to retrace the steps of an incident, explore error patterns, and uncover the root causes of unexpected behavior—all while keeping your analysis and notes in the same view. For example, by analyzing data from logs or RUM, you can identify signs of fraudulent activity, such as the same device ID appearing across multiple user accounts or patterns of excessive resource usage.
In Notebooks, you can document investigation steps and recurring workflows, turning your analysis into a shareable, repeatable artifact that teams can build on or reference to answer business questions. For example, product and operations teams can use them to calculate the cost impact of a system change, measure user login activity, or analyze how clients interact with a new feature. The results of your analysis can also easily be shared in a dashboard.
Choose the advanced querying tool that fits your workflow
Sheets, DDSQL Editor, and Notebooks each offer a different way to explore your telemetry data, depending on your preferred workflow and use case:
- Use Sheets for fast, tabular analysis with spreadsheet logic
- Use the DDSQL Editor to write custom queries and join datasets across sources
- Use Notebooks to chain queries and document investigations step-by-step
Together, these tools provide multiple paths to deeper insights without switching platforms or duplicating data. You can start with whichever approach suits your role or inquiry, and move between them as your analysis evolves.
To learn more, check out the docs for Sheets, DDSQL Editor, and the advanced querying features available in Notebooks. If you don’t already have a Datadog account, you can sign up for a 14-day free trial.
