Aaron Kaplan

Usman Khan

Jason Manson-Hing
Security, operations, and development teams rely more and more on the ability to efficiently query logs. As these teams monitor the health, performance, and usage of their systems and investigate incidents, delving into log data can often be a matter of urgency. But it can also be a cumbersome task: Modern, distributed systems and applications churn out logs from innumerable components, and teams must frequently cross-reference log data from scattered sources in order to translate dispersed datapoints into cohesive visibility. The sheer volume of this data, combined with the inconsistent and frequently unpredictable ways in which it is structured, complicates analysis. Many teams rely on multiple highly specialized tools to comb through mountains of logs and tease out insights. Others adopt proprietary query languages, turning anything beyond the simplest kind of search into a specialist skill.
To address these challenges and help organizations take greater control over their log data, we're pleased to introduce Datadog Log Workspaces. Log Workspaces extends the powerful capabilities of the Datadog Log Explorer, which helps teams swiftly and easily navigate enormous volumes of log data in a point-and-click interface, with a cohesive, highly adaptable environment for in-depth analysis of log data. With Log Workspaces, teams can easily dive deep into their log data by flexibly and collaboratively querying, joining, and transforming it, as well as seamlessly correlating it with other types of telemetry data.
This post will explore how Log Workspaces lets you seamlessly parse and enrich log data from any number of sources, helping anyone in your organization easily analyze that data in clear and declarative terms using SQL, natural language, and Datadog's visualizations.
Seamlessly parse and enrich log data from any number of sources
As software architectures grow in complexity and organizations collect more and more logs, the ability to quickly and flexibly correlate log data from many different sources becomes increasingly important. Historically, conducting this type of analysis has meant engineering elaborate query statements—a time-consuming process that can create confusion as teams work together to get the answers they need from their data.
Log Workspaces helps teams query their logs flexibly and in depth, empowering virtually anyone in your organization to home in on log data from any number of sources, enrich it, and mold it into easily queryable forms for open-ended and declarative analysis. To get started, you can create a Workspace either from scratch or by exporting queries from the Log Explorer. Workspaces are both canvas-like environments and adaptable toolkits for working with your log data on your own terms. They are collaboration-friendly spaces that also permit the configuration of role-based access control (RBAC) for teams working with sensitive data.
Each Workspace is built around one or more data source cells, where you can draw in data using log or RUM queries, reference tables, or metrics. Data source cells automatically extract column-based data schemas from your input data's tags and attributes, enabling you to work nimbly with many kinds of data using lightweight tabular structures.
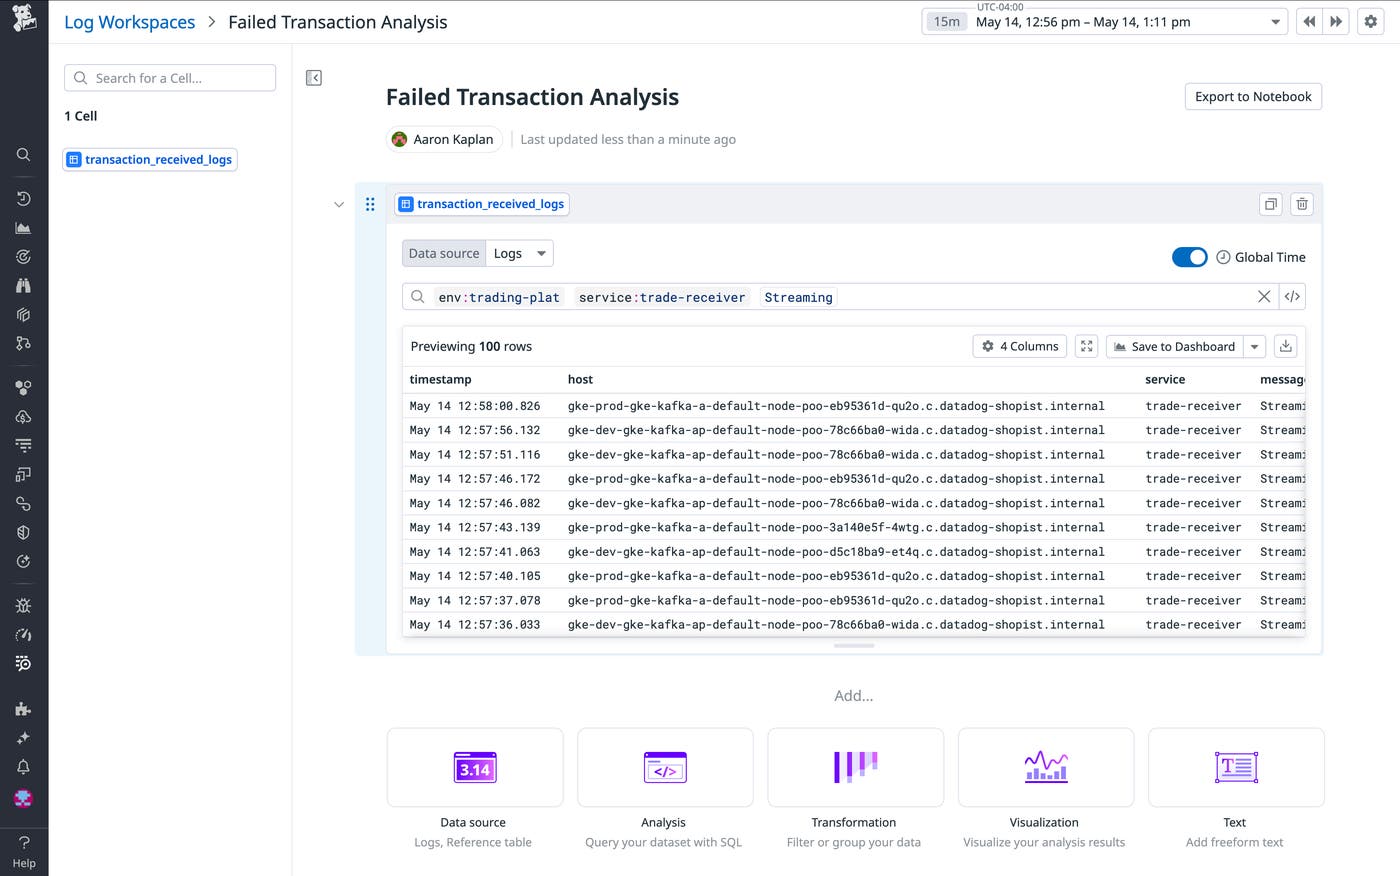
In many cases, you may need to extract information from your logs that isn’t neatly nested under tags or attributes. Log Workspaces makes it easy to add granularity and structure to your log data at query time via transformation cells. You can use transformations to extract values from your log content at query time using custom grok rules, aggregate and filter your datasets based on specific column values, and perform table joins, calculations, and conversions, as well as limit and sort operations.
Let's say you're overseeing transactions for a financial trading platform. You want to take a closer look at failed transactions and understand the business impact, in dollars, of these failures. To do so, you need to compare logs from two separate services: trade-receiver, which is responsible for fielding trade requests, and trade-finalizer, which fulfills them. By querying trade-receiver logs and filtering for the message text, “Streaming trade request,” you're able to isolate a record of all trade requests.
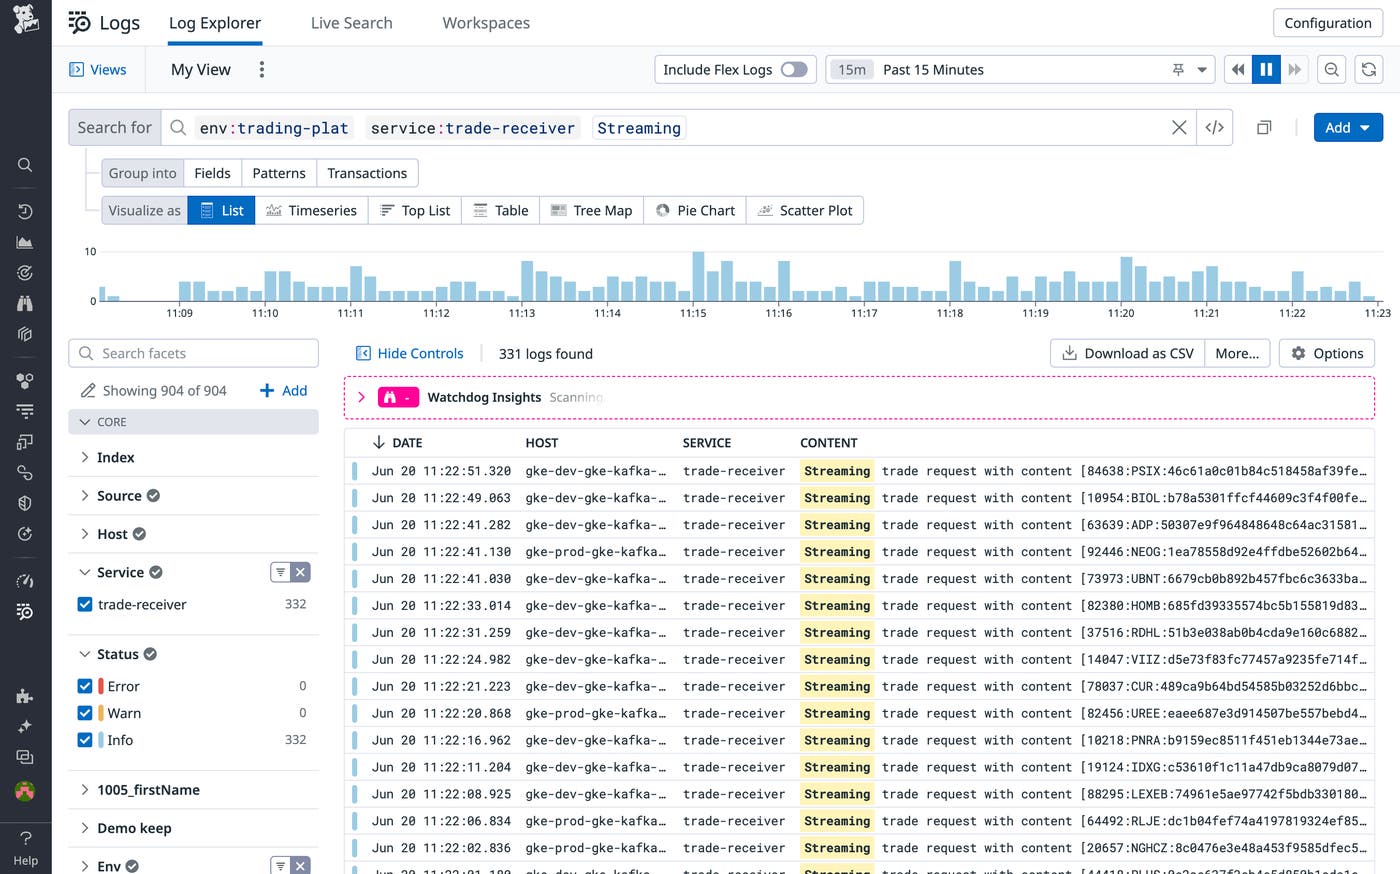
From here, you open your query in Log Workspaces to continue your investigation. You add the logs from trade-finalizer as a second data source to round out your visibility into the trade fulfillment pipeline.
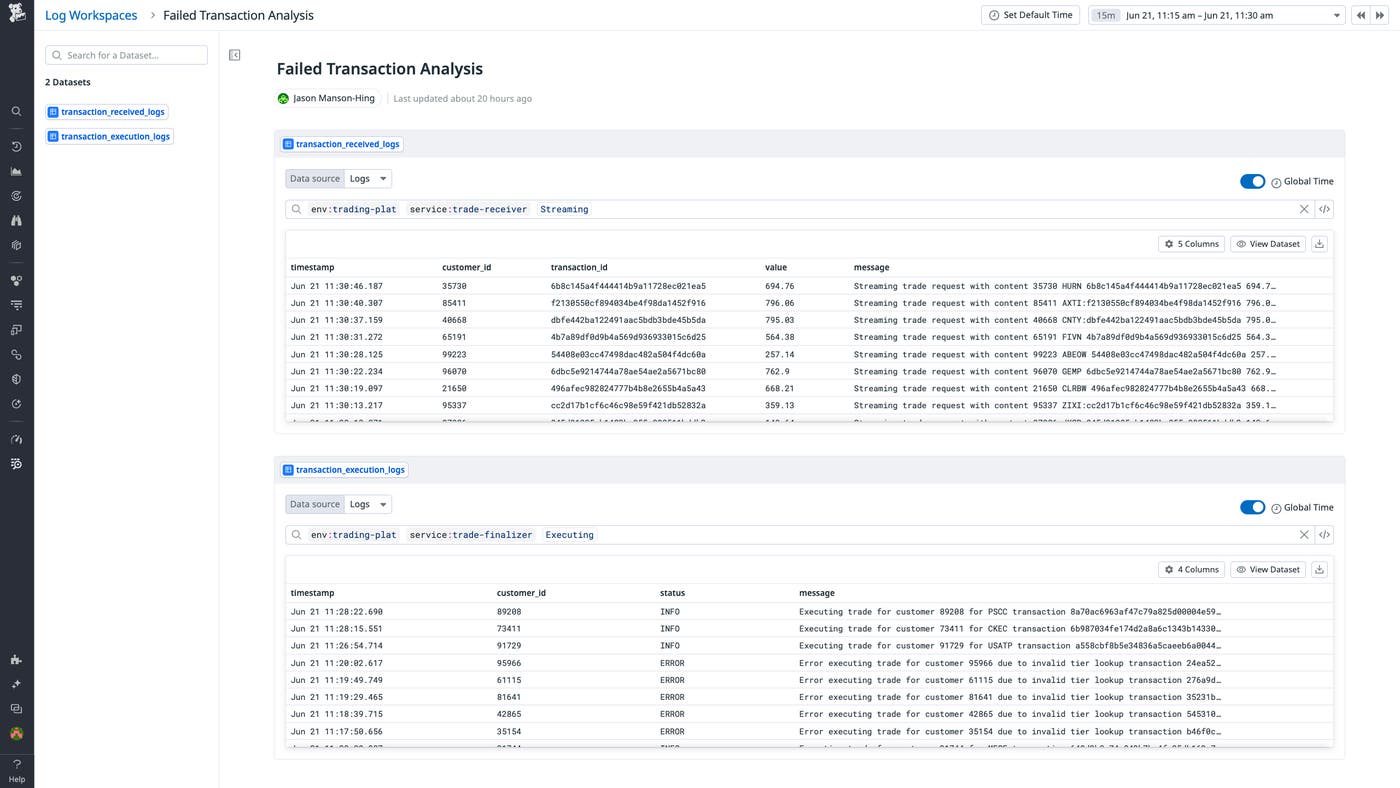
In order to correlate the logs from your two data sources, you'll need the ID of each transaction. As we can see in the above screenshot, however, the trade-receiver logs include a transaction-id column, but the trade-finalizer logs do not. You can select any log from your query results in order to inspect it in greater detail in a side panel. From here, you can select any attribute to add it as a column to your dataset in order to make it easily queryable during subsequent analysis.
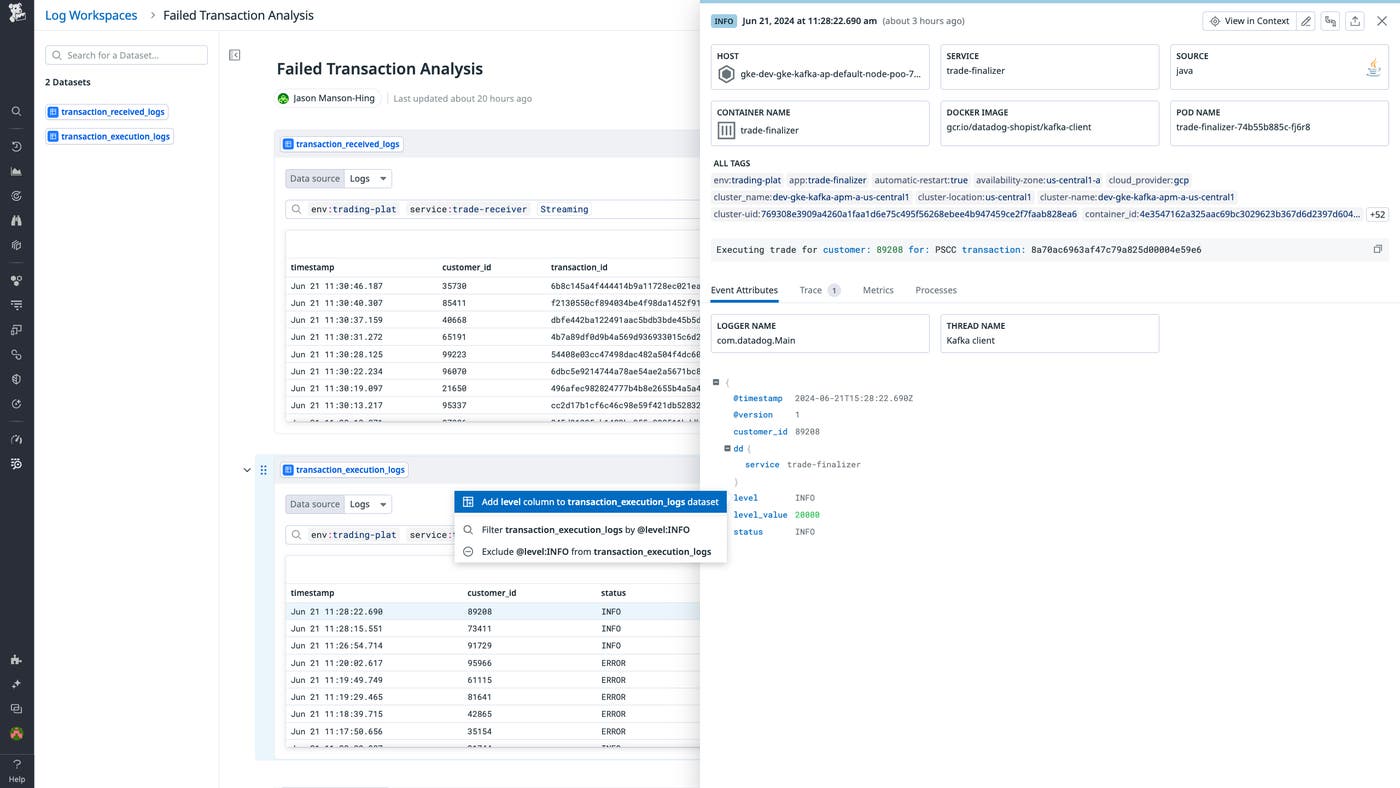
In this case, however, the transaction IDs you need are buried in the unstructured data of the log messages from the trade-finalizer service. In order to isolate them, you create a new transformation cell and add a column extraction. In column extractions, you write custom grok rules that are applied at query time. In this case, your extraction adds a transaction_id column to the resulting dataset.
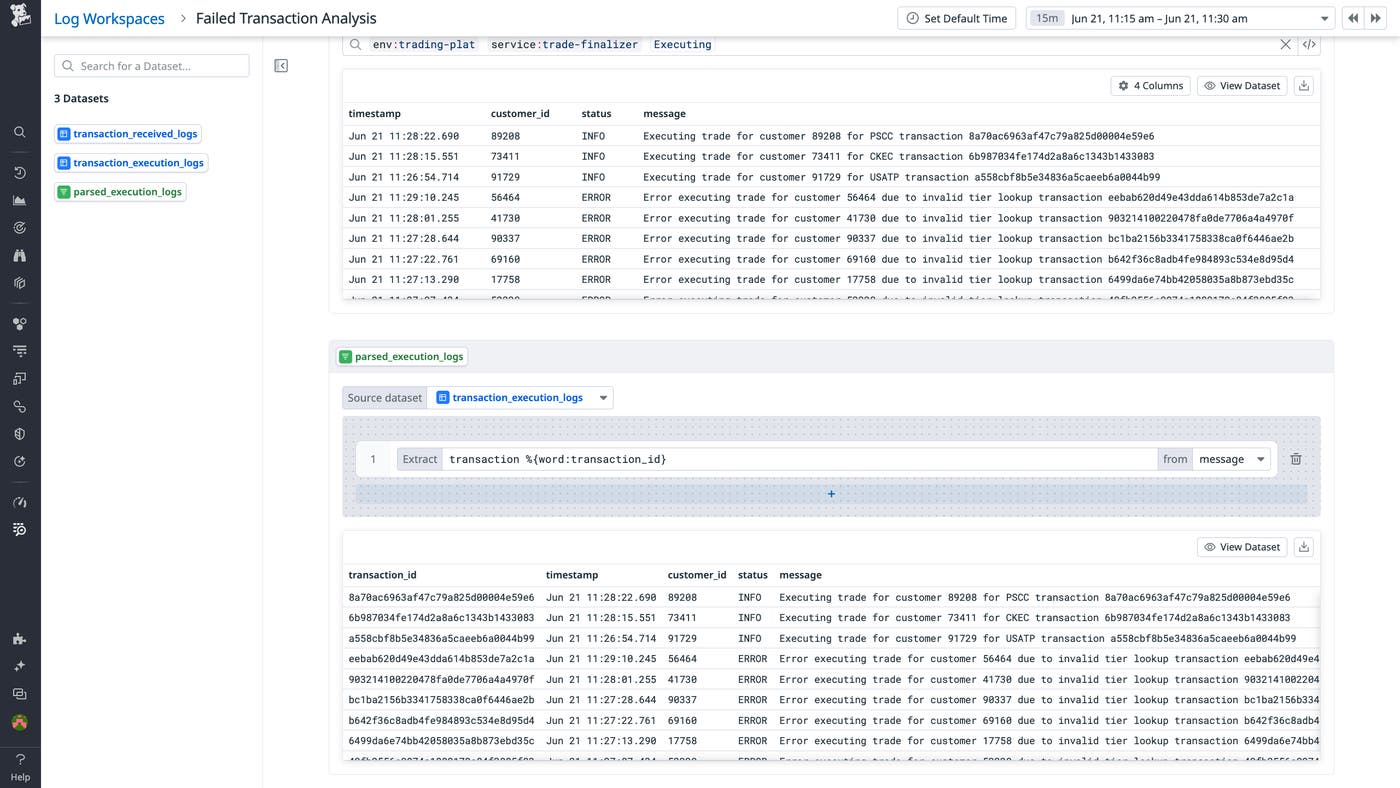
So far, we've seen how Log Workspaces lets you dynamically refine the structure and granularity of your log data at query time, helping you create clear-cut foundations for analysis by defining data sources and dynamically homing in on key data via transformations. With these foundations in place, anyone in your organization—regardless of their level of experience—can use Log Workspaces to seamlessly correlate and delve deeply into log data from many different sources.
Conduct complex analysis of log data expressively and declaratively
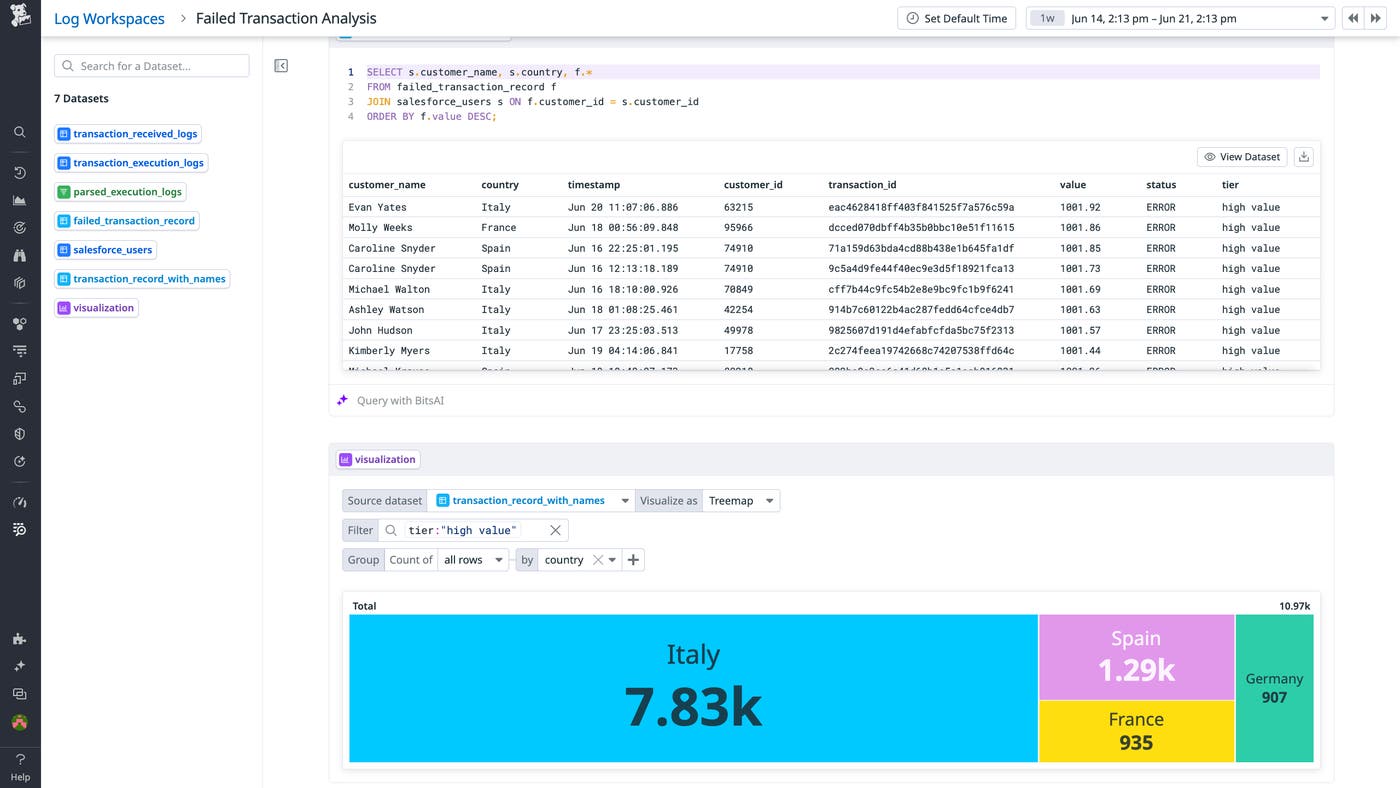
Let's continue with our example from above: You're overseeing transactions for a financial trading platform, and now you want to dig deeper into the failed transactions you've isolated. In order to establish a clearer picture of their business impact, you want to determine where these failures have had the greatest effect on customers. To do so, you need to identify the highest-value failed trades, the customer accounts associated with those trades, and the countries in which those accounts are registered.
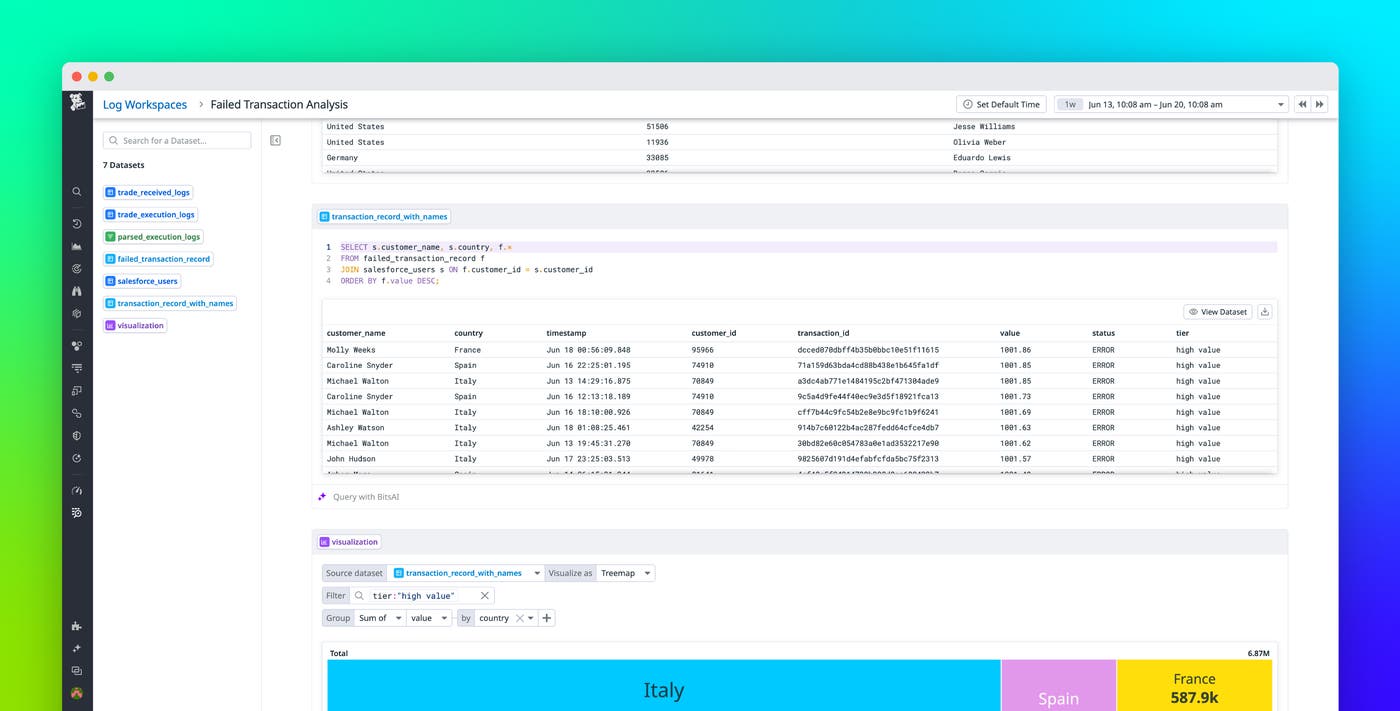
For flexible querying of your data sources, you can add analysis cells to your Workspaces. By allowing you to query your data using either SQL or Bits AI\-powered natural language queries, analysis cells put deep insights into log data within reach for any Datadog user. The following screenshot illustrates how SQL queries enable highly flexible control over your data. With this query, you correlate the data from the datasets you've created by performing a table join and extract the precise information you need in a clear-cut form, creating the failed_transaction_record dataset.
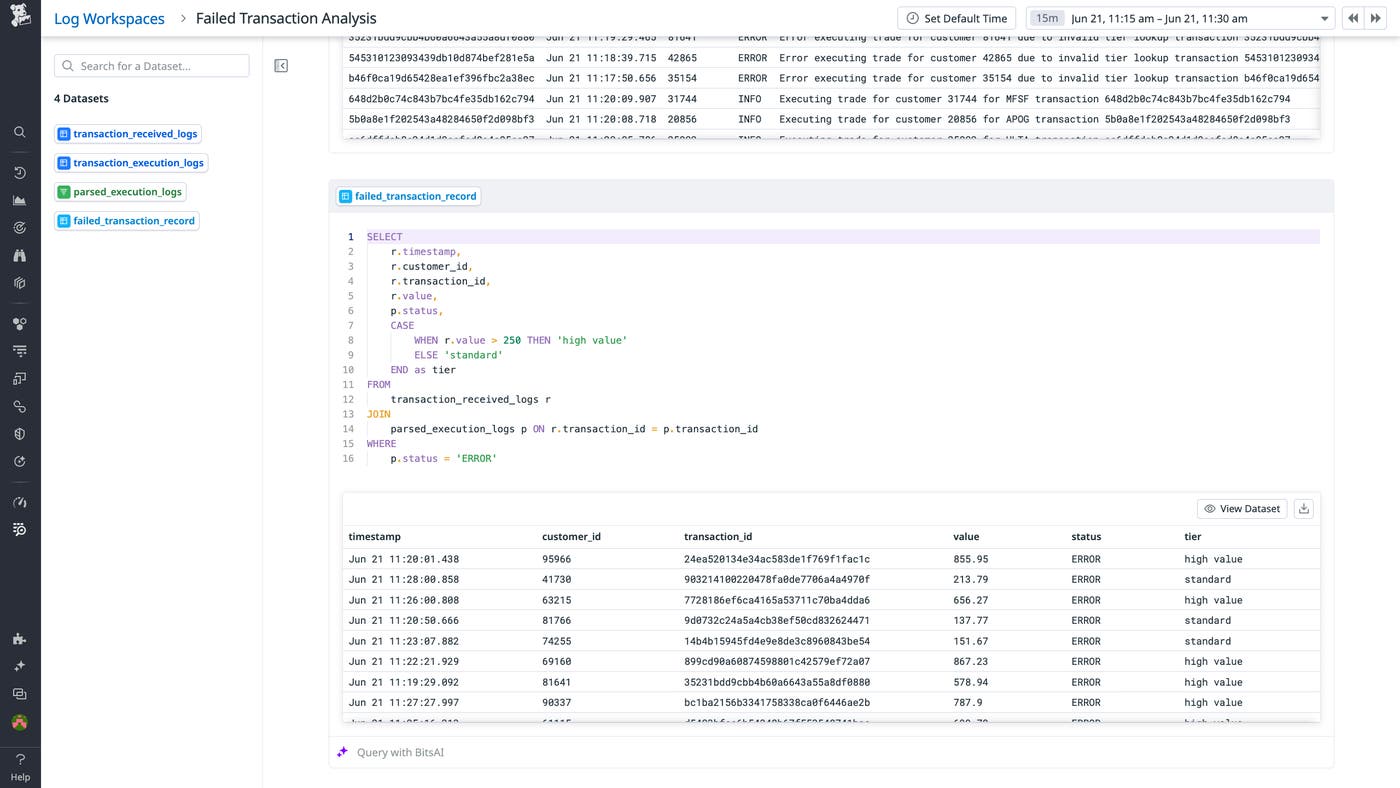
From here, you can build a clearer picture of the business impact of these failures in a few quick steps. To get the names associated with the accounts behind these trades, you add a reference table with all of your customer data as a new data source and perform a join with your failed_transaction_record dataset.
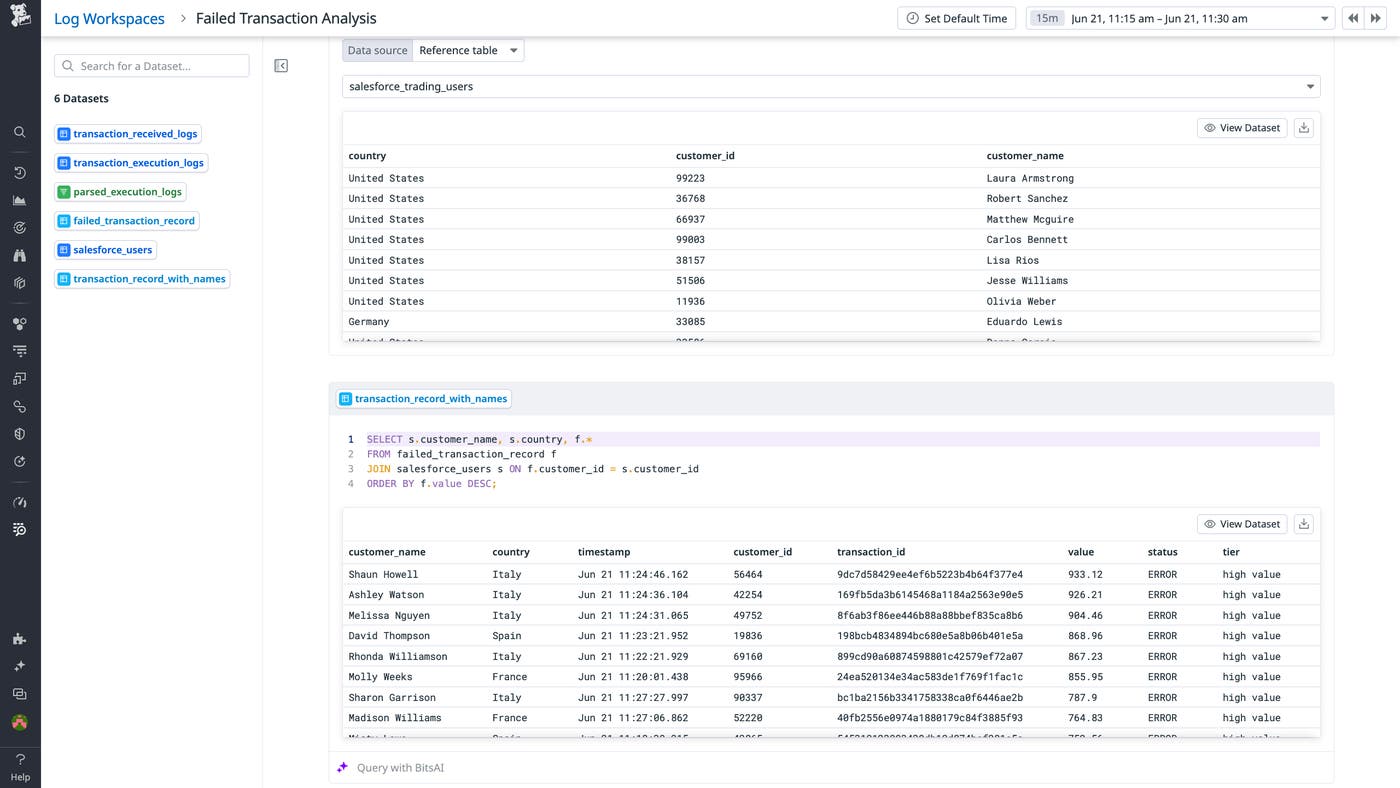
Finally, to paint a clear picture, you can visualize your data. Log Workspaces provides several options for visualization—including tables, toplists, timeseries, treemaps, pie charts, and scatterplots—and allows you to filter your datasets by status, environment, and other variables. And you can save these visualizations to dashboards in order to seamlessly correlate your fine-tuned, log-driven datasets with other types of observability data.
Dive deeper into your logs
Datadog Log Workspaces enables anyone in your organization to work quickly, flexibly, and collaboratively with log data from any number of sources, as well as correlate this data with RUM events and metrics. Log Workspaces can help teams accelerate incident response by making quick work of complex log analysis. It can also help them incorporate fine-tuned log-driven datasets into their day-to-day monitoring (such as by embedding Workspace cells into dashboards). And its collaboration-friendliness and RBAC capabilities make Log Workspaces a powerful tool for engineering, security, operations, FinOps, and other teams in many industries. To learn more, you can check out our detailed use cases for using Log Workspaces to:
Analyze financial operations using payments and transactions data
Analyze e-commerce operations using payment and customer feedback data
Log Workspaces is now generally available as a part of Datadog Log Management. You can learn more Datadog Log Management throughout our blog. By coupling Log Workspaces with Datadog Logging without Limits™ and Flex Logs—which allow you to ingest and index large volumes of logs without multiplying your storage costs—you can collect, store, archive, forward, and query all of your logs without restrictions. If you're new to Datadog, you can get started with a 14-day free trial.
