Jordan Obey
Senior Technical Content Writer
In part 1 of this series, we looked at the common components of an Amazon VPC including CIDR blocks, subnets, firewalls, and route tables. We also looked at approaches for how to configure those components securely.
But securing VPCs and their hosted resources requires more than following configuration best practices. To ensure VPCs are secure, you need visibility into their network activity so you can verify the efficacy of your security policies and detect signs of an attack. You can gain that visibility with flow logs, which are records of network traffic to and from the different resources within a VPC. For example, flow logs can help you view traffic between private and public subnets hosted in your VPC, as well as traffic between EC2 instances within the same subnet.
Flow logs are also one of the only ways you can determine whether data was exfiltrated during a security incident, making them particularly valuable for security and compliance teams. Whereas AWS CloudTrail logs provide insight into any create, replace, update, and delete actions for a resource, flow logs let you track where your data is going throughout your VPC. Additionally, the data contained in flow logs can help you define abnormal behavior in your application so that you can better spot anomalies.
In this post, we'll look at how Datadog's AWS integration and Security Platform enable you to capture, monitor, and analyze VPC Flow Logs so that you can better understand traffic within your virtual network and identify security threats to improve your organization's overall security posture.
Getting started with VPC Flow Logs
VPC Flow Logs is an AWS feature that tracks traffic between the network interfaces of your VPC. This feature plays a key role in ensuring your network resources are secure by enabling you to see what data in your VPC has been accessed and determine whether your firewalls are overly permissive. To enable an IAM user to work with flow logs, you will first need to create an IAM policy that grants them permission to do so.
{ "Version": "2012-10-17", "Statement": [ { "Action": [ "ec2:CreateFlowLogs", "ec2:DeleteFlowLogs", "ec2:DescribeFlowLogs", ], "Effect": "Allow", "Resource": "\*" } ]}After you've created the necessary IAM policy, you can start creating flow logs. To do so, you will need to specify what type of traffic to record (i.e., accepted traffic, rejected traffic, or all traffic) and for what components. Flow logs can be created to capture traffic across an entire VPC or for specific subnets and network interfaces. If you enable flow logs for either a VPC or a subnet, flow logs will be generated for each network interface within them. Be mindful that the more components you decide to create flow logs for, the higher the volume of generated flow logs there will be. This can put pressure on your storage capacity, make it harder to pinpoint relevant logs, and drive up costs. To prevent capturing a larger volume of flow logs than necessary, consider enabling flow logging only for specific subnets or interfaces you're interested in rather than an entire VPC.
After you've decided what components to create flow logs for, you will need to determine where they should be published. AWS provides you with two possible destinations:
Amazon S3, which is useful for long-term archiving and can be used alongside other AWS services like Amazon Athena to run big data analysis on your logs.
Amazon CloudWatch Logs, which lets you create metric filters and alerts on your flow logs.
Collect and monitor VPC Flow Logs with Datadog
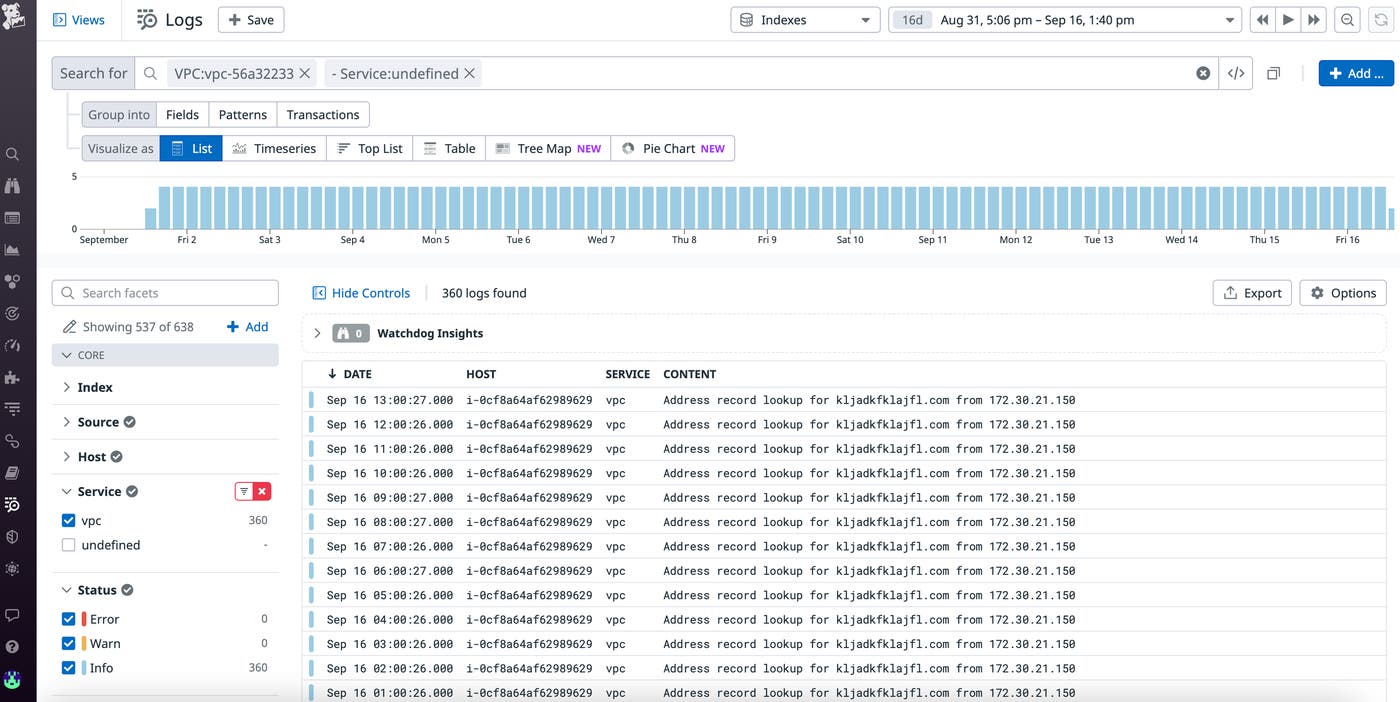
Datadog's Amazon VPC integration enables you to collect flow logs from both S3 and CloudWatch, so you can monitor and analyze all of your VPC flow logs with Datadog regardless of where they were first ingested. Simply set up the Datadog Forwarder Lambda function and use the AWS console to add either—or both—a CloudWatch log group or an S3 bucket that contains your flow logs as a trigger. Then you can use the Datadog Log Explorer to view, filter, analyze, and investigate all of your VPC flow logs.
If you don’t want to ingest flow logs, you can still collect the most pertinent information from them by using Datadog Observability Pipelines. Observability Pipelines will extract metrics from your flow logs before they leave your environment, enabling you to ship logs to your preferred destination, drop them, or retain them in a cost-effective, long-term storage solution, like Flex Logs.

Anatomy of a flow log
Flow logs contain a wide range of valuable traffic data that you can use to troubleshoot your virtual network. By default, flow logs contain the following fields:
| Field | Example value |
|---|---|
| version | 2 |
| Account ID: AWS account ID of creator of the network interface associated with the flow log | 123456789010 |
| Interface ID: ID of specific network interface | eni-1235b8ca123456789 |
| Source address: source IP address of traffic | 172.31.9.69 |
| Destination address: destination IP address of traffic | 172.31.9.12 |
| Source port | 36490 |
| Destination port | 443 |
| Protocol: network protocol number | 6 |
| Packets | 77 |
| Bytes | 5040 |
| Start: time (in unix seconds) of the beginning of the flow log capture window | 1663349860 |
| End: time (in unix seconds) of the end of the flow log capture window | 1663360660 |
| Action | ACCEPT |
| Log Status | OK |
Once flow logs start coming into Datadog, you can use the data contained in these fields, such as the IP address and status of incoming traffic, to identify the source of potential security threats, which we’ll cover in the next section.
You can also view flow log data in the Log Explorer to confirm that your VPC security configuration is behaving as expected. For example, let's say you've set up an ACL rule that allows inbound traffic from public clients but prevents outbound traffic. You can validate that rule by pinging your VPC and then looking for a log entry similar to the following one in the Log Explorer view:
| version | account | interface | source | destination | protocol | packets | bytes | start | end | action | log status |
|---|---|---|---|---|---|---|---|---|---|---|---|
| 2 | 0987654321 | eni-00b94foo11c152e48 | 172.31.XX.XXX | 172.31.XX.XXX | 6 | 40 | 1222234 | 1663349841 | 1663349871 | ACCEPT |
Securing your VPC with flow logs and Datadog's Security Platform
Through either its out-of-the-box security threat detection rules or your own custom rules that you define, Datadog enables you to quickly analyze incoming VPC flow logs for signs of a security breach. Threat detection rules can help uncover patterns you might otherwise miss if you're capturing a large volume of flow logs and alert you to attacks that are underway. Together, flow logs and Datadog's Security Platform help safeguard your security groups and ACLs. We’ll cover two common threats: brute force SSH and denial of service attacks.
Detecting brute force SSH attacks
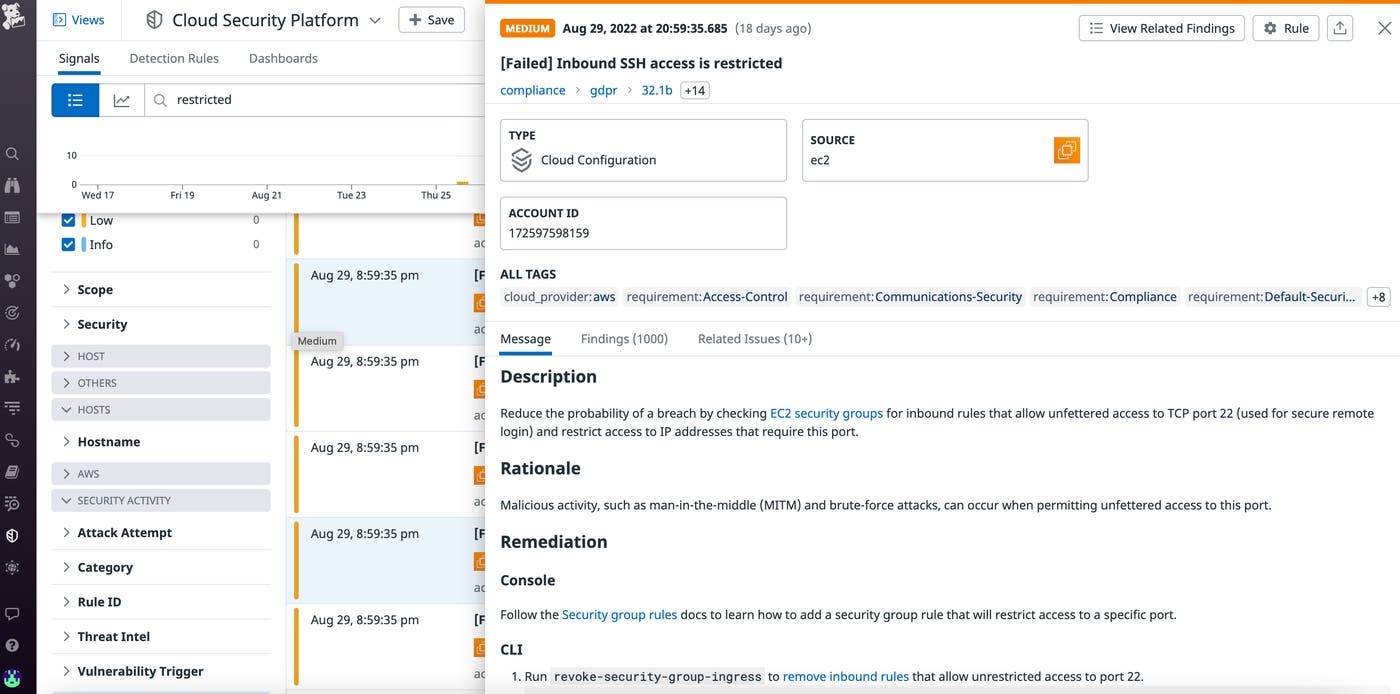
A brute force SSH attack is a technique attackers use to access resources in a VPC by attempting several SSH logins until they have guessed the right credentials. These attacks are more likely to be successful when security groups have overly permissive rules. One way to identify overly permissive security groups is with Datadog Cloud Security's unrestricted SSH access detection rule. This rule determines whether security groups allow inbound traffic from port 22, which is the default port for the SSH protocol. Leaving port 22 widely accessible widens the attack surface of your environment because bad actors can use it to gain remote access to your VPC.

You can also spot signs of brute force attacks by using VPC flow log metrics, which enable you to visualize captured flow log data in easy-to-read timeseries graphs. For instance, you can keep track of what traffic was permitted by an ACL or security group by visualizing the number of REJECT and ACCEPT actions recorded by flow logs. Then, you can set an alert on a sudden REJECT spike which could point to an attempted brute force attack.

To prevent brute force attacks, tighten your inbound rules so that access is permitted only through necessary ports. For example, if you're hosting a website, you likely just need to permit TCP traffic over port 80 (HTTP) and 443 (HTTPS). In that case, a strict inbound rule that completely prevents SSH access would look like the following:
| Source | Protocol | Port Range |
|---|---|---|
| 0.0.0.0/0 | TCP | 80 |
| 0.0.0.0/0 | TCP | 443 |
Detecting denial of service attacks
A denial of service (DoS) attack is when your network is flooded with requests from a small number of sources in an attempt to make it crash. One sign of a DoS attack in a VPC is an unusually high spike in bytes and packets transferred to a single subnet in a small window of time. If you've set an alert to notify you of such a spike and that alert is triggered, you can investigate the associated VPC flow logs to identify the IP addresses that the suspicious traffic originated from. After you've identified those IP addresses, you can add a rule to your ACL denying all further traffic originating from them.
In some cases, when a VPC is breached, its components (e.g., an EC2 instance) can be used to perform DoS attacks. Datadog has a default rule that can detect if a compromised EC2 instance in your VPC is participating in a DoS attack. If that is the case, follow AWS's recommended steps to remediating compromised instances.
Monitor VPC flow logs alongside the rest of your infrastructure
In this post, we discussed how flow logs provide valuable insight into network traffic so that you can ensure your VPC's security. We also looked at how Datadog visualizes and analyzes flow log data to automatically detect VPC security threats like brute force SSH and DoS attacks. In addition to Amazon VPC, Datadog integrates with more than 1,000 technologies, including other AWS services such as S3, API Gateway, and DynamoDB, enabling you to get end-to-end visibility into your entire AWS-hosted infrastructure. And if you're running several VPCs, you can use Datadog's integration with AWS Transit Gateway—a service that helps connect multiple VPCs, AWS accounts, and on-prem networks through a centralized hub—to troubleshoot network issues and facilitate network capacity planning across all of your VPCs. You can learn more about our AWS integrations in our documentation.
If you aren’t already a Datadog customer, get started with a 14-day free trial.

