David Pointeau

Angelina Jin

Abhinav Modugula

Kyler Kang
As organizations grow their cloud environments and branch office networks, maintaining reliable connectivity and application performance becomes more complex. VeloCloud SD-WAN provides dynamic, policy-based routing to help ensure that your connectivity is dependable and cost-efficient, and that your applications perform consistently.
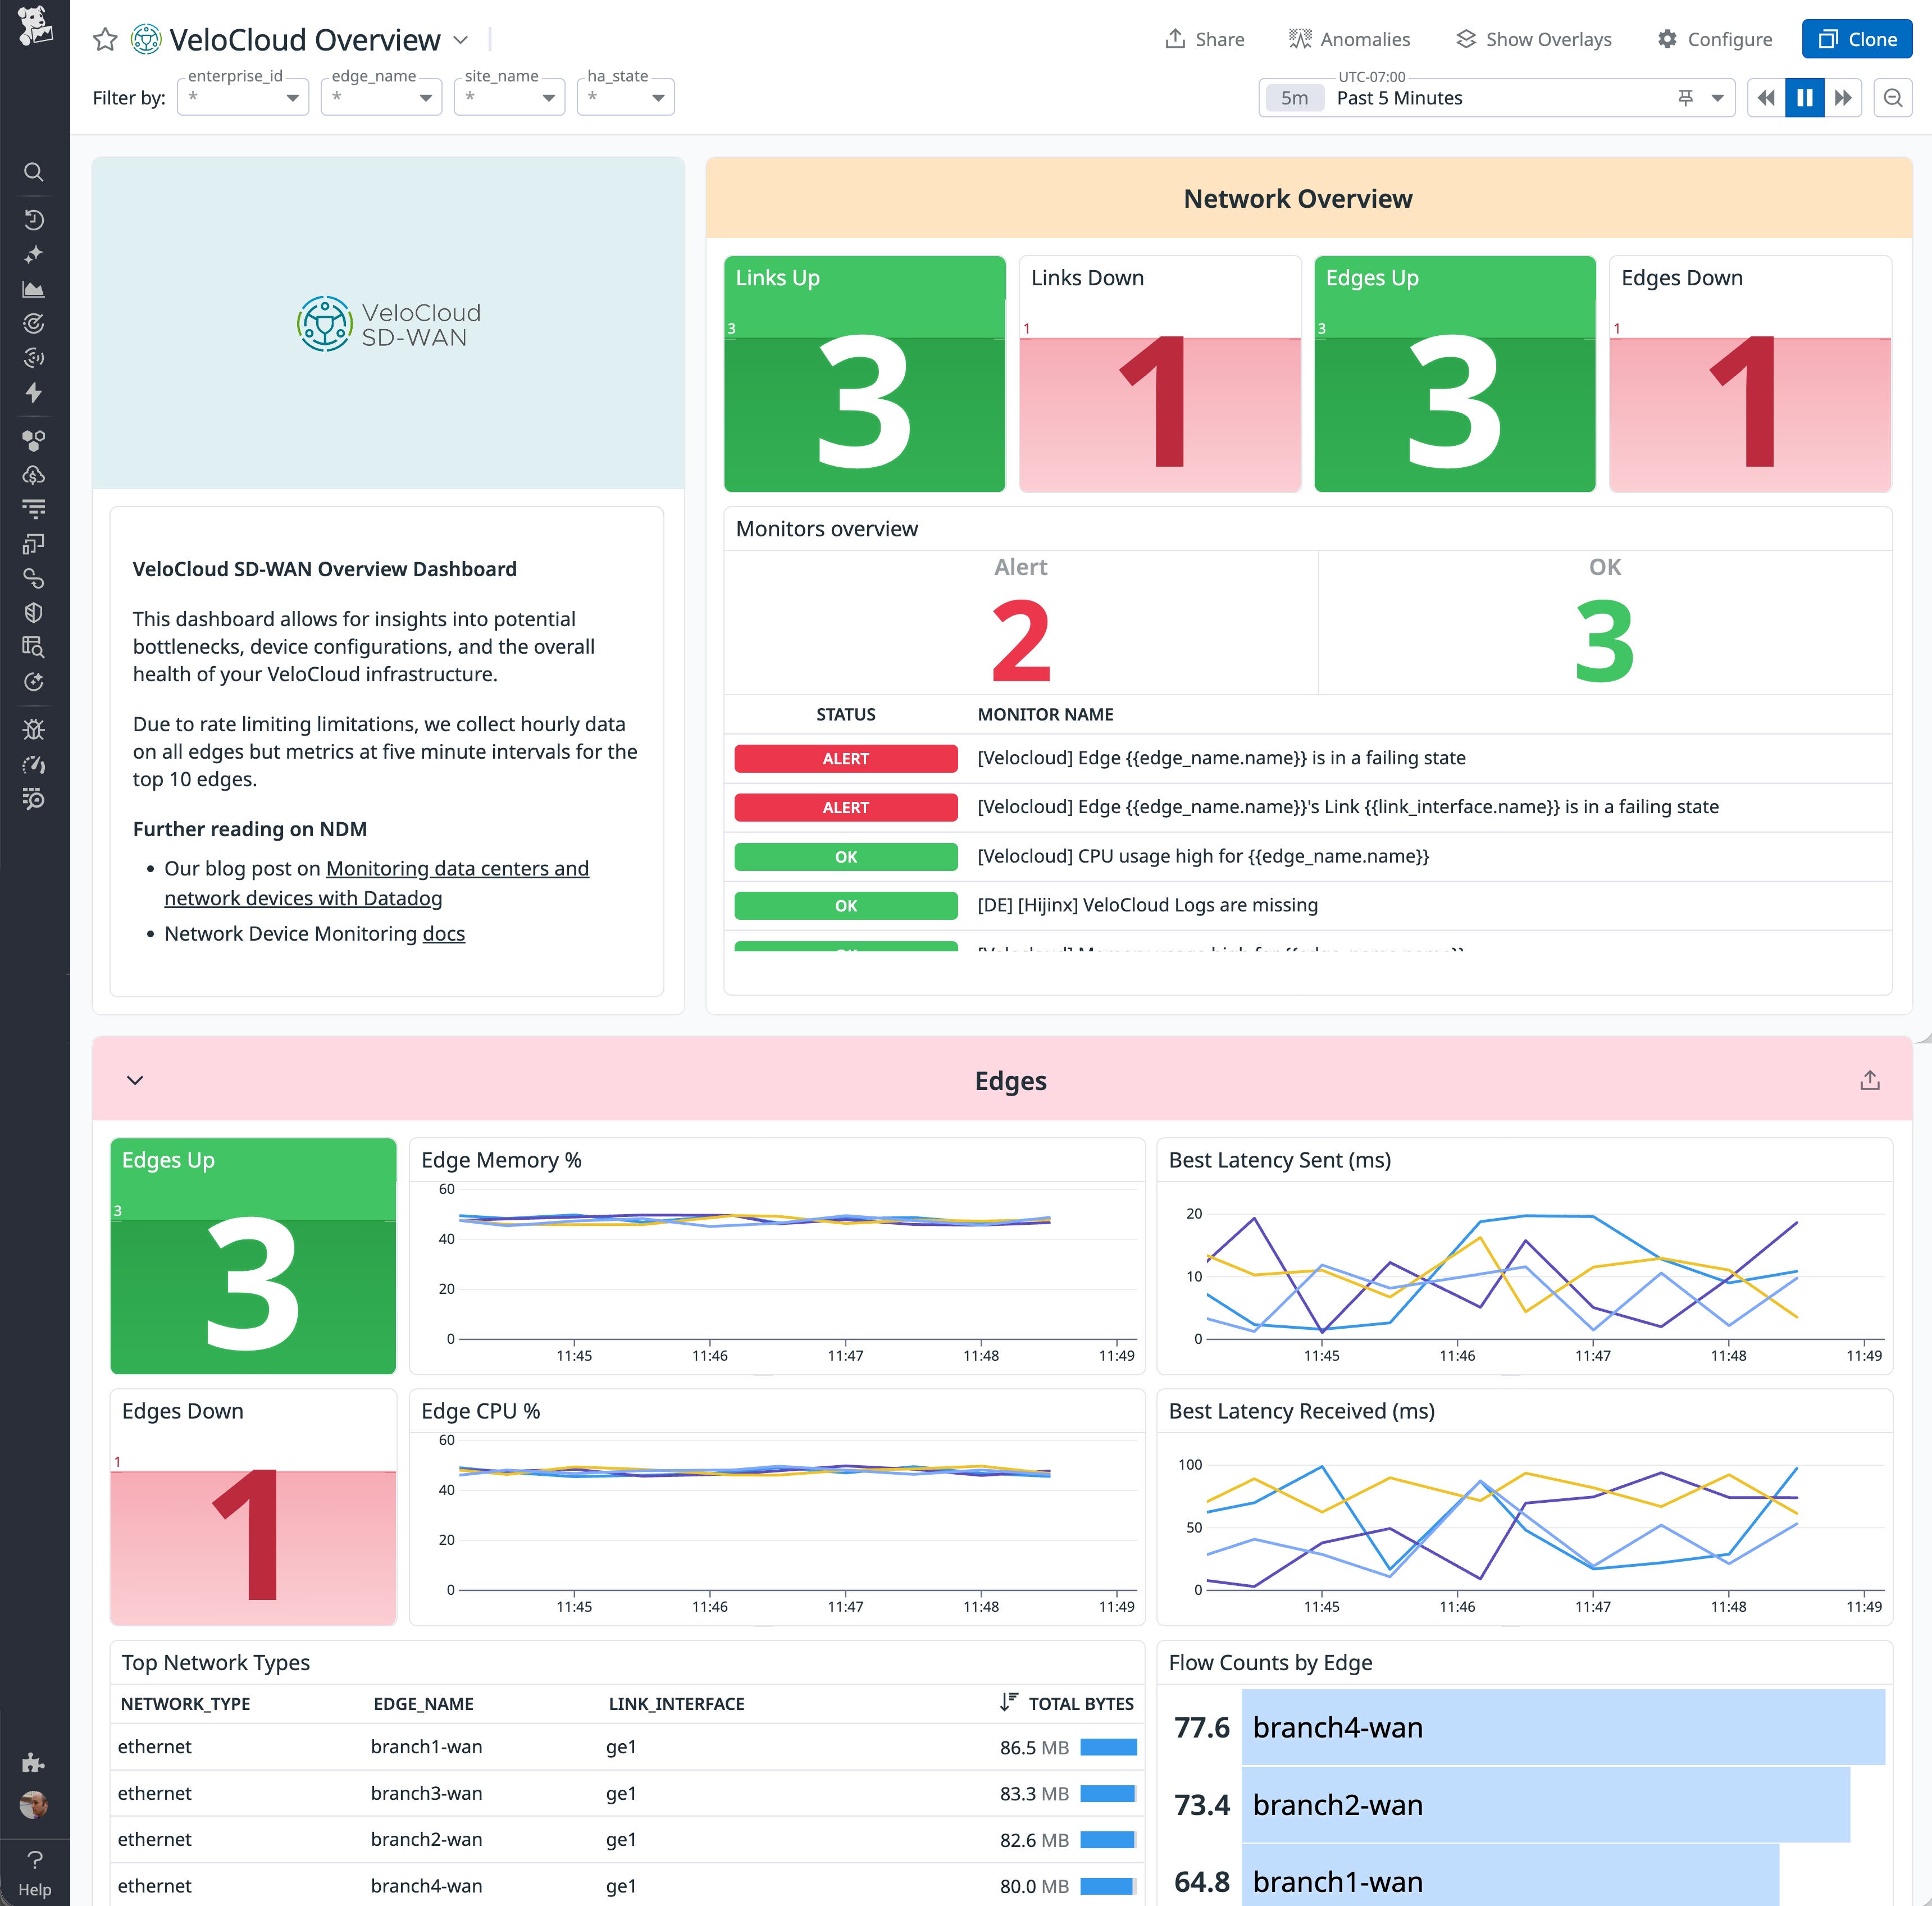
Datadog’s new VeloCloud SD-WAN integration provides unified visibility into the networks that connect your branches, data centers, and cloud services, including real-time link performance and edge device resource usage. This integration collects metrics and logs directly from the VeloCloud Orchestrator, displaying this crucial WAN data within Datadog alongside your existing performance, reliability, and security monitoring. This consolidated view allows you to proactively manage WAN health, detect network issues faster, and gain insights that can help you operate your WAN reliably. And you can use Datadog Network Device Monitoring (NDM) to gain a device-oriented view that makes it easy to explore and investigate the performance of every layer of your network hardware.
In this post, we’ll look at how Datadog enables you to:
- Visualize link performance and edge device resource usage
- Detect and troubleshoot connectivity issues with alerts and anomaly detection
- Monitor VeloCloud with Datadog NDM

Visualize link performance and edge device resource usage
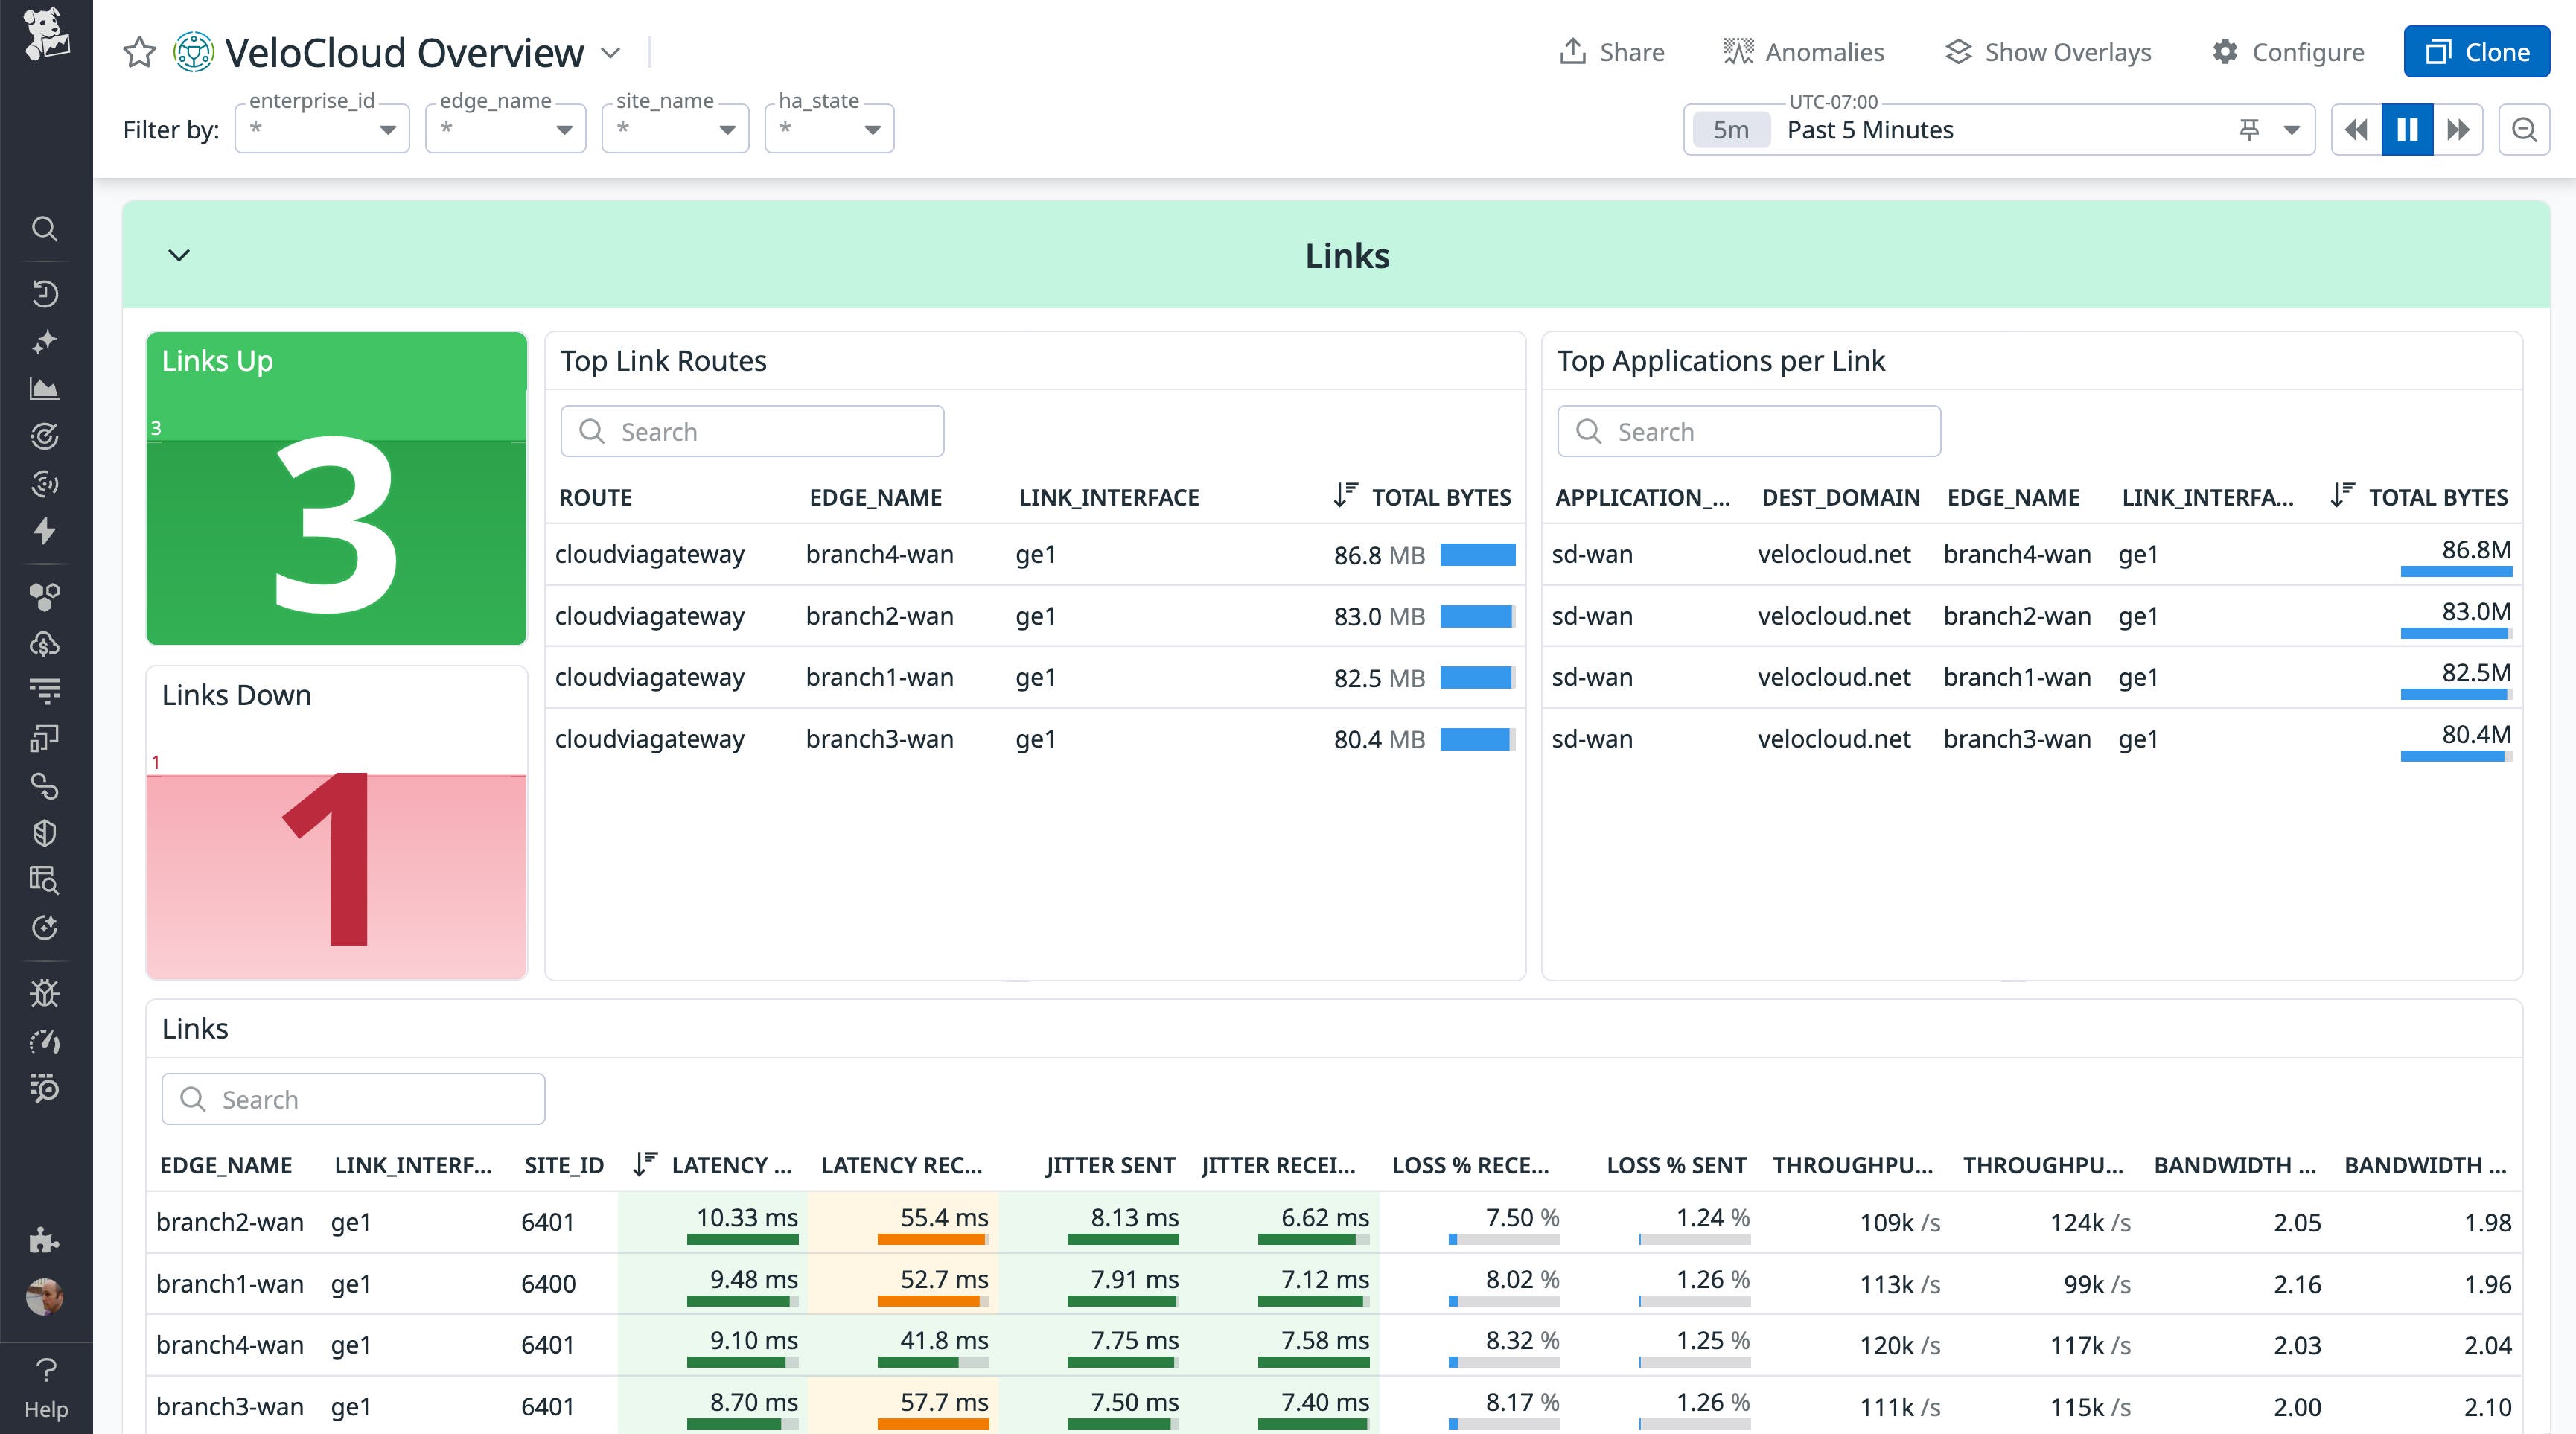
SD-WAN dynamically routes traffic across multiple paths based on network conditions, and visibility into each link’s performance is essential for diagnosing slow or unreliable connections. Datadog provides this insight by collecting key metrics directly from the VeloCloud Orchestrator. The out-of-the-box (OOTB) dashboard helps you track performance across all sites in your SD-WAN environment, helping you correlate application health with key metrics, including:
- Link availability and status
- Latency, jitter, and packet loss per transport type
- Bandwidth usage and throughput

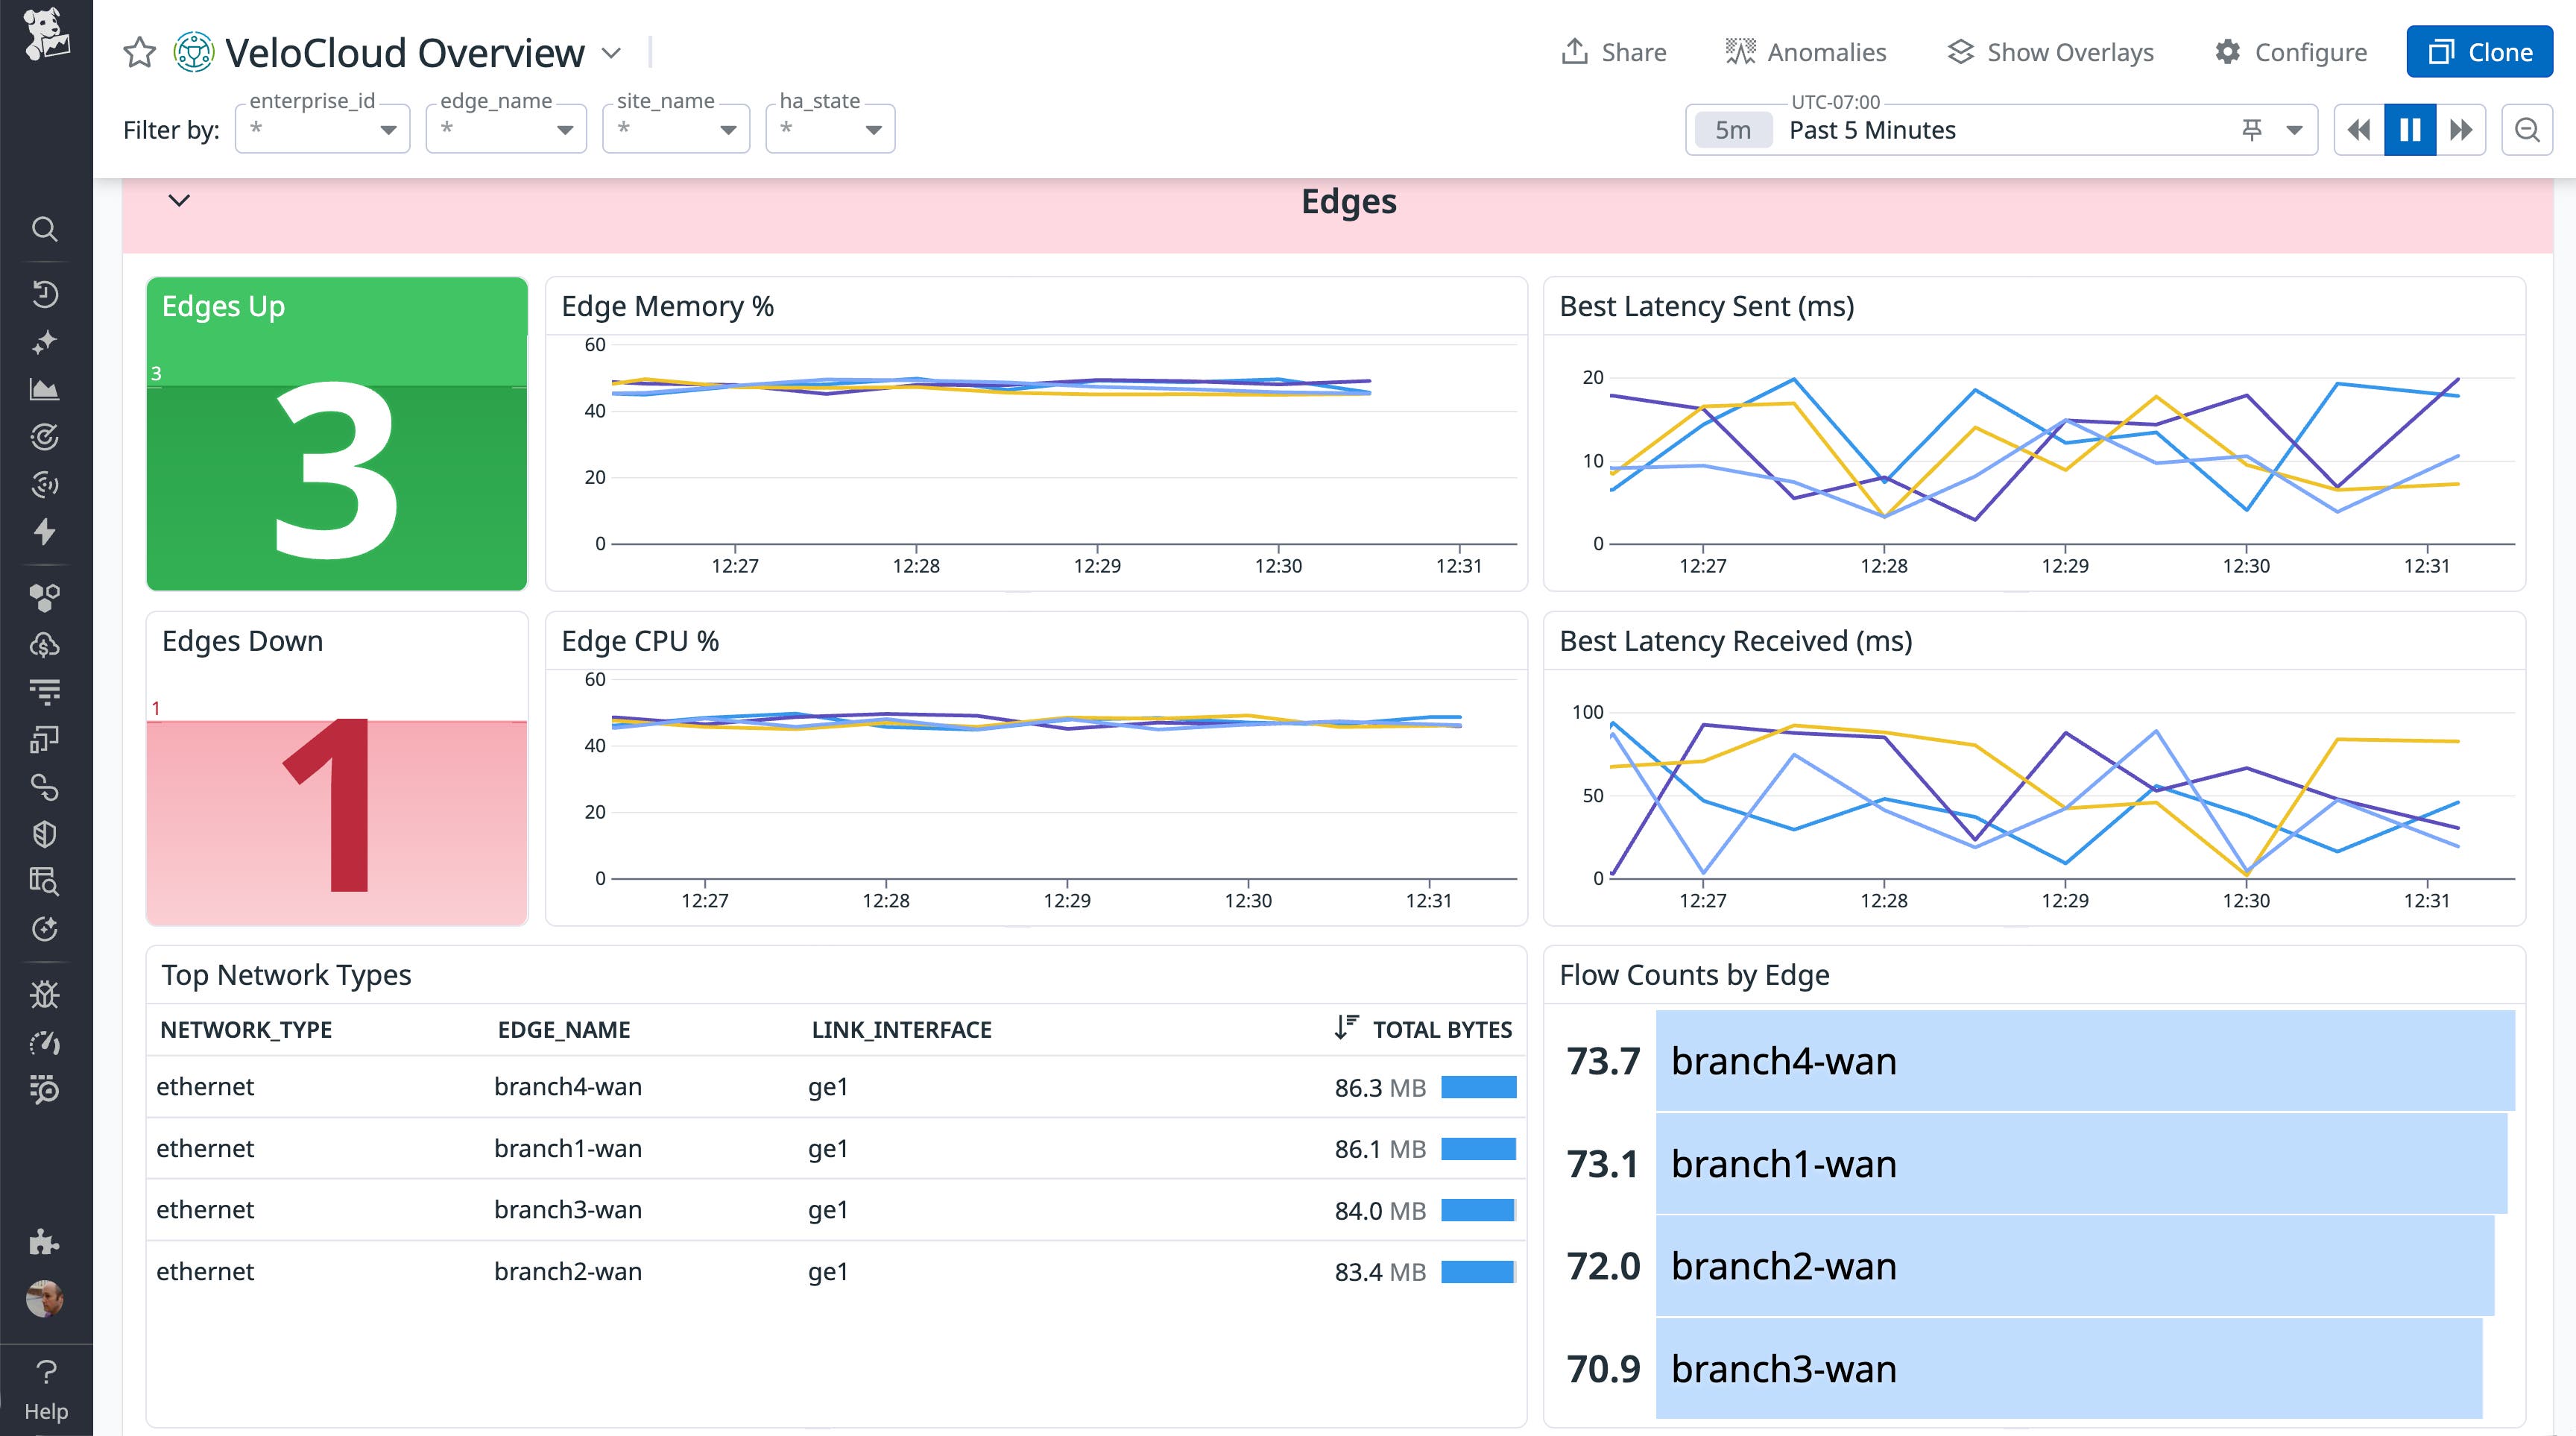
You can also monitor the resource usage and availability of your VeloCloud SD-WAN edge devices, which route traffic between branch locations, data centers, and the cloud. If an edge node becomes overloaded or unavailable, application traffic may be disrupted. Datadog enables you to easily determine whether edge device performance is a factor in network disruption by surfacing metrics such as:
- CPU and memory usage
- Device uptime and availability
- Interface traffic and bandwidth consumption

You can add VeloCloud metrics to existing dashboards to add context, and create your own dashboards to customize your WAN performance data visualization. To minimize and even prevent network disruptions in your SD-WAN environment, you can set up monitors to automatically alert you if a device fails or exhibits high resource usage that could affect network performance or signal a pending failure.
Detect and troubleshoot connectivity issues
VeloCloud provides connectivity across multiple transport types, including MPLS, broadband, and LTE. This enables you to manage a cost-efficient WAN environment that provides fast transport across a potentially wide and varied geography. But that environment can become complex, making troubleshooting a challenge. To effectively diagnose and fix SD-WAN performance issues such as high packet loss, congestion, and unstable links, teams need the ability to analyze the performance history of each device and detect anomalies in real time.
The VeloCloud integration helps teams quickly pinpoint and resolve network issues before they impact users by detecting sudden spikes in latency, jitter, and packet loss. You can then create monitors to alert you when link quality degrades, helping you to address the underlying issue before network disruptions occur. Datadog’s machine learning–powered anomaly detection identifies underperforming transport links automatically, accelerating troubleshooting and providing the information you need to optimize routing policies.
Monitor VeloCloud with Datadog NDM
While the OOTB and custom dashboards provide high-level views of your VeloCloud metrics, Datadog NDM allows you to dive deeper and track the performance of every individual network component within your SD-WAN environment and beyond. With NDM, you can easily inspect each network device in your fleet, including your VeloCloud Edges. You’ll see a summary of each device’s interface states (such as up, down, or admin down) alongside crucial metrics like uptime and total inbound and outbound throughput. By surfacing status and performance data, NDM helps you see whether a specific VeloCloud Edge or other network device may be responsible for network disruptions.
Furthermore, NDM provides granular performance details down to the individual interface level. For every interface on a monitored device, you can view critical data such as error counts and the rate of data sent and received. This level of detail is invaluable for spotting bottlenecks, identifying oversaturated interfaces that could be impacting VeloCloud path quality, and gaining a precise understanding of traffic flow and potential issues within specific segments of your network infrastructure.
Gain end-to-end visibility into your SD-WAN infrastructure
Together, NDM and the VeloCloud SD-WAN integration give you end-to-end visibility into network performance across distributed environments. By monitoring link quality, edge health, and transport behavior in real time, teams can reduce downtime and enhance the reliability of their WAN connectivity. See the documentation to learn more about the VeloCloud SD-WAN integration. If you’re not using Datadog yet, you can start a free 14-day trial.


