Leo Cavaille

Kai Xin Tai
VMware vSphere is a server virtualization platform that enables organizations to provision and manage virtual machines at scale. With its comprehensive suite of products, vSphere helps companies manage datacenter resources, migrate workloads without downtime, run applications with high availability, and more. To keep tabs on dynamic vSphere environments and effectively address resource bottlenecks, you need deep visibility across every part of your infrastructure.
Datadog’s vSphere integration allows you to monitor real-time metrics and events from ESXi hosts and VMs. To provide even deeper visibility into your vSphere environment, we recently enhanced our integration to collect metrics from clusters, datastores, and datacenters, as well as automatically import any custom tags you’ve added to your resources. In addition, we’ve created more ways to fine-tune the integration to collect only the data that matters most to you, which helps optimize the performance of this check.
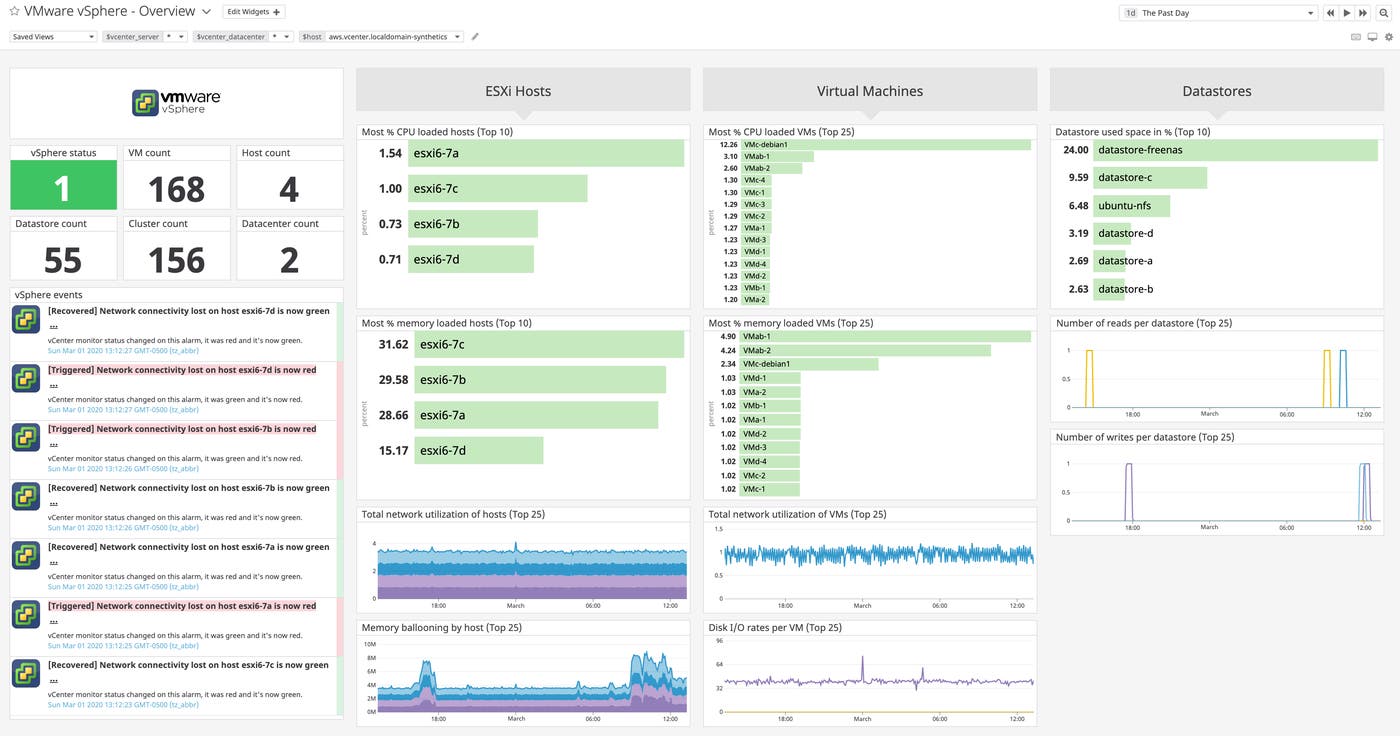
Our out-of-the-box dashboard displays key resource and performance metrics from your ESXi hosts, VMs, and datastores at a glance. You can clone and customize this dashboard to include metrics from other components of your vSphere environment, or any technologies you’re running on vSphere that are supported by Datadog (e.g., SAP HANA, Apache Hadoop, or Oracle).
Explore real-time and historical vSphere performance metrics
Every virtual and physical component in vSphere is called an inventory object. vSphere exposes two types of performance data for different inventory objects:
- Real-time metrics, which are collected every 20 seconds, are available for ESXi hosts and VMs.
- Historical metrics, which are collected at various intervals, are available only for inventory objects that only report aggregated data, such as datastores, data centers, and clusters.
You can use the collection_type parameter in your vSphere integration configuration file to collect either or both types of metrics with Datadog. By default, collection_type is set to realtime. If you would like to collect both, we recommend creating separate configuration instances that connect to the same vCenter Server instance, since the two types of metrics are aggregated at different time intervals.
Keep an eye on memory ballooning
If an ESXi host is running low on host physical memory, the hypervisor uses a technique known as memory ballooning to reclaim any unused memory from the VMs in the environment. While this process reallocates memory to areas that require it, excessive ballooning can lead to the swapping of guest memory to disk, which further degrades the performance of the VMs.
With Datadog, you can easily view vSphere and application metrics—and correlate them with events, including any triggered alerts—to gain a better understanding of your infrastructure and quickly address any performance issues. In this example below, we can see a correlated spike in memory ballooning and SQL Server batch requests. During that time period, we can also see that the alert we set up for increased SQL Server replication lag was triggered.
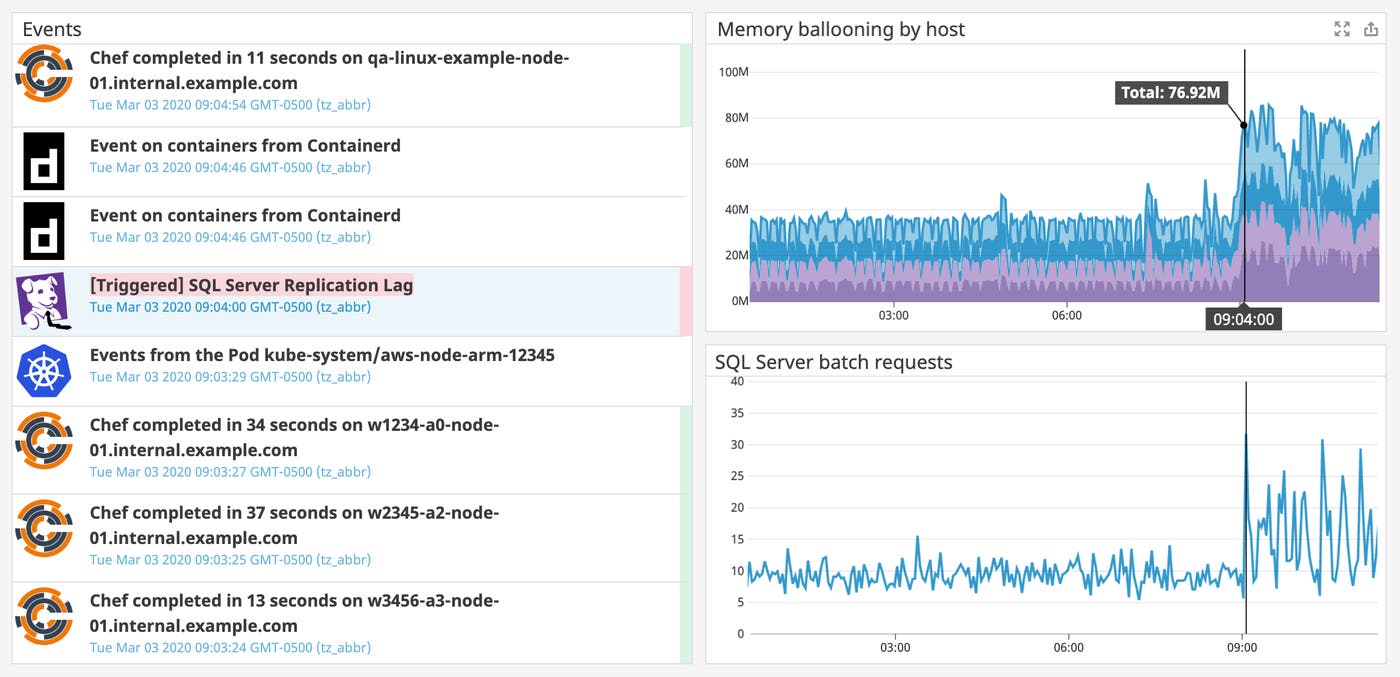
To remediate this issue, you should first check the amount of free physical memory on the host to see if it is able to handle the increased demand. If there is insufficient memory remaining, you can reduce the cache size of your VMs to free up memory, or scale up the amount of physical memory on the host.
Track datastore disk usage
In vSphere, a datastore is a logical storage unit for files, and could be located on a local hard drive or across the network. When disk space on your datastore runs out, the datastore, along with any VMs or applications that depend on it, becomes unavailable. Therefore, it is important to monitor the amount of available disk space to ensure there are enough resources to avoid potential downtime.
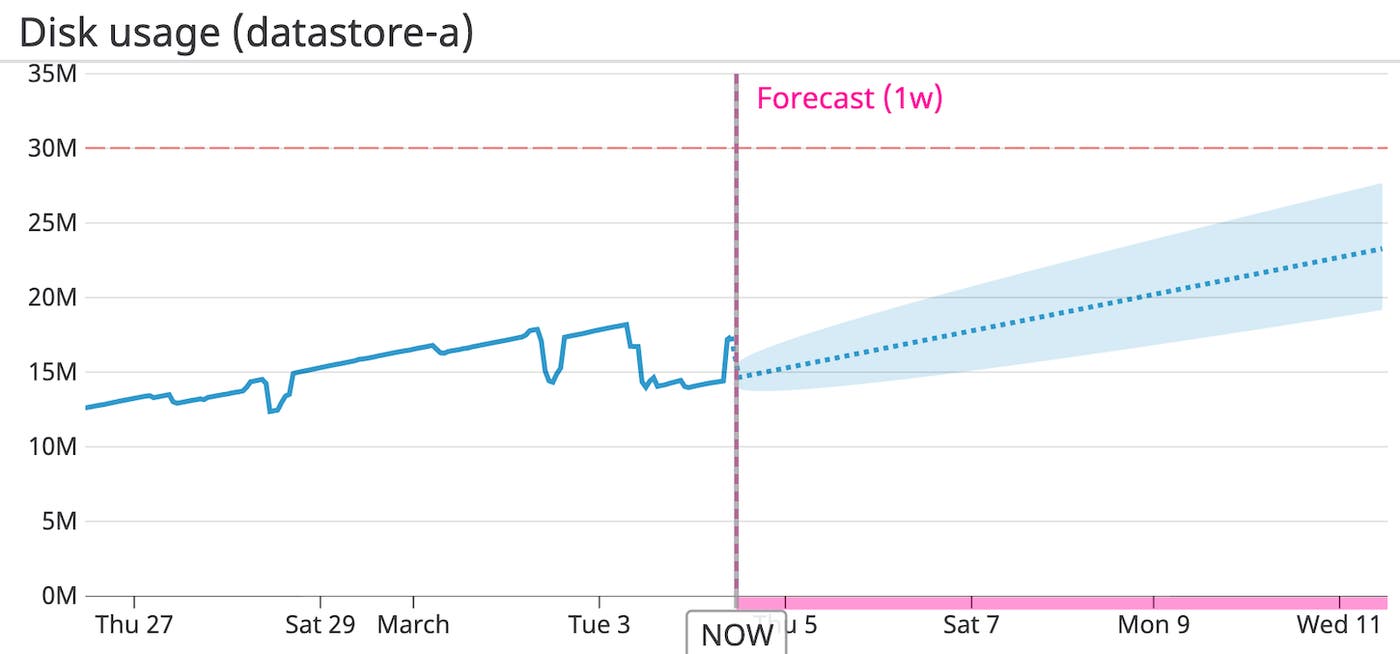
With Datadog’s forecasting algorithms, you can visualize the projected disk usage of each datastore and get notified well before it is predicted to exceed a critical threshold. This should give you enough time to scale your datastore’s resources, if necessary, before VM or application performance degrades. When the alert triggers, you might want to provision more space to the datastore or add disks to the datastore, as detailed here. Or, if you find that snapshot files are consuming disk space excessively, you could consider consolidating them to virtual disk(s) when they are no longer needed.
Monitor CPU utilization across clusters
Tracking CPU utilization across clusters is vital for maintaining a highly performant vSphere deployment. Datadog allows you to easily keep an eye on the percentage of CPU your clusters are currently using—and even drill down to a more granular level (e.g., by VM, operating system, version, etc.) using tags that Datadog pulls from your vSphere environment.
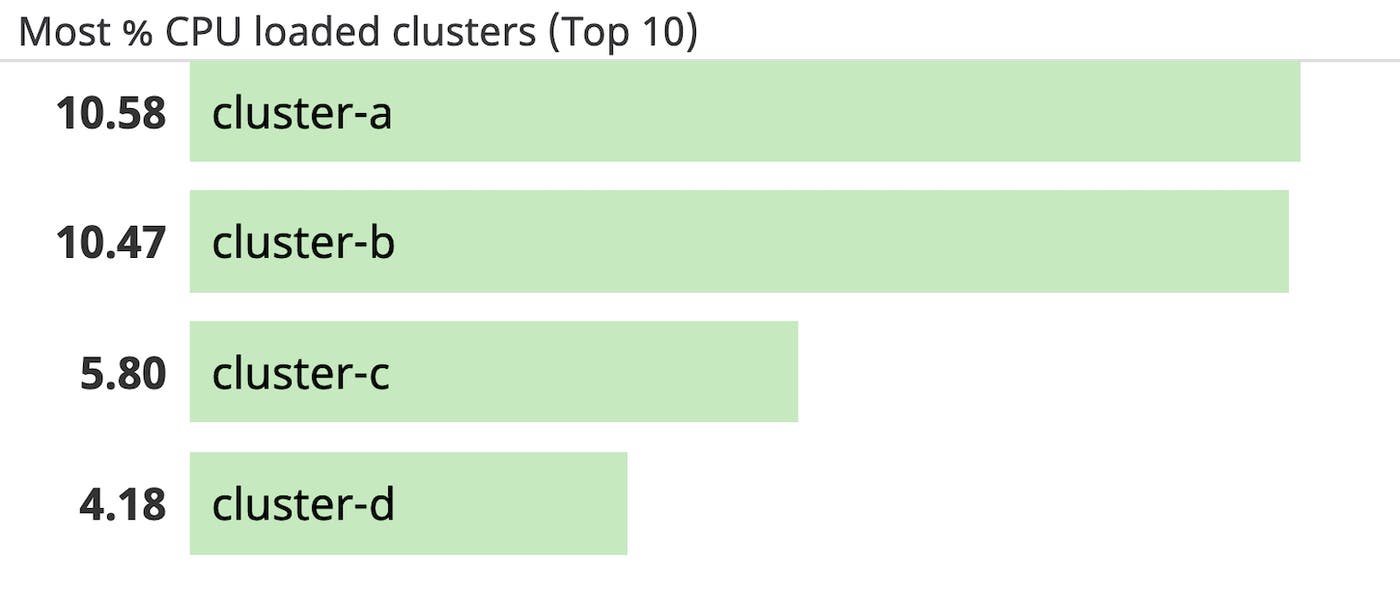
High CPU usage can cause an increase in CPU ready time—the time the virtual machine waits in a ready state but the CPU is unable to schedule it on a physical core because all resources are in use. A sustained spike in CPU ready time can degrade the performance of your VMs and applications. If you observe a correlated spike in CPU utilization and CPU ready time, vSphere recommends reducing the number of virtual CPUs on a VM to the number needed to handle the workload, or migrating VMs from an overloaded host to a new one.
Fine-tune metric collection to optimize performance
If you’re running a large vSphere deployment with hundreds or even thousands of hosts and VMs, collecting data from all of these resources can place significant pressure on the vCenter Server and result in delayed access to the metrics you need. To help reduce load on the vCenter Server, our integration now provides you with the flexibility to control the metrics you want to collect, while still getting visibility into the data that matters most to your business.
As of Datadog Agent version 6.5+, you can set the collection_level parameter in your integration configuration file to a value between 1 (basic metrics) to 4 (all metrics) to select the types of metrics you want to collect from vCenter.
You can also use our resource and metric filters to set even more granular controls. The resource filter configures the check to collect all available metrics from a specific resource only when its property (e.g., name or inventory path) matches a list of regular expressions.
Additionally, the metric filter allows you to select the exact metrics you want Datadog to collect. For each resource type (VM, host, cluster, datastore, and datacenter), you can specify a list of regular expressions to match against available metrics. For more information on configuring filters, head over to our documentation.
Get 360-degree visibility into your vSphere environment
Datadog’s vSphere integration now offers historical metrics, resource tags and greater configurability, making it easier and faster than ever to get deep insights into your large-scale deployments. We support over 1,000 technologies so you can monitor all of your applications running on vSphere. Otherwise, you can get started with a 14-day free trial today.


