Antoine Dussault
When a spike in latency or errors threatens your service’s reliability, identifying the root cause quickly is essential—but not always straightforward. You can group your trace data by tags to see how attributes (such as your service’s version or the data center where it’s running) correlate with its performance. But your grouping strategy is only an educated guess—you have to define the grouping before you know which dimensions contribute to the performance variations you’re investigating, and this trial-and-error workflow can slow down your investigation.
Datadog Tag Analysis removes this guesswork by automatically identifying the tags that best explain increases in latency or errors. This means that you can easily see which tags are statistically significant to the issue you’re investigating and group those spans with a single click to home in on the root cause.
In this post, we’ll explore how Tag Analysis helps you quickly identify the drivers of latency and errors in your services.
Surface latency drivers automatically
Latency can stem from various issues, but the result is the same: degraded user experience and potential losses in customer retention and revenue. Identifying the cause quickly is critical, but sifting through high-cardinality tags to isolate the culprit can slow down your investigation. Tag Analysis simplifies this process by automatically identifying which tags correlate most strongly with a spike in latency. Say you receive an alert notifying you of increasing latency on your service. You can navigate to the Service Page for a high-level view of service performance. You’ll see RED metrics that confirm the rising latency, and you can select the problematic spans to launch Tag Analysis and see which tags are correlated with the errors.
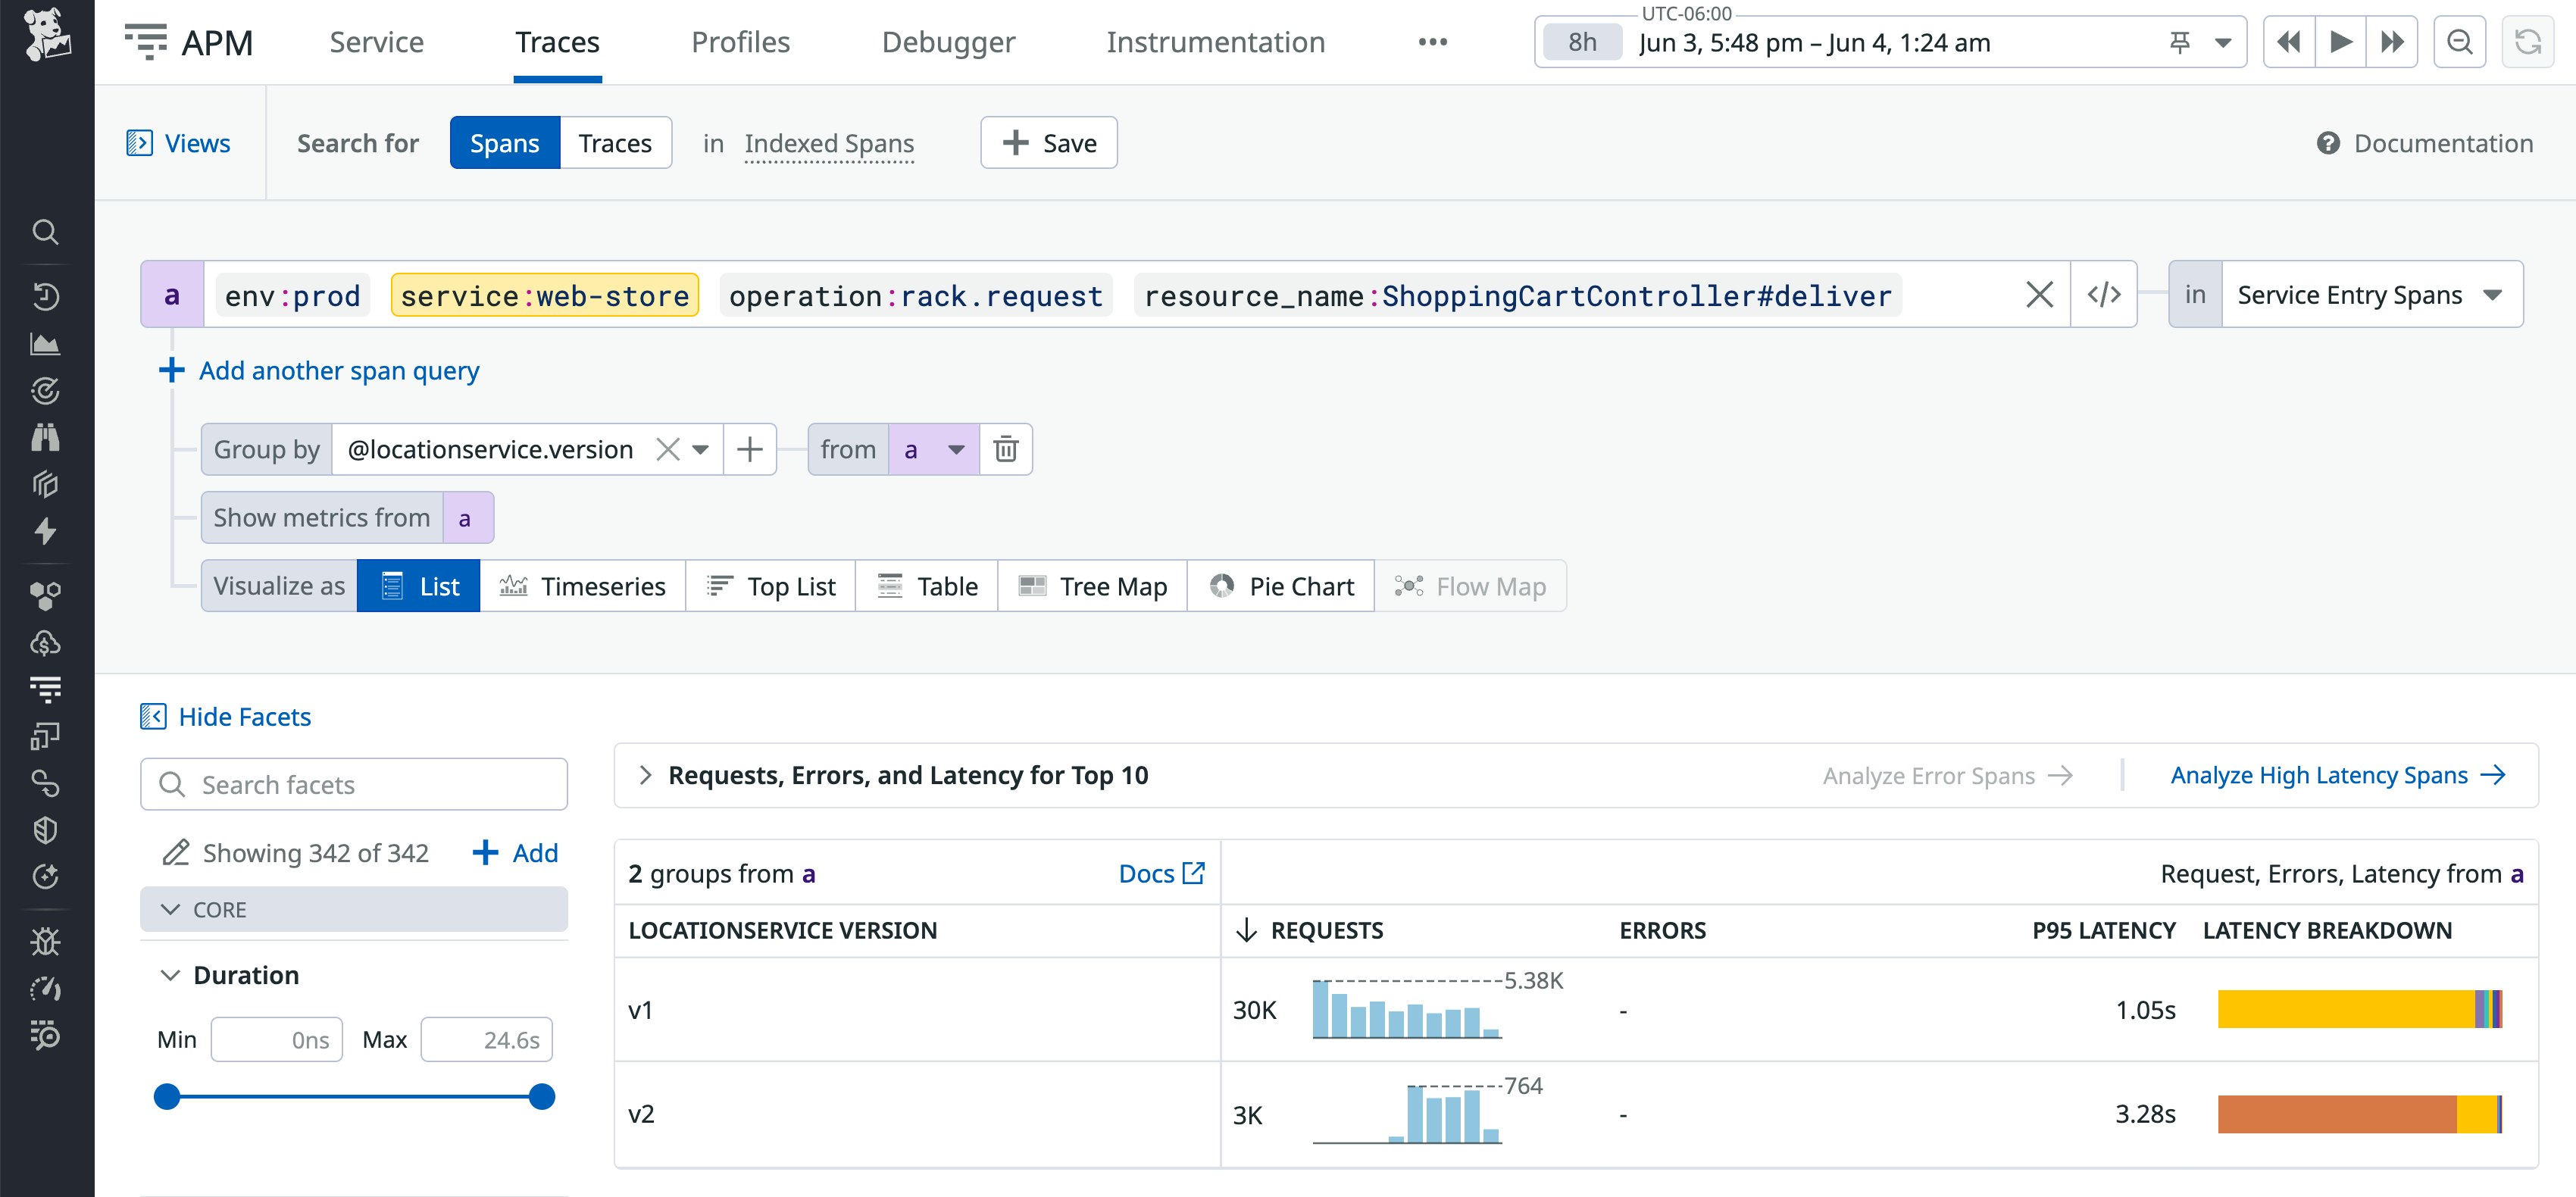
Tag Analysis shows you a scatter plot of span durations that highlights how recent spans differ from the baseline, which is established by the spans that represent your service’s typical performance. Additionally, you’ll see the top correlated tags and their relative latency across the high-latency and baseline groups. In the following screenshot, Tag Analysis shows that spans tagged v2 are consistently slower than those tagged v1.
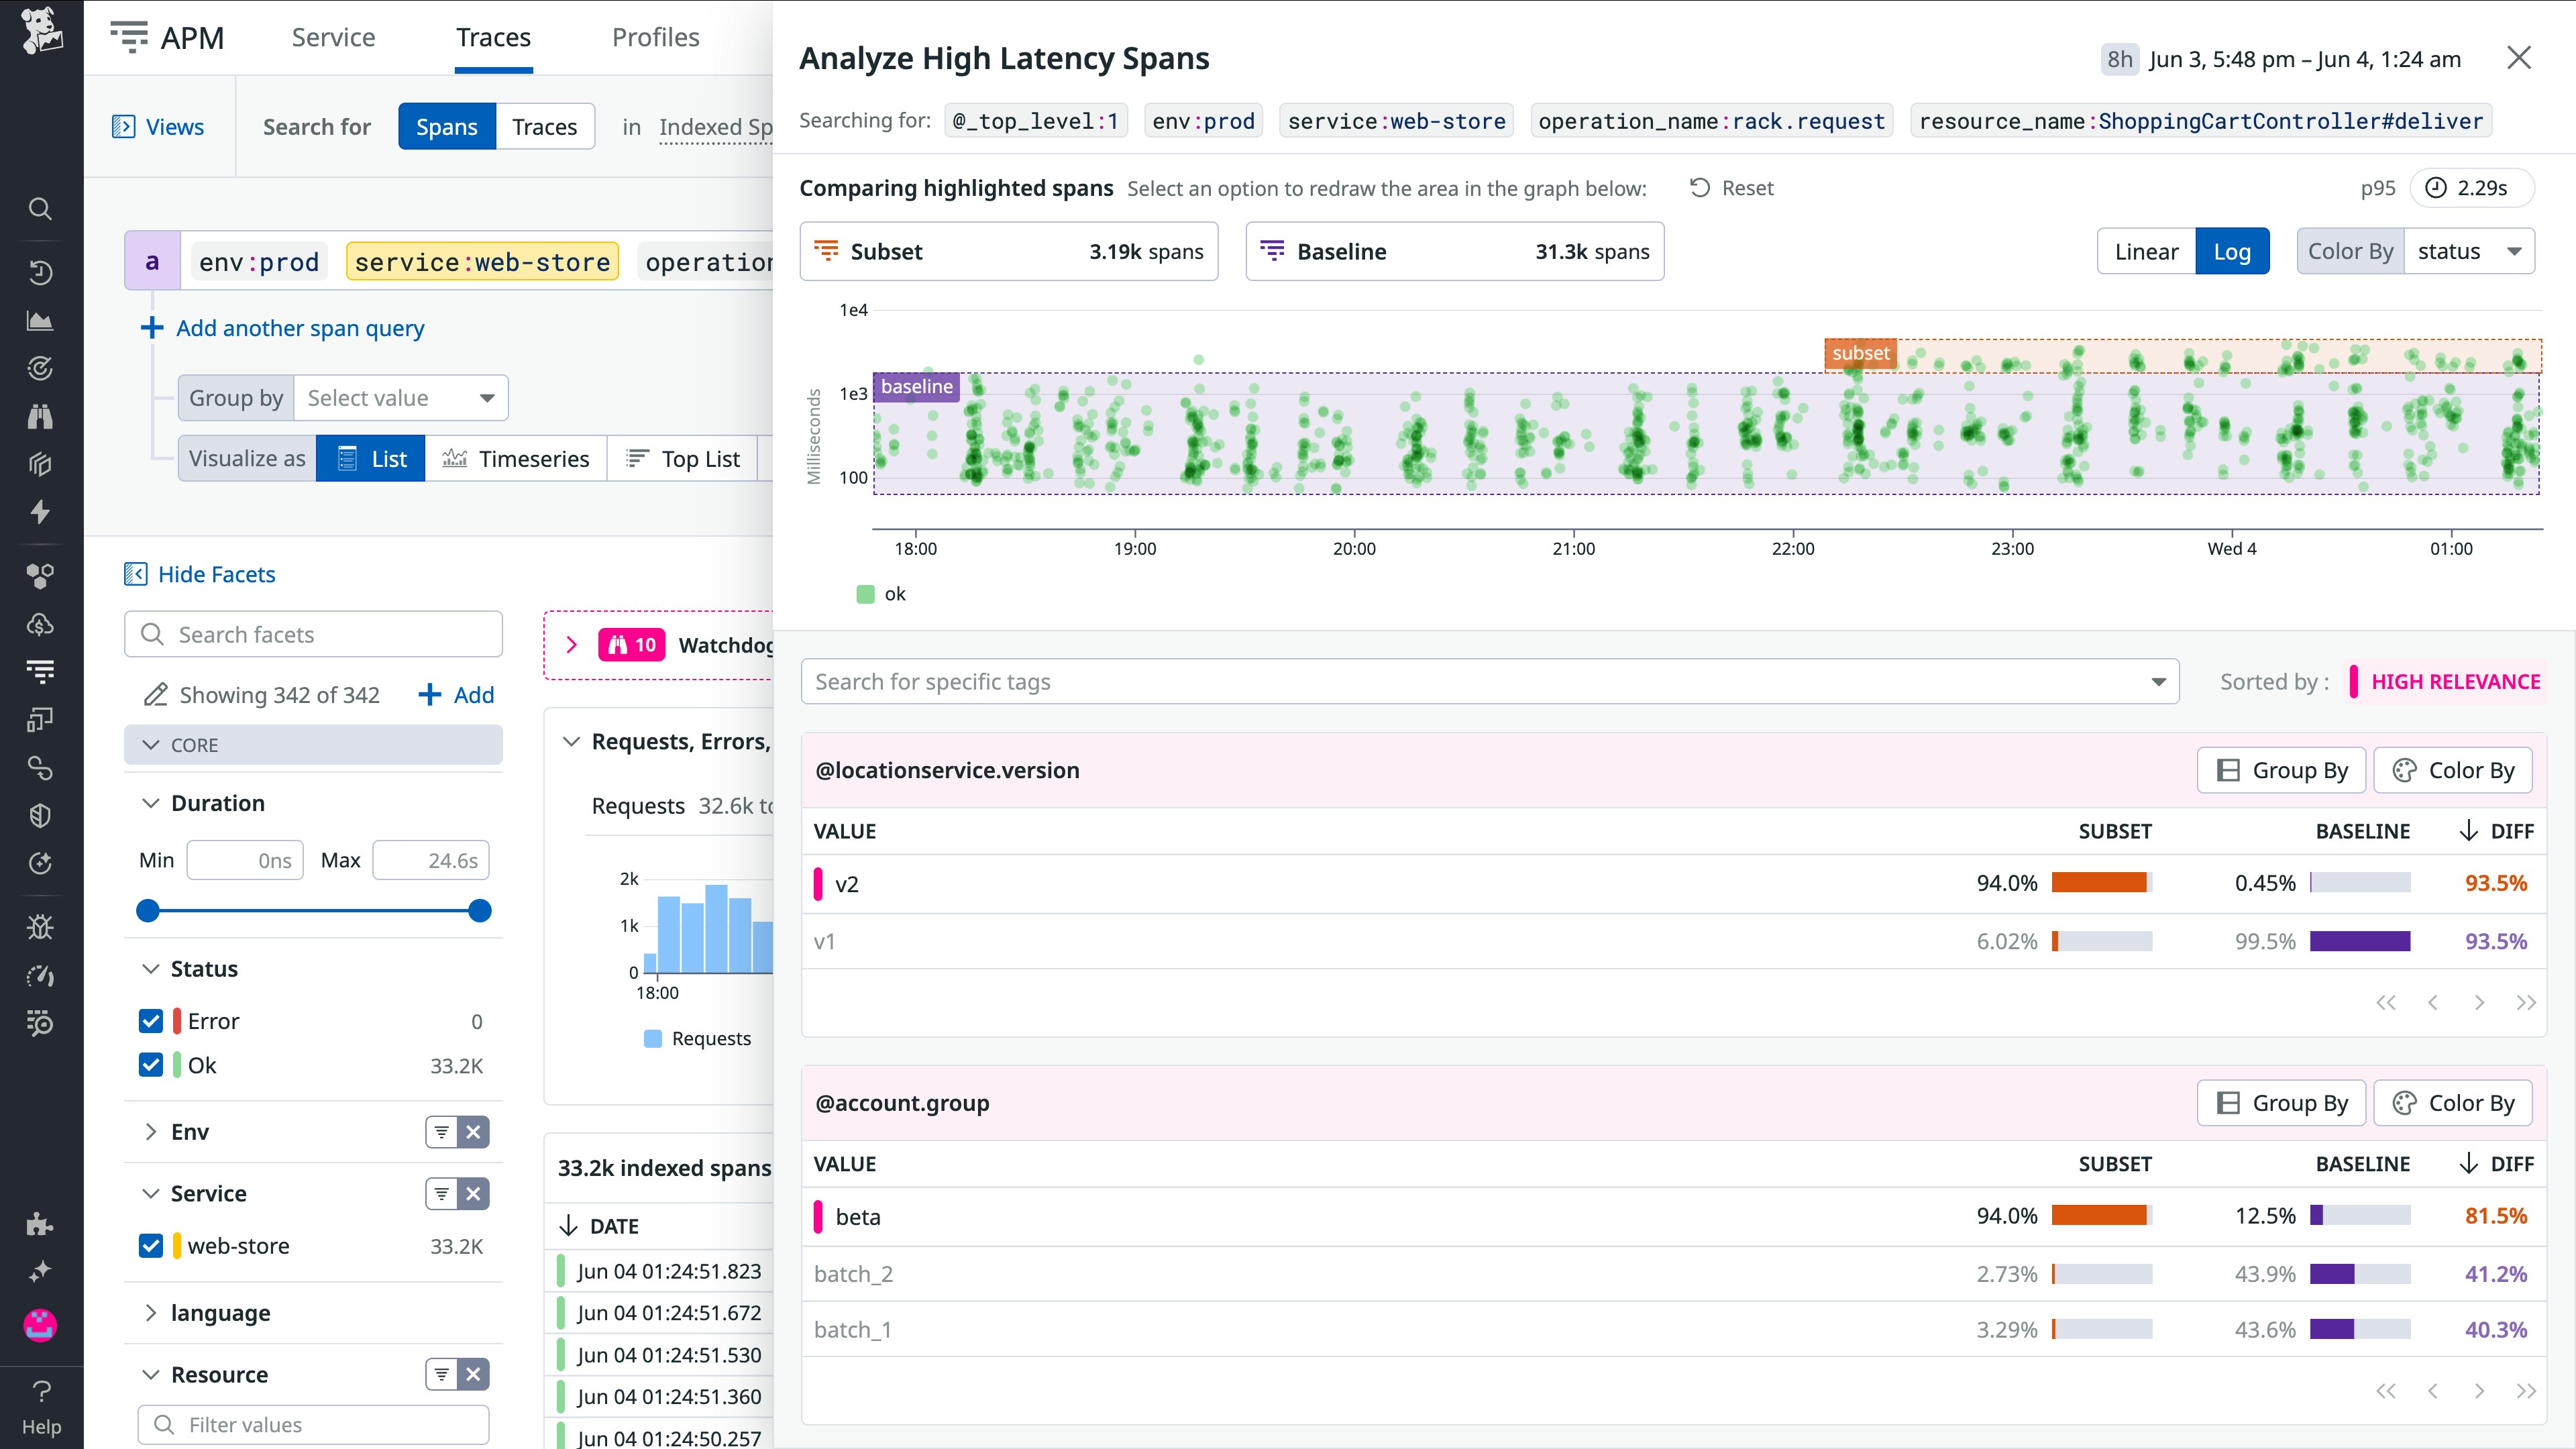
These correlations can help you better understand the scope of the problem, in this case suggesting that the latency increase could be related to the recent deployment of a new version of the service. Tag Analysis also shows that the account.group tag is strongly correlated with the difference in latency. The beta group—the first users of the newly released version—are overrepresented in the high-latency spans. With this insight, you can avoid a wider impact by halting the rollout before it hits more users. And for a closer look at how the locationservice.version attribute contributes to the latency, you can easily group by relevant tags—for example, to compare the v1 version’s latency against that of v2.
Understand error spikes without guesswork
Errors are another key driver of poor user experience, and it’s crucial to watch for them and investigate as soon as they arise—whether via dashboards, monitors, or Error Tracking. To find the scope and cause of the errors you’re investigating, you can group error spans by tag, but manually cycling through attributes to find a correlation is slow and inefficient. Now, you can launch Tag Analysis with a single click to automatically surface the tags most strongly correlated with the spike in errors.
Tag Analysis provides a clear, data-driven direction for your investigation. The ranked list of correlated attributes shows how frequently each tag’s values appear in both the error subset and the baseline, helping you see what the affected spans have in common—and where to focus your investigation next.
In the following screenshot, the highest-rated dimension is account.id, suggesting that the errors affect only a specific segment of customers.
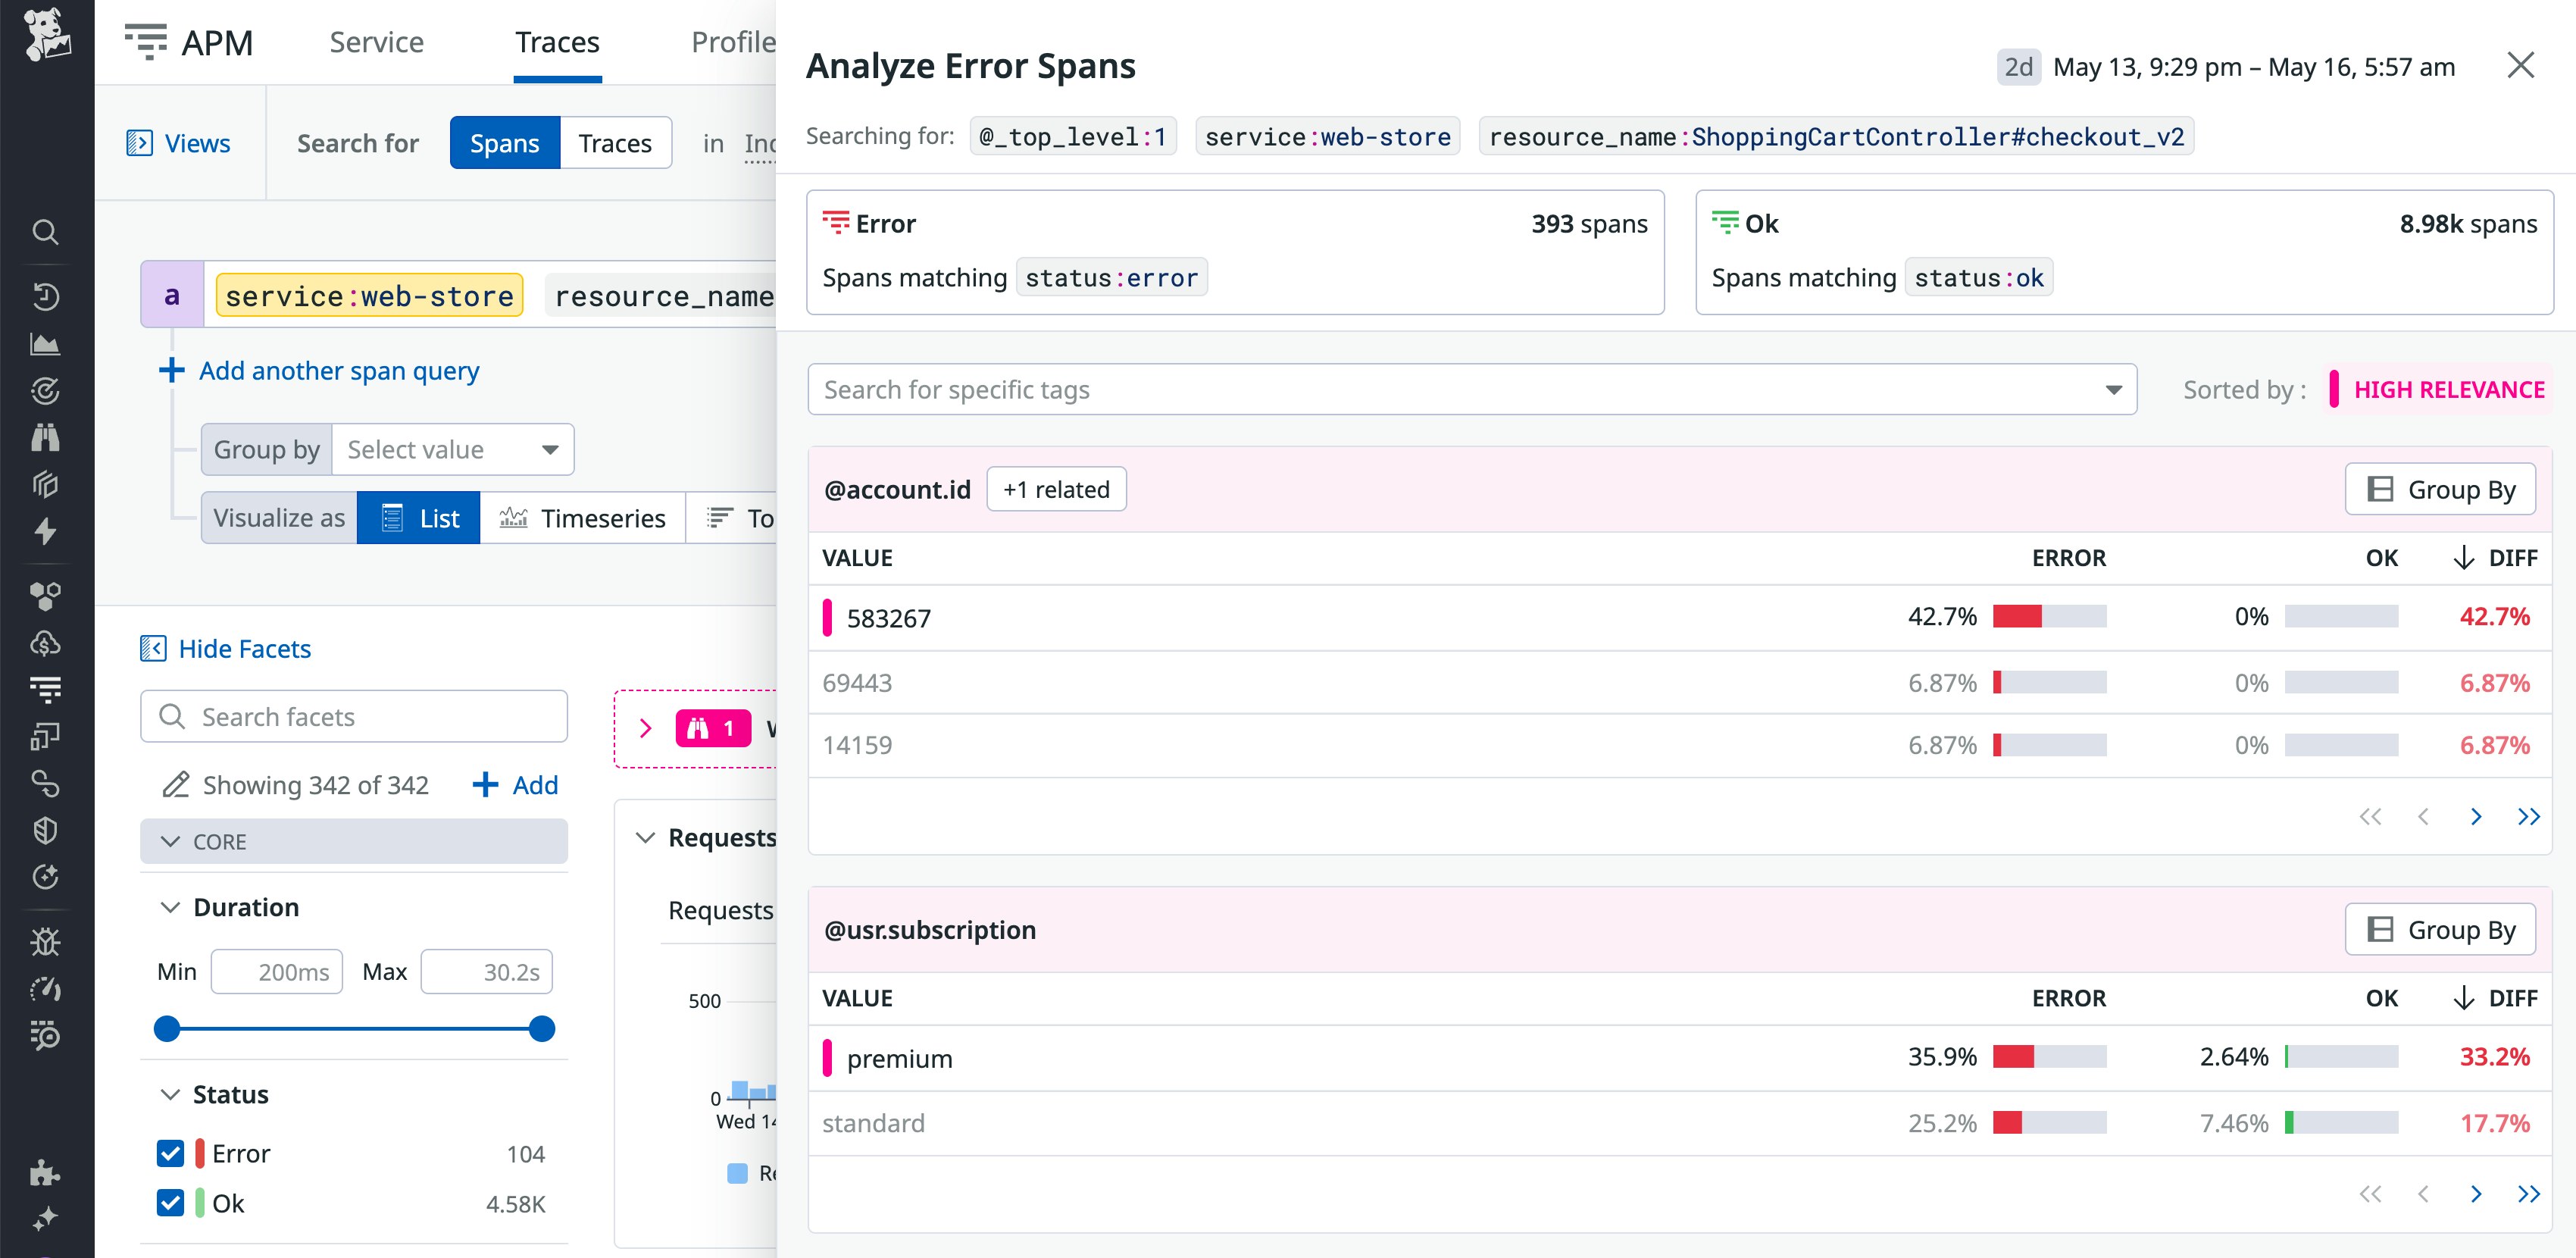
Troubleshooting an increase in errors becomes more manageable once you learn that most errorful spans originated with a specific customer category. This information can guide your investigation, enabling you to quickly rule out irrelevant variables and focus on the attributes that most likely contributed to the errors. For example, recognizing that the bulk of errors are associated with certain customers suggests that you should investigate whether the errors relate to malformed requests, expired credentials, integration changes, or other issues on the client side.
Zero in on high-impact tags with Tag Analysis
By automatically identifying the tags that are correlated with an increase in errors or latency, Tag Analysis helps you quickly understand the root cause. These automated insights surface what’s driving the issue so that you can avoid trial-and-error investigations and focus your mitigation efforts where they matter most.
Tag Analysis is now available in Preview. You can sign up here and see the Tag Analysis documentation to get started. To learn more about how to troubleshoot application performance, see the Datadog APM documentation. If you don’t already have a Datadog account, you can sign up for a free 14-day trial to get started.
