Addie Beach
SLOs are key for improving user satisfaction, prioritizing engineering projects, and measuring overall performance. Given the important role that SLOs play in determining organizational benchmarks, teams need to ensure that SLO metrics—also called service level indicators (SLIs)—are reported accurately and maintained consistently within an acceptable range.
Generally, you want to calculate your SLO data based on your production environments to ensure that you’re receiving the most faithful assessment of your system. However, monitoring SLOs in synthetic tests as well can help identify issues before they affect your users and potentially cause significant business impact. Synthetic SLOs enable you to confirm that your SLIs are being collected and calculated correctly, as well as help you anticipate critical performance issues.
In this post, we’ll explore how you can:
How to set up SLO-based synthetic tests
SLOs set organization-wide reliability standards for key aspects of your application. Ideally, you want to define and monitor SLOs for every critical flow in your app to ensure that users are receiving the best possible experience. Not only does this help you spot issues quickly, it also helps teams understand when they might need to prioritize improving the health and reliability of existing features over creating new ones.
SLOs can measure many different facets of application performance—one of the most fundamental is uptime. At a basic level, you want to ensure that users can actually access your app, even if it’s not performing optimally in all areas.
You can calculate uptime in a variety of ways, such as by periodically monitoring status codes returned by your app, determining whether specific requests can be fulfilled, or watching for latency that exceeds a certain threshold. To account for this, Datadog offers several uptime monitoring options. The easiest option is to use a Time Slice SLO. Time Slice SLOs enable you to decide what metrics you want to use to measure uptime. For example, you can define uptime by setting a range of acceptable p95 latency.
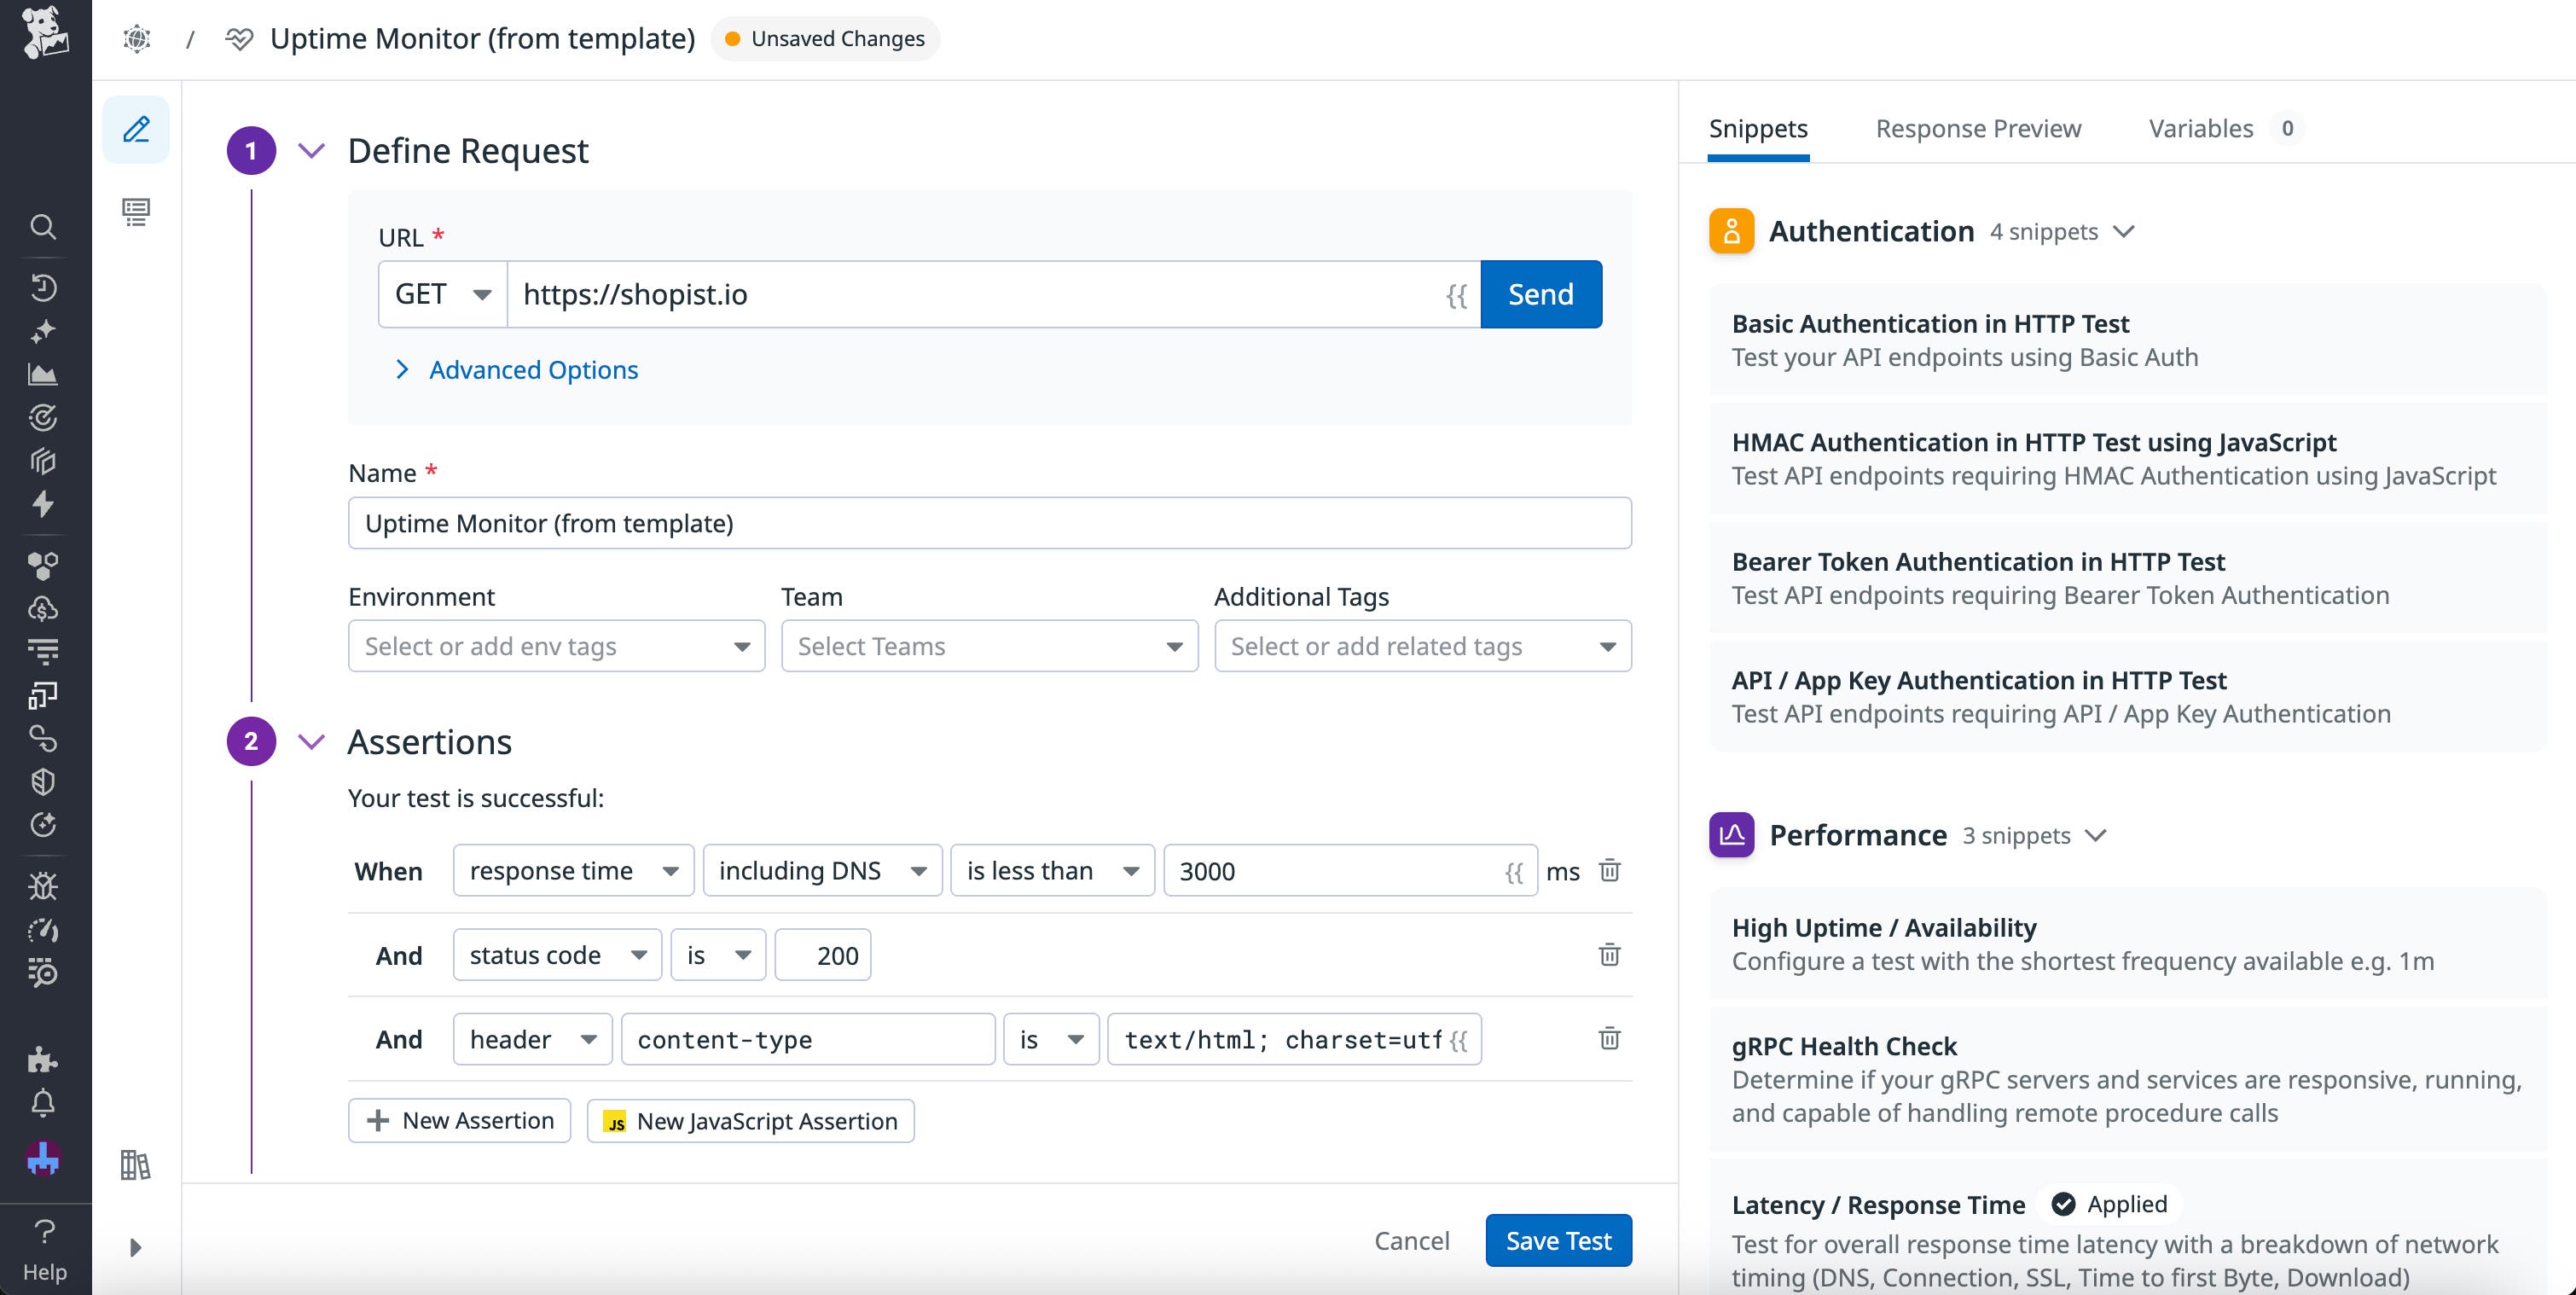
However, when working with synthetic tests, it’s often better to use monitor-based SLOs. Datadog automatically creates monitors for each synthetic test—you can easily configure and customize these monitors to meet the needs of your SLO strategy. For instance, you can change the notification settings to control who gets alerted of failing tests and when.
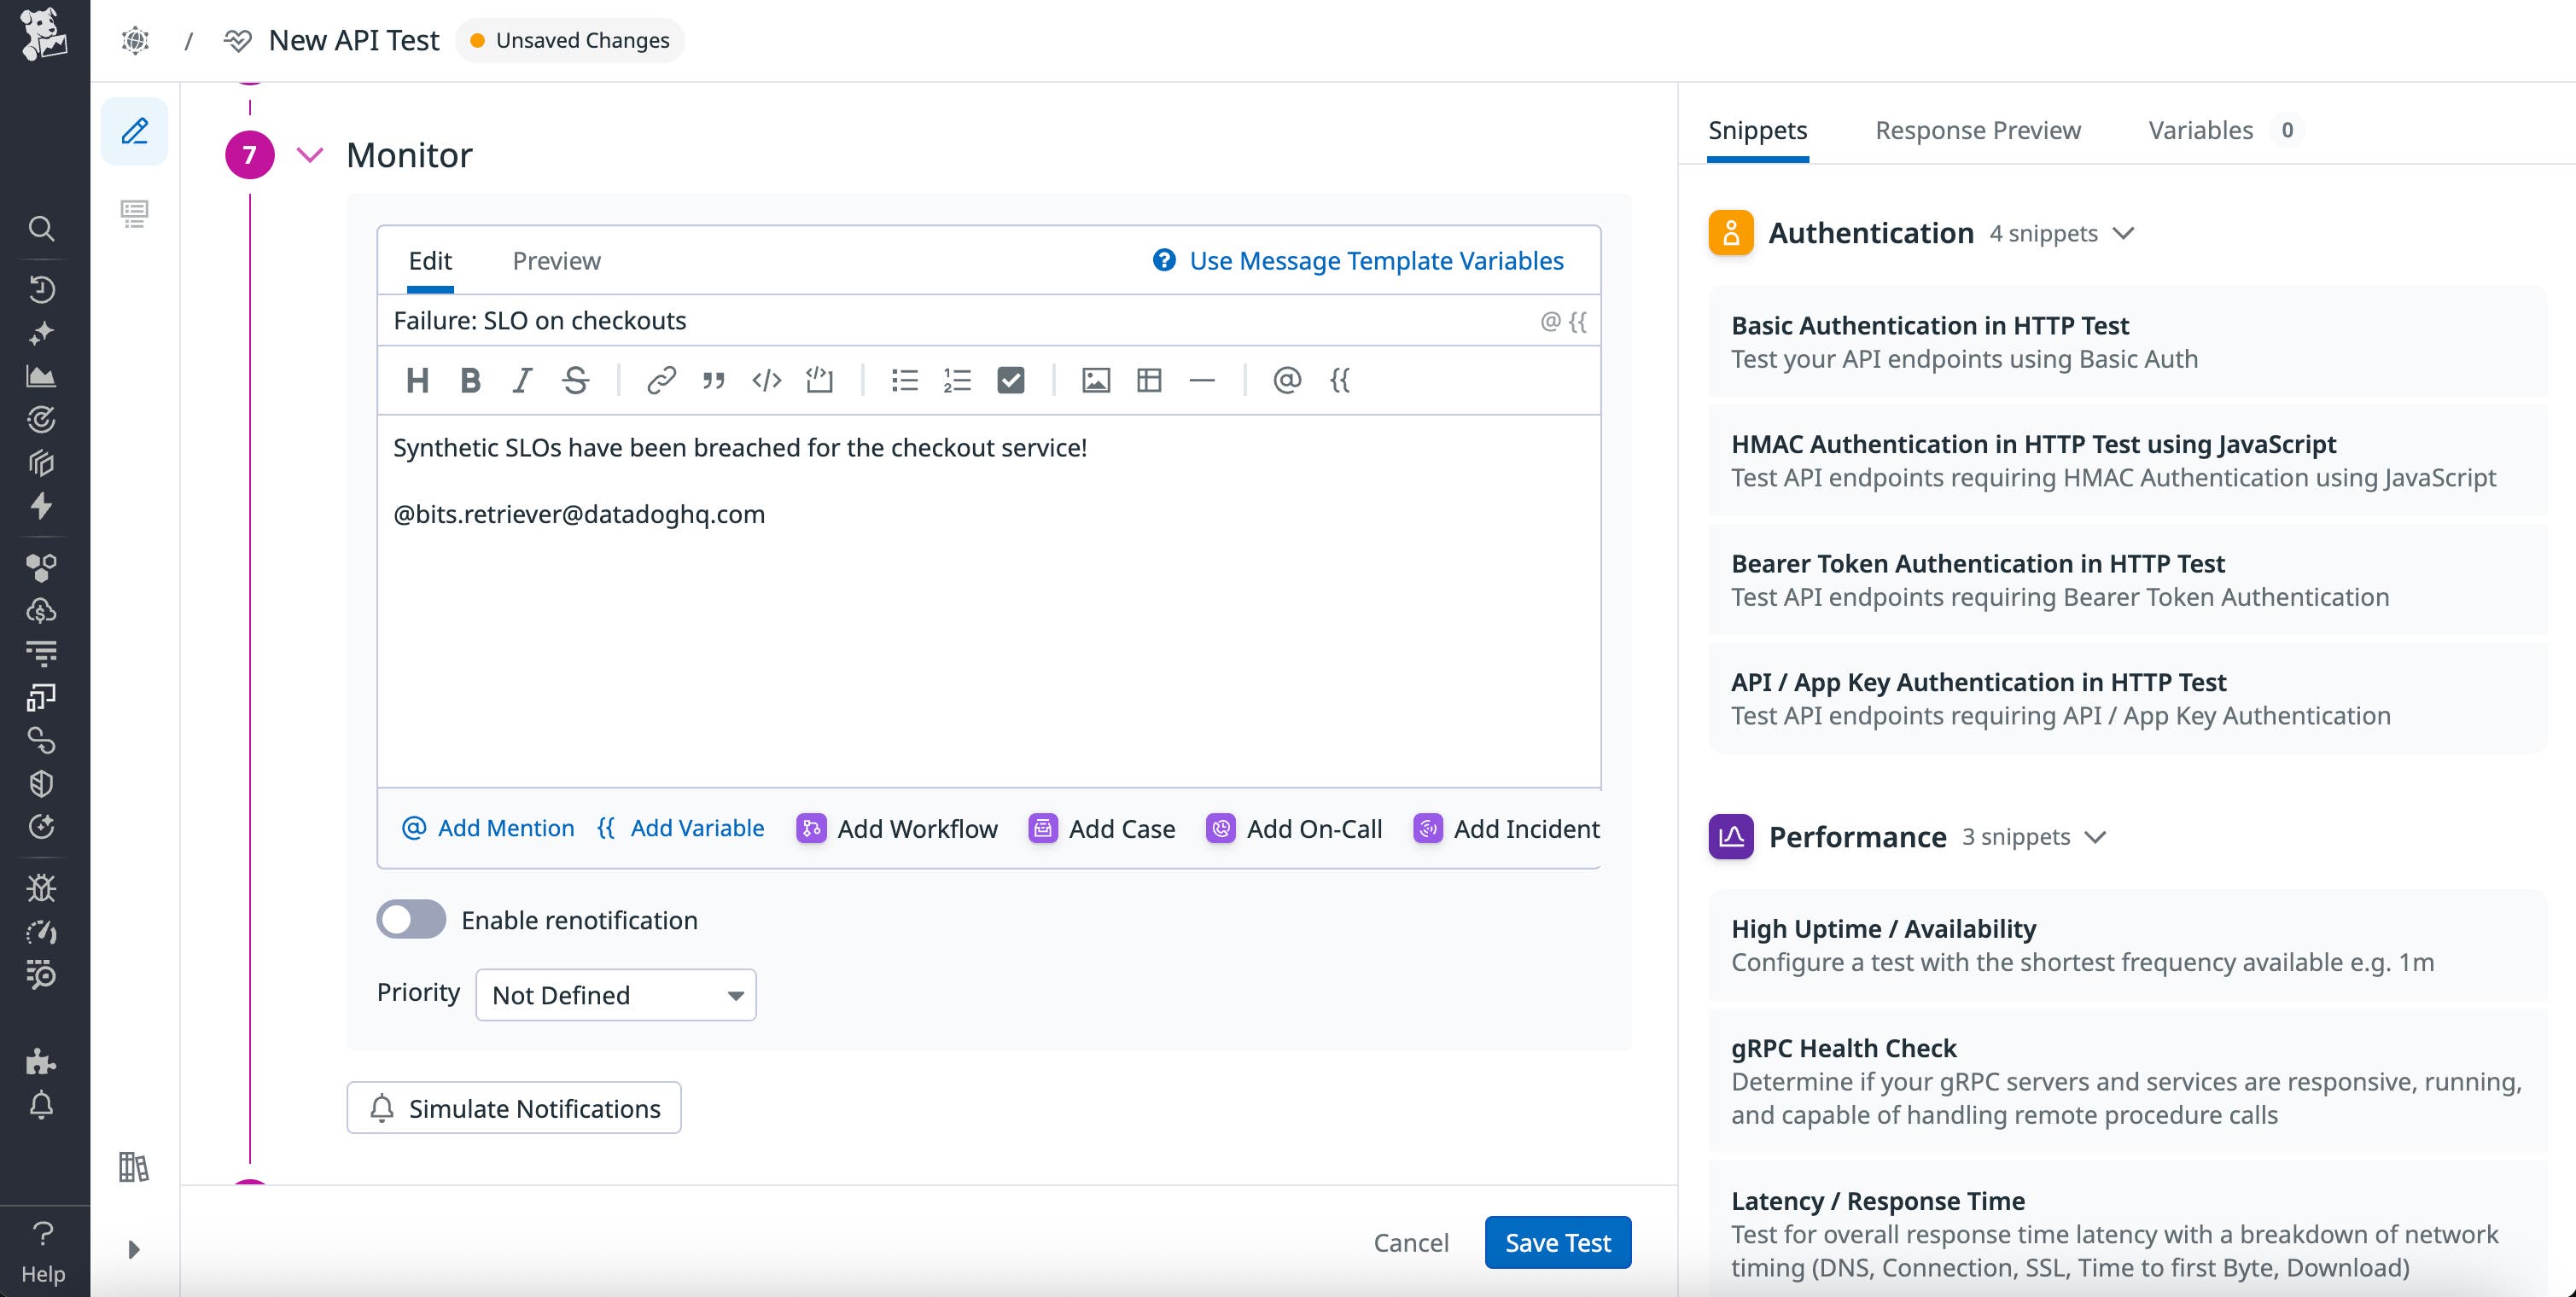
With the Uptime Monitor template in Datadog Synthetic Monitoring, you can easily create a synthetic test that helps you measure the uptime of key user journeys. This test calculates uptime using the status codes returned by your app. By default, the test checks for a 200 status code every minute. Additionally, if you want to measure multiple SLOs in the same test, you can use snippets to easily add extra assertions for other metrics, such as latency and overall response time.
Monitoring your synthetic SLOs
Once you’ve established your SLO-focused synthetic tests, you’ll want to ensure that the results are easily accessible within your monitoring platform. With Datadog, you can view your synthetic test results in a number of formats. For example, Datadog enables you to integrate your synthetic test monitors with third-party tools like Atlassian Statuspage, helping you incorporate synthetic SLO analyses into your existing tools and workflows.
You can also easily view and investigate your synthetic SLO monitors within Datadog itself. Adding SLO widgets to your Datadog dashboards helps you consolidate your monitoring and troubleshooting. You can view your SLOs in the context of other performance metrics from your synthetic tests, such as Core Web Vitals, which helps you easily analyze the potential causes of issues detected by your tests. As a result, you can minimize problems before they spread to your production environments and end users.
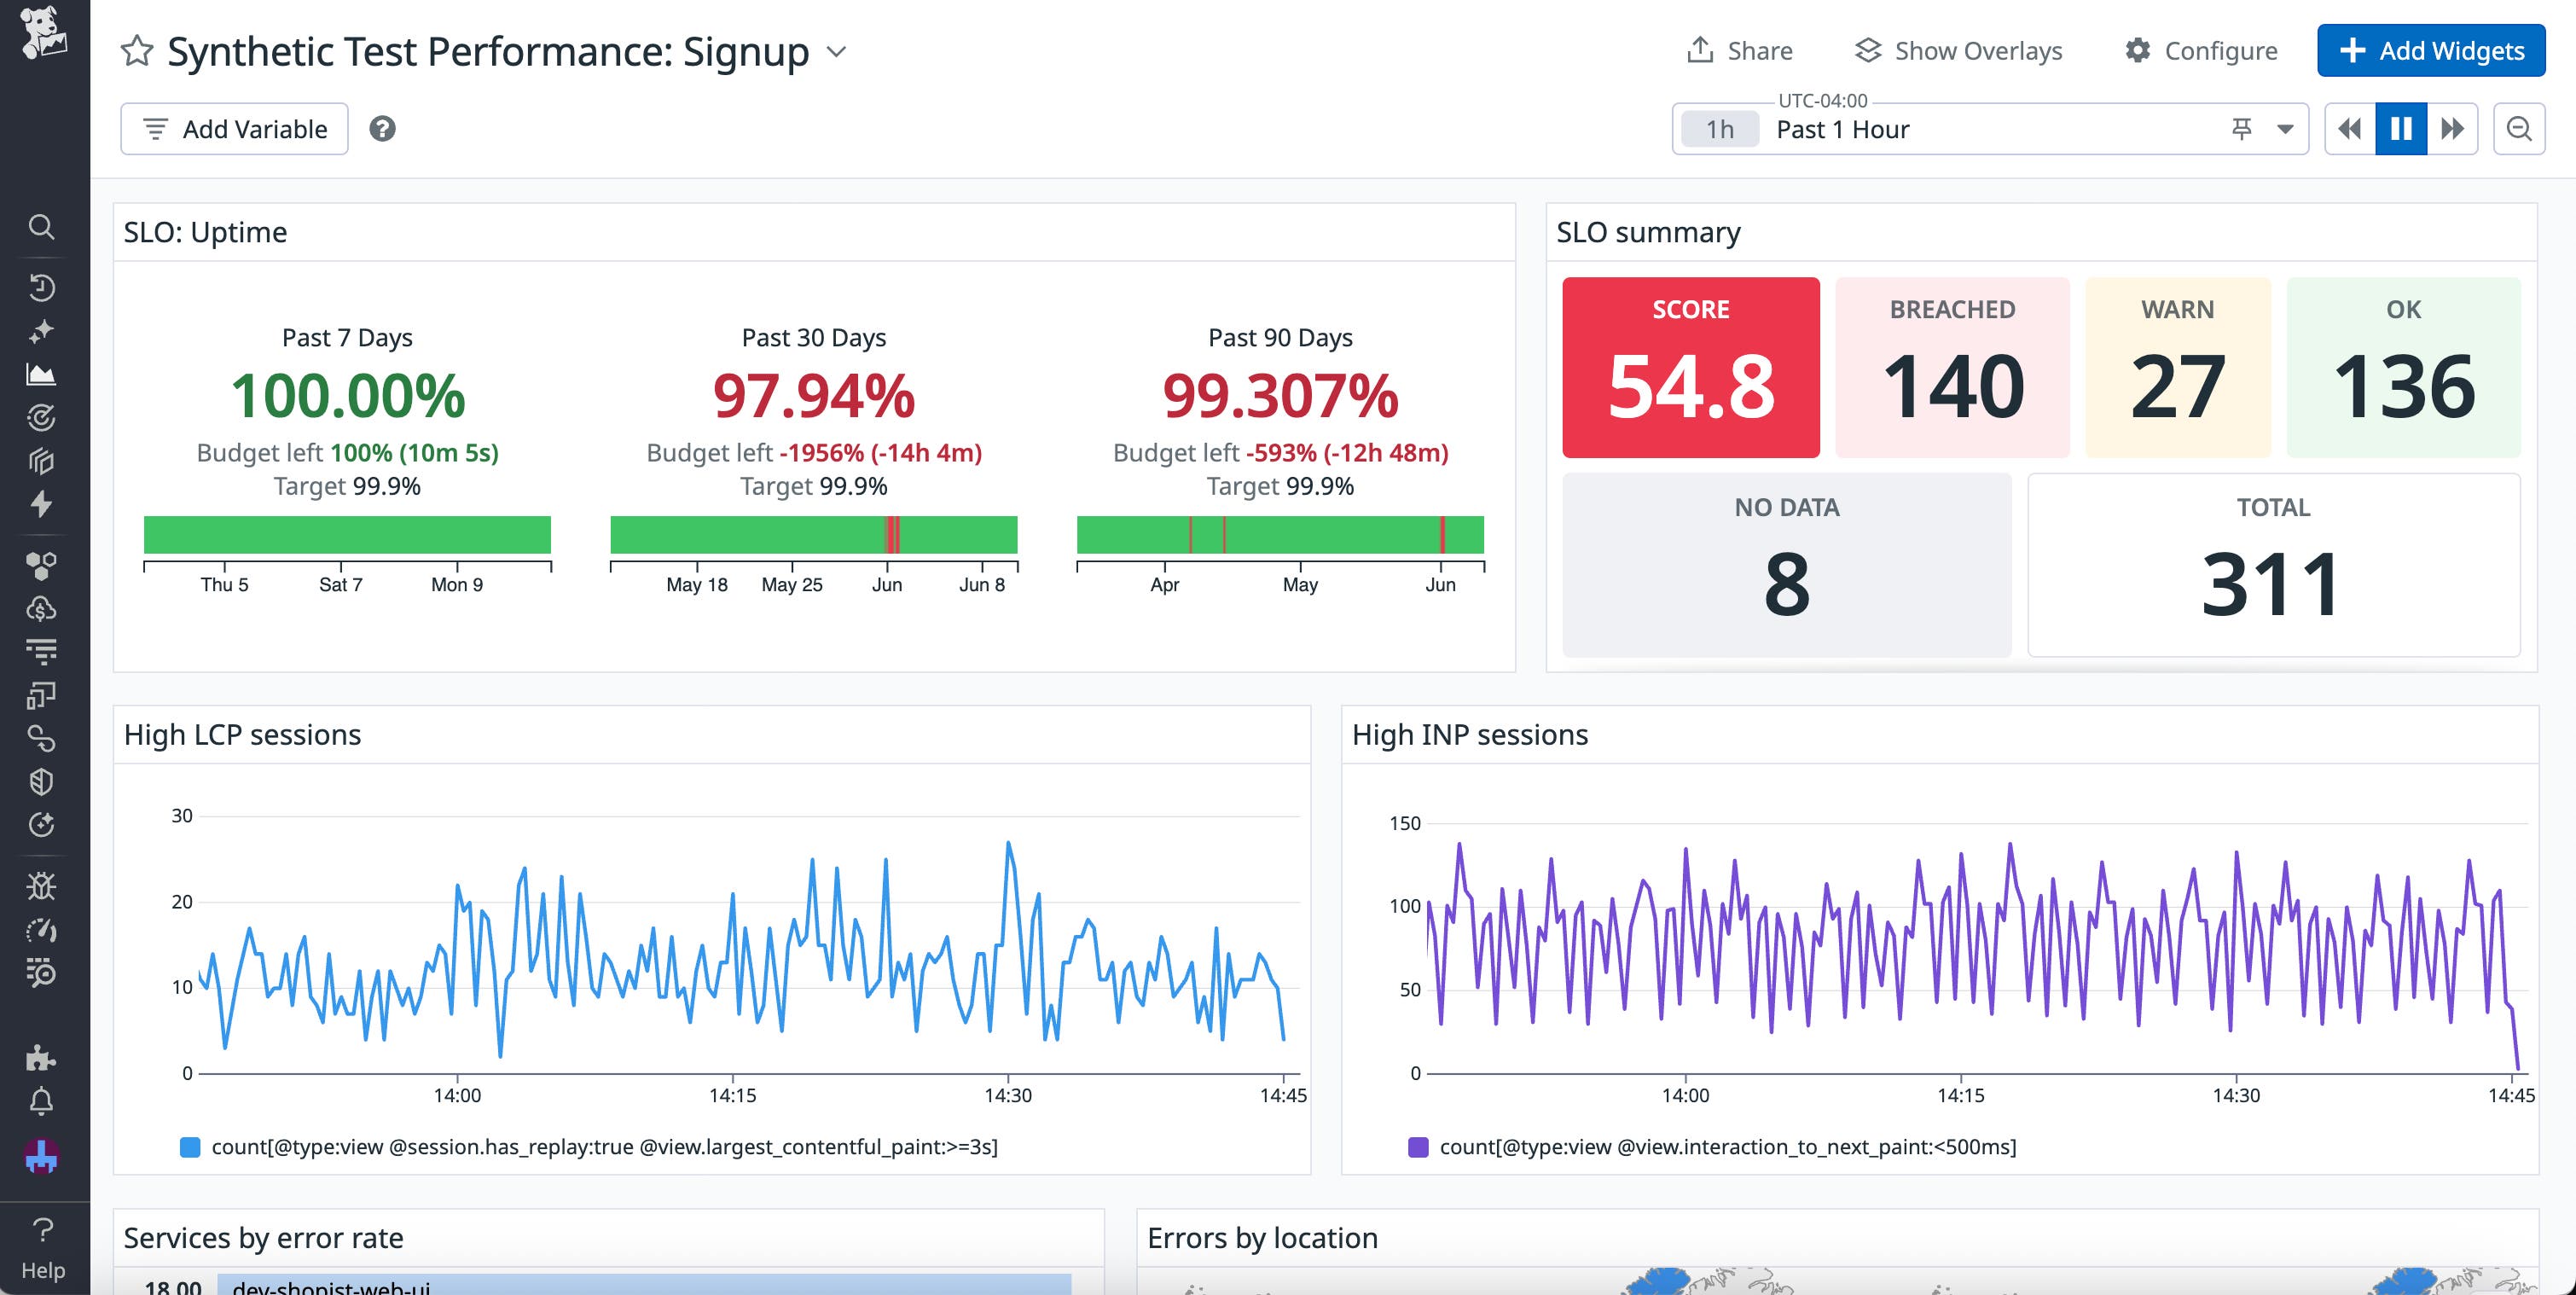
Let’s say you receive a failure notification from a synthetic uptime monitor for a new account signup flow. By viewing the uptime monitor widget on a dashboard alongside the rest of your synthetic test metrics, you’re able to see that latency has recently increased on one of your services. Looking at APM data for this resource using metric correlation, you’re able to pinpoint the problem to a new authentication API your team is trying out.
Additionally, if your SLOs are showing you a wildly different picture of your system than what the rest of your metrics are saying, this may indicate that something has gone wrong in your SLO calculations themselves. For example, let’s say your synthetics performance dashboard shows a sudden, significant increase in latency over the past week, yet your SLOs indicate that nothing has changed and everything is operating as expected. Upon investigating further, you discover that your uptime queries are using the wrong URL. You quickly revise your SLO calculations, then monitor the performance dashboard to confirm that your SLOs now correctly show as breached.
Maintain your SLOs with Datadog Synthetic Monitoring
SLOs are critical to ensuring the reliability of your application. From an engineering perspective, they help teams across your organization maintain a certain performance standard and deliver users a consistently excellent experience. This importance makes maintaining your SLOs key. Synthetic testing can help you ensure that issues reflected within your SLOs are caught and addressed early.
You can use our documentation to start monitoring your SLOs within Datadog Synthetic Monitoring. Or, if you’re new to Datadog, you can sign up for a 14-day free trial.


