Yael Goldstein

Paul Gottschling
When responding to an incident, you need to quickly find the scope of the issue so you know which teams to notify and which parts of your system to investigate next—before your end users are affected. But as multiple processes use resources on each of your hosts, and interact in unexpected ways, it can be difficult to know exactly what is causing an issue—especially if those processes are running off-the-shelf software.
Datadog's Live Processes provides insight into your workloads by tracking resource consumption metrics, traces, and network data for each process running in your infrastructure. Datadog now correlates multiple data types by PID, so you can tell at a glance which processes are causing network bandwidth saturation, application errors, infrastructure latency, and other issues in your system.
Stop overworking your workloads
If resources in your infrastructure aren't scaled or configured appropriately, your applications will have a higher chance of losing availability. To identify failure modes you may have otherwise missed, you need visibility into the resource conditions affecting each running process. Datadog correlates each process with the distributed tracing and APM data it generates, so you can easily determine which applications are facing resource constraints—and which applications are using more resources than expected.
For example, we received an alert notification that hosts in a certain region are running low on memory, and another notification that instances of our web application in that region have begun returning 5xx messages to clients. It seems like the two issues are connected, but with multiple applications running on the low-memory hosts, we need more information to investigate.
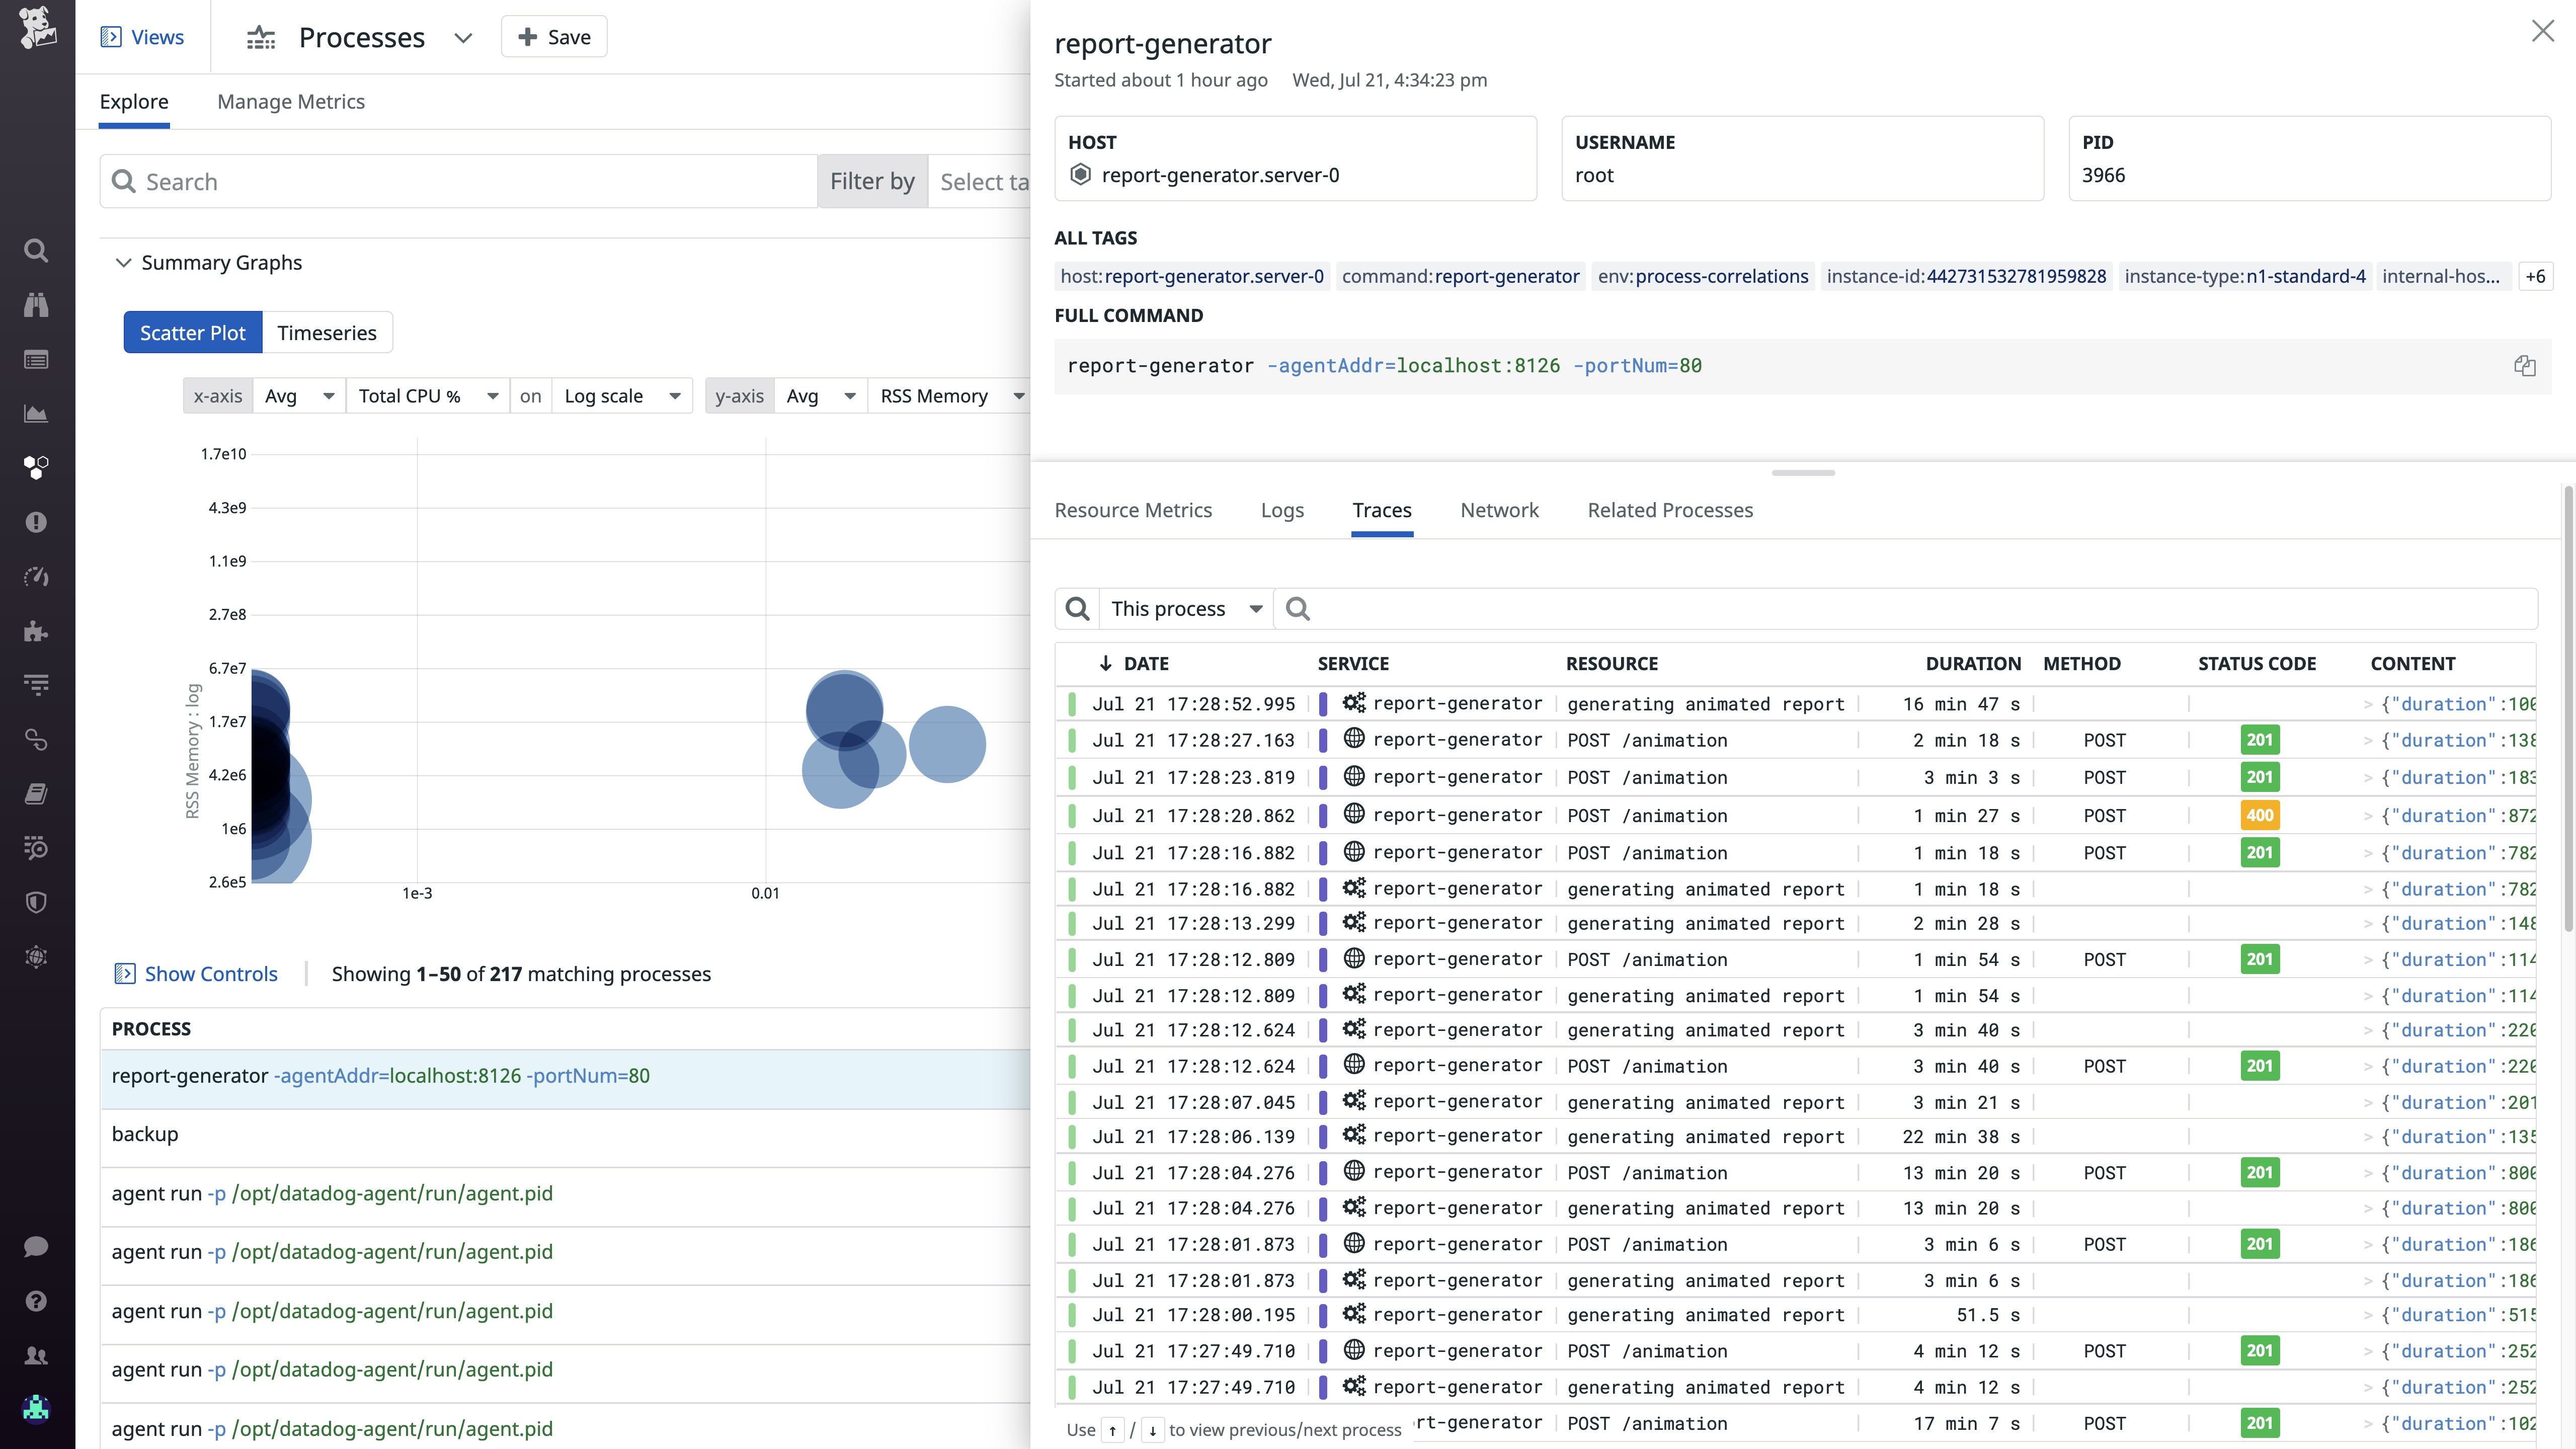
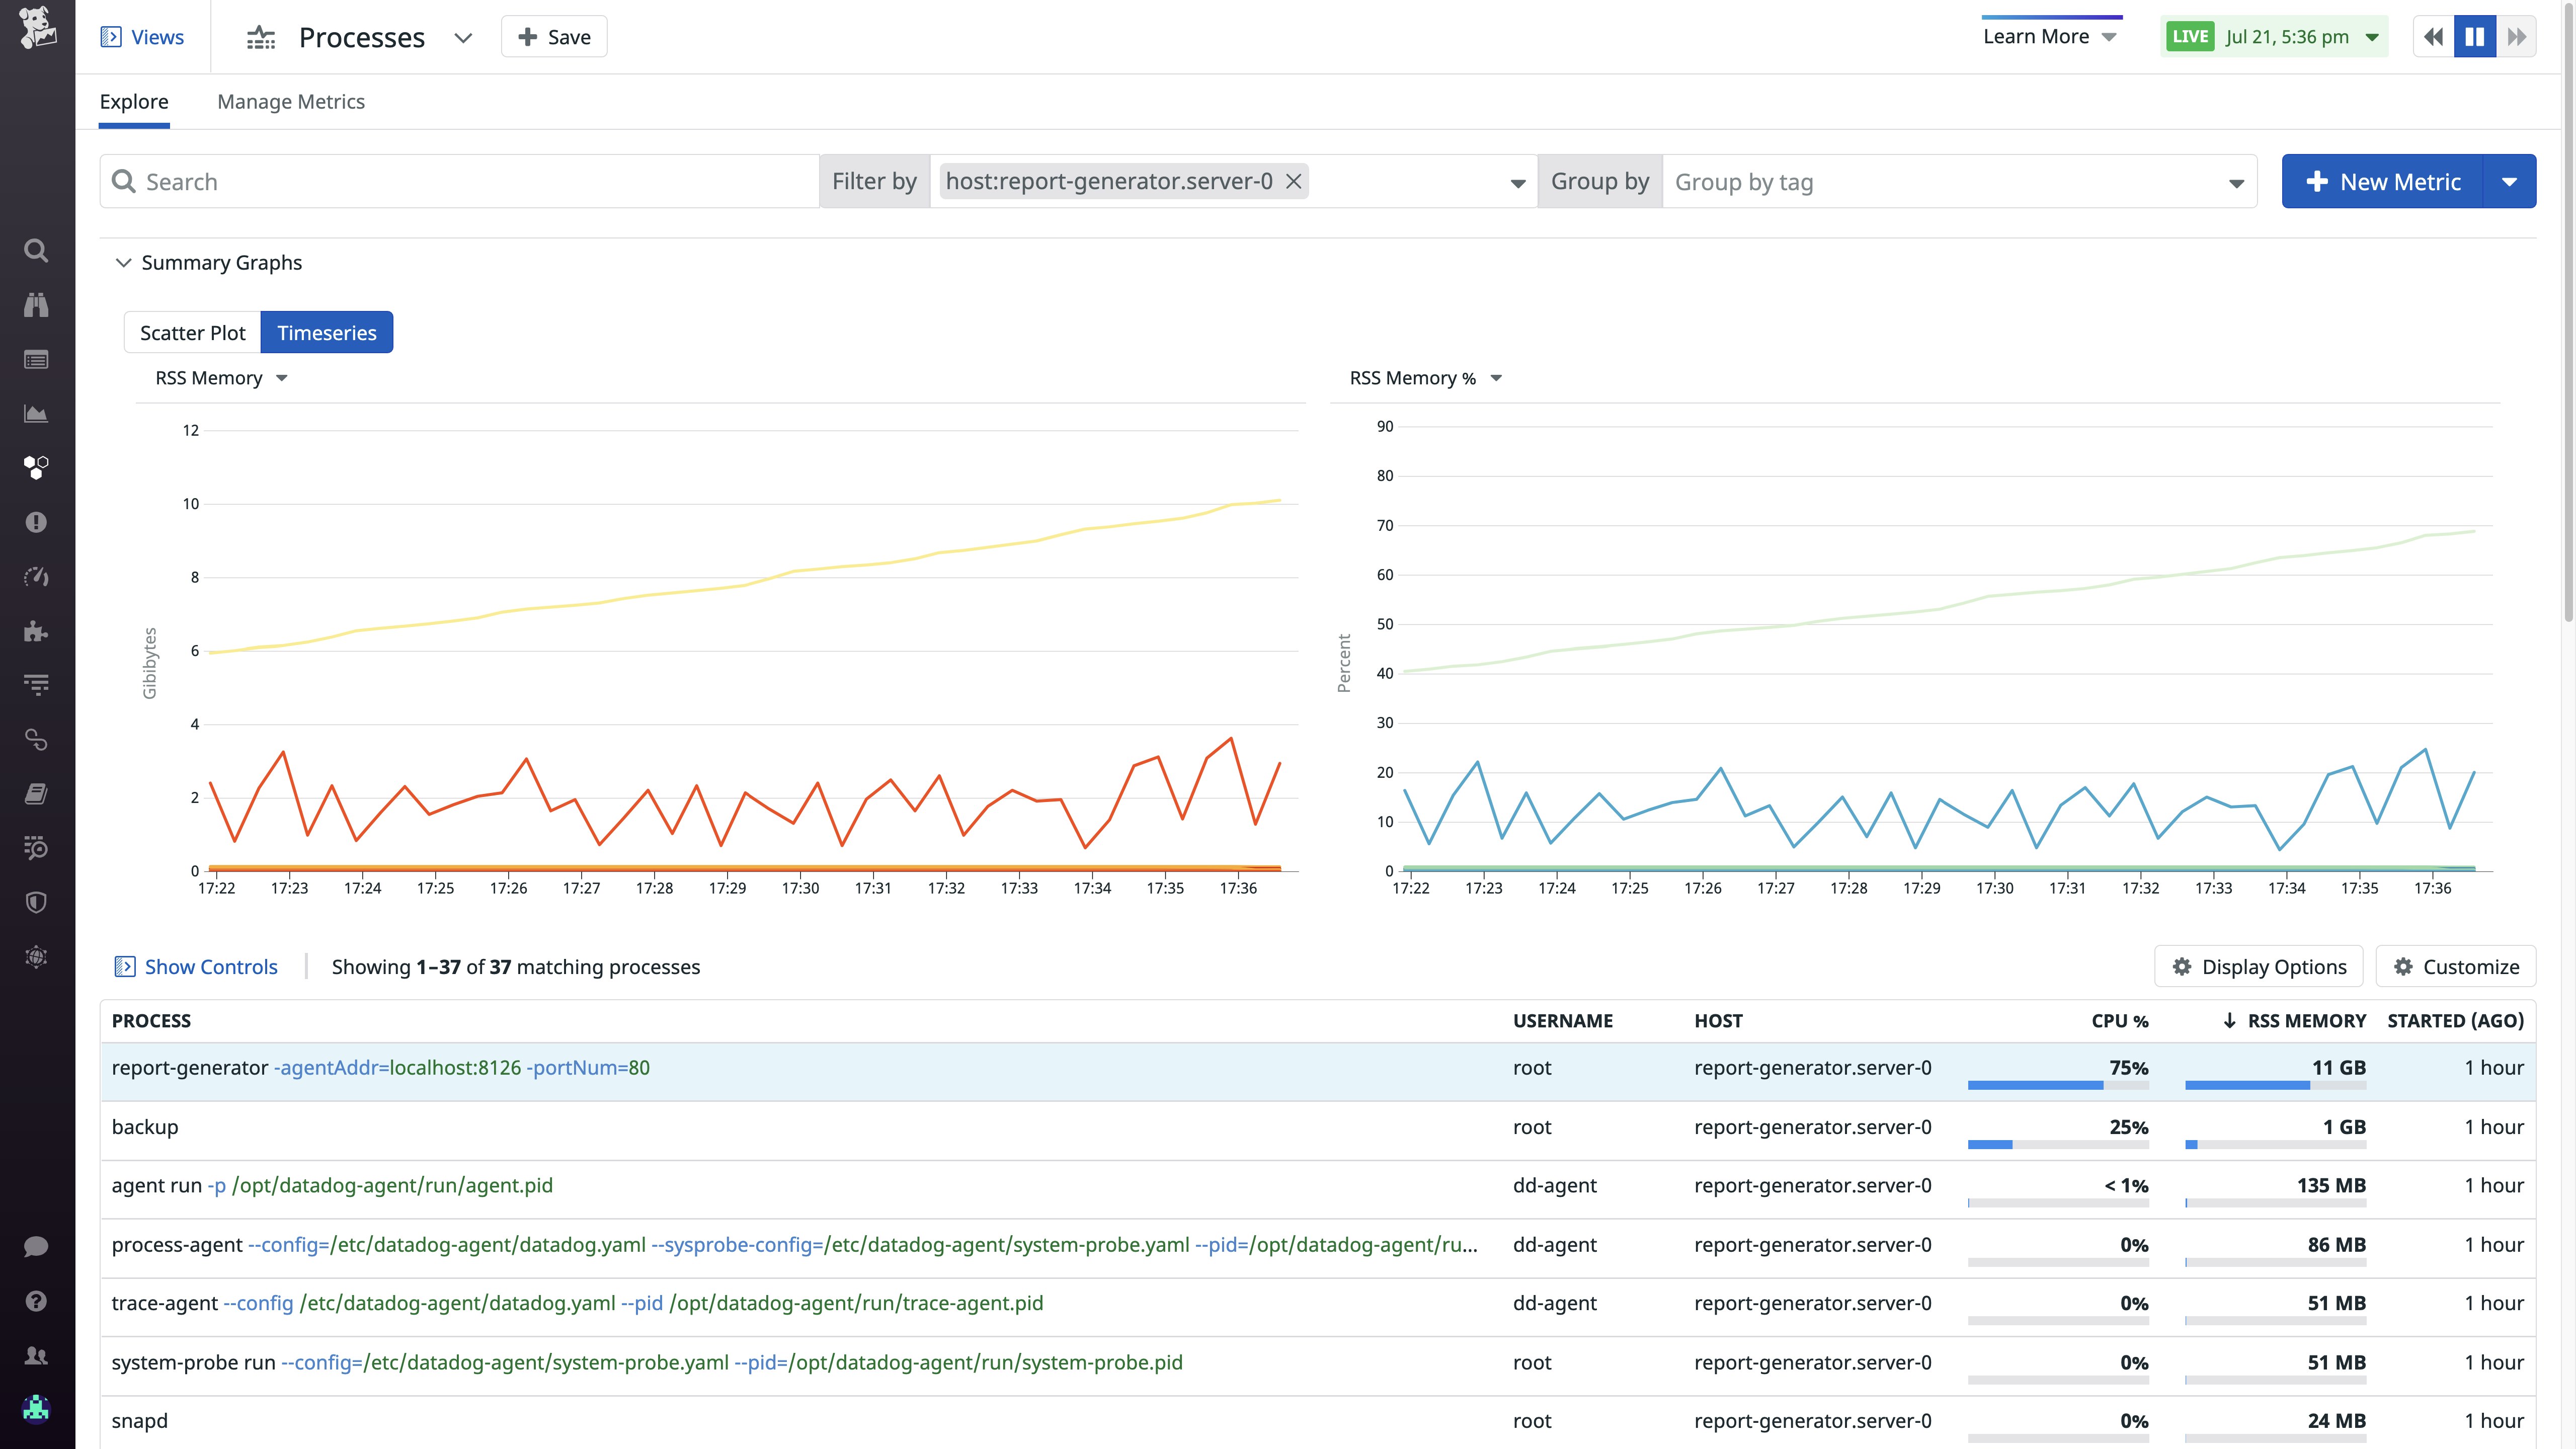
With the Live Processes view, we can see that web application processes on these hosts are consuming unusually high levels of memory. After we inspect one of these processes and view the traces it generates, it becomes clear that the process has been executing code in a rarely called path—one that handles complex queries by pulling a large amount of data from multiple storage clusters and buffering the results in memory for analysis.

We can also see that a data backup job is running on the affected hosts, consuming high levels of memory as it reads from local storage.

From there, we view logs for applications on the problematic host, and notice a high number of "out of memory" errors thrown by the application runtime. Now that we know about this rare but serious failure mode, we can update our application runbook, write API tests with request payloads designed to reproduce the incident, and figure out how to prevent similar issues in the future. We can also create a Live Process monitor so we can respond more quickly if the web application is using more memory than it should be.
Get to the root of network issues
Resource saturation on a host can affect a process's ability to handle network communication with upstream and downstream services, causing services or even entire applications to lose availability. If a process struggles to access the CPU long enough to read data from a socket, you'll see high network latency and frequent retransmits. Alternatively, a process that opens a lot of TCP connections will also show elevated CPU utilization and a high number of open file descriptors, which can cause resource contention with other processes on the host.
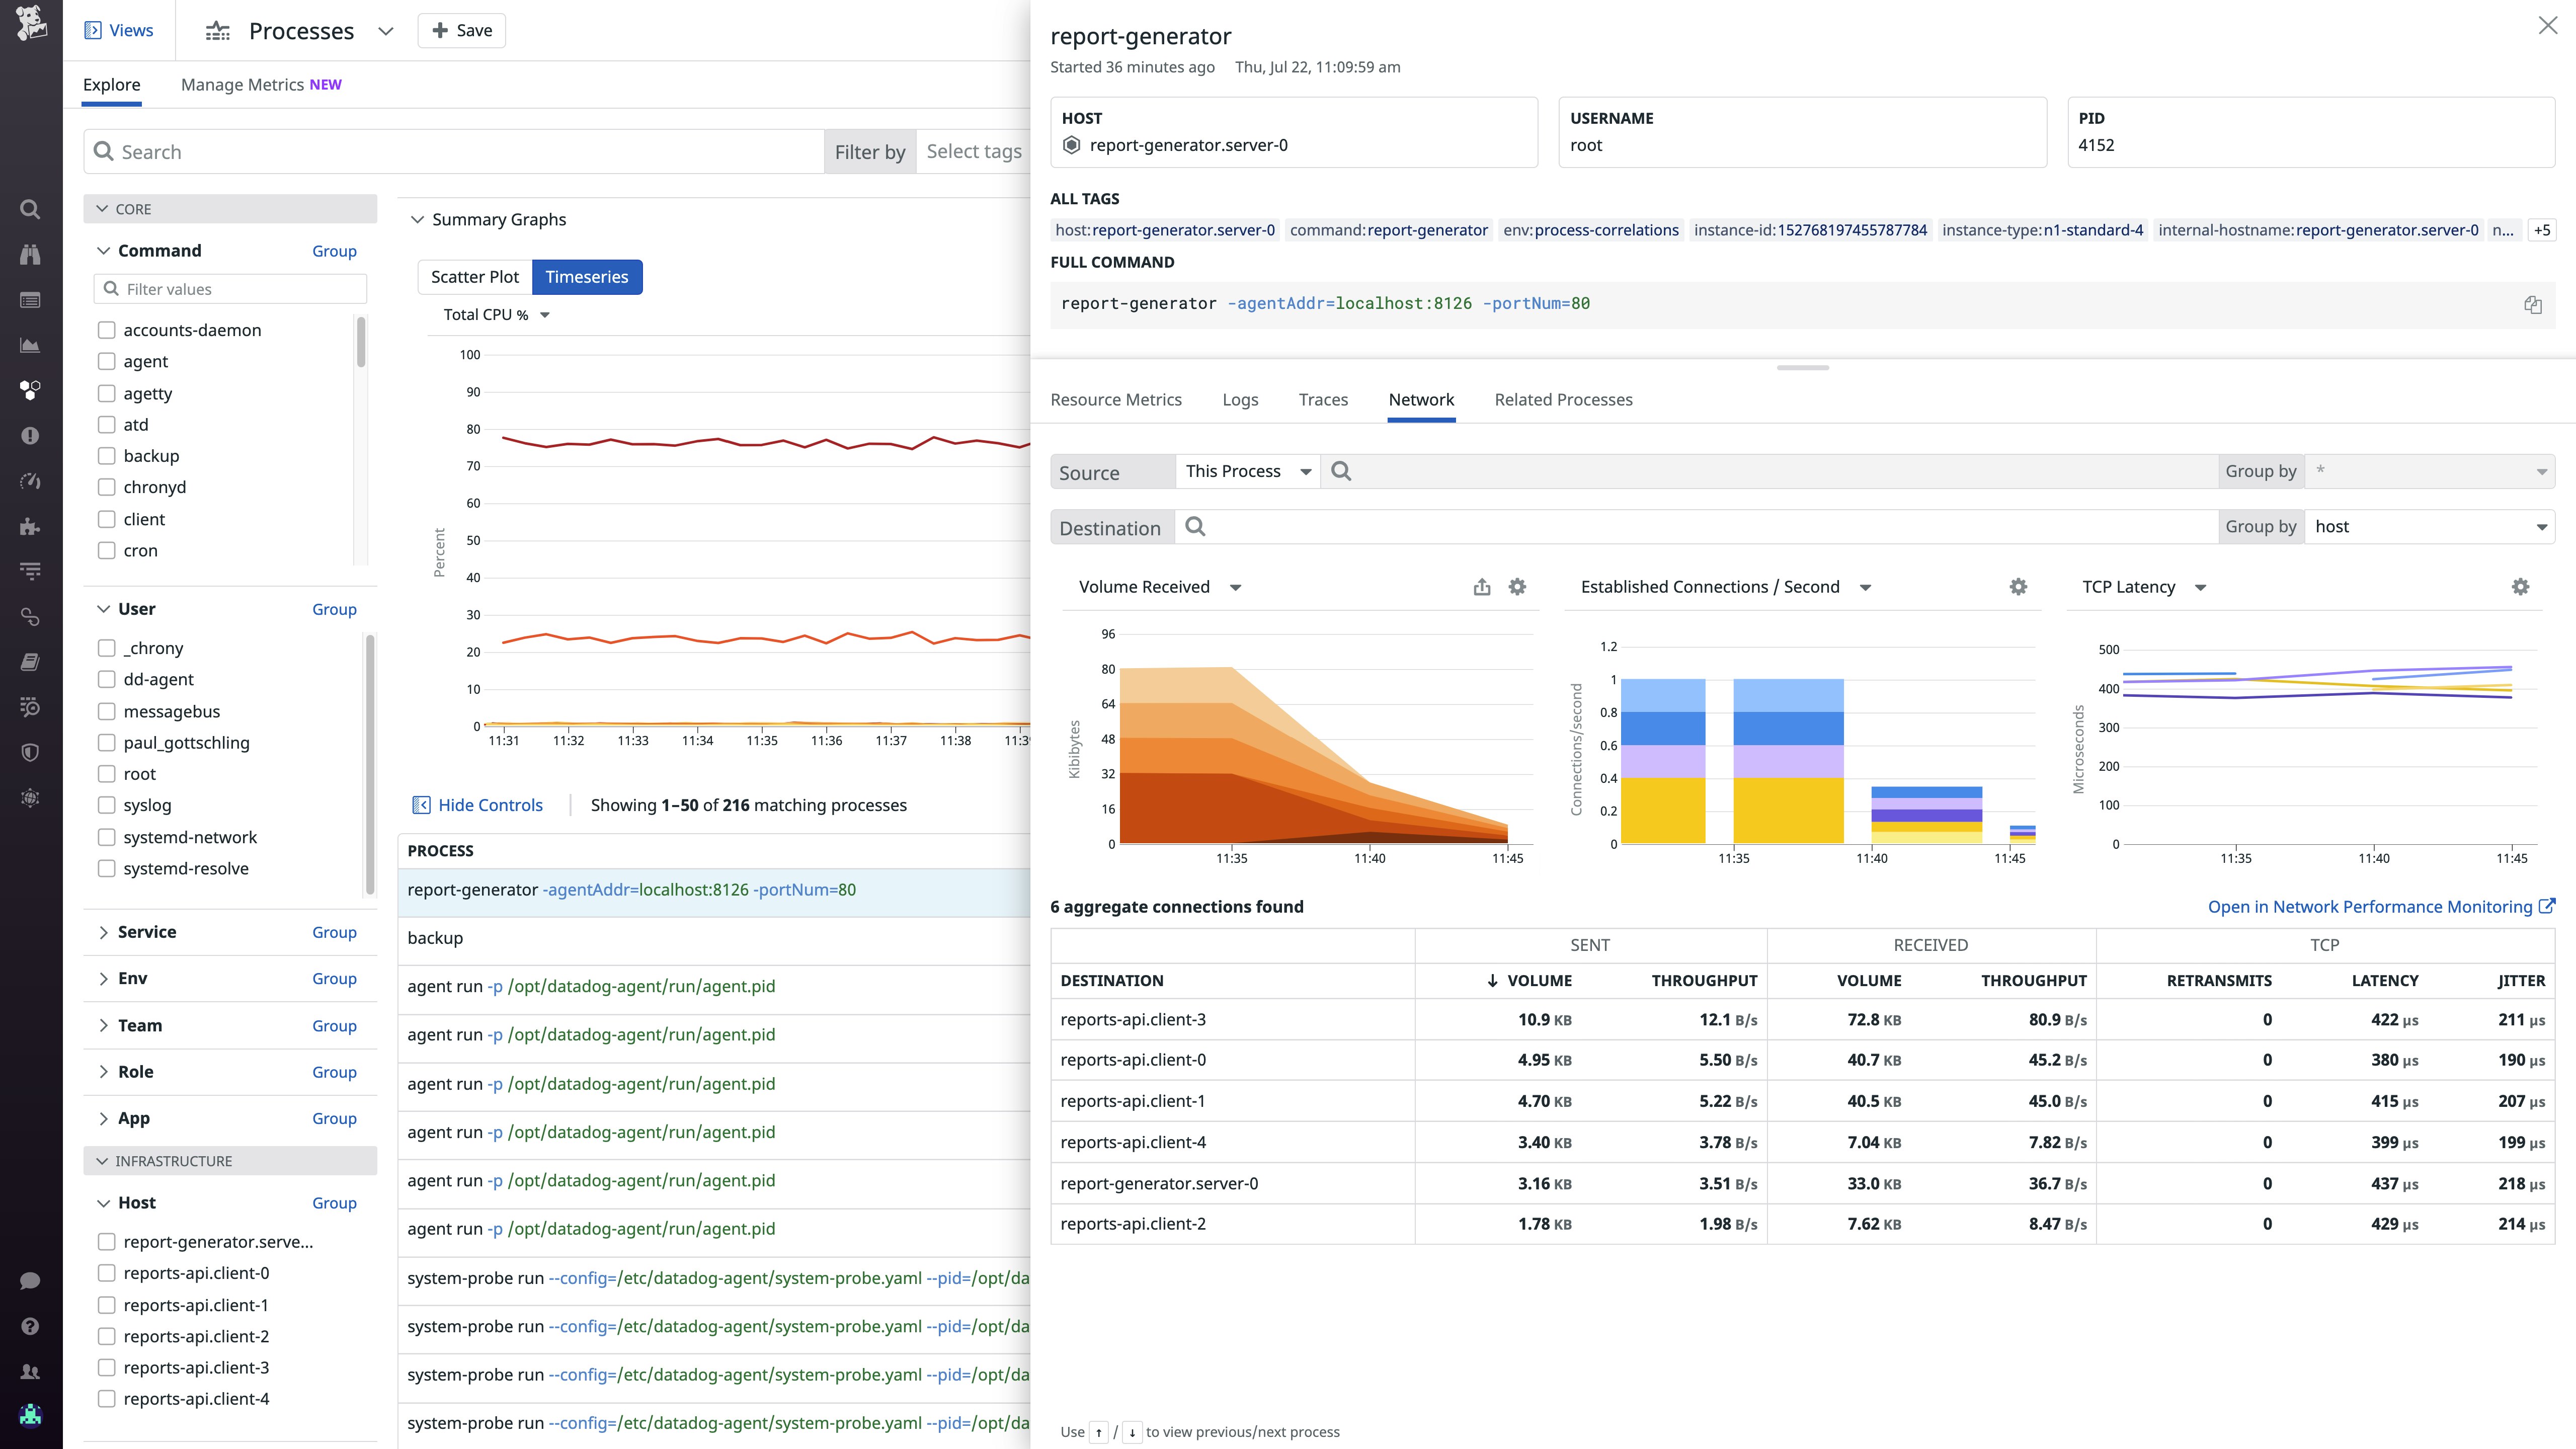
Datadog correlates each process with the Network Performance Monitoring telemetry it generates, so you can pinpoint the workloads responsible for network-level issues like high TCP latency, retransmits, or drops in network volume. In the Live Processes view, you can check whether a process with higher-than-normal RSS memory consumption, CPU utilization, open files, or other resource metrics is also responsible for issues in your network.

If you notice a problematic aggregate connection associated with one process in the "Network" tab of the Live Processes view, you can easily select it to pivot to the Network Page. There, you can see if other aggregate connections with the same destination are also showing signs of an issue, indicating that the destination endpoint is struggling to handle traffic. If the issue is restricted to a single aggregate connection, it is probably the result of conditions on the origin host, not the destination endpoint.
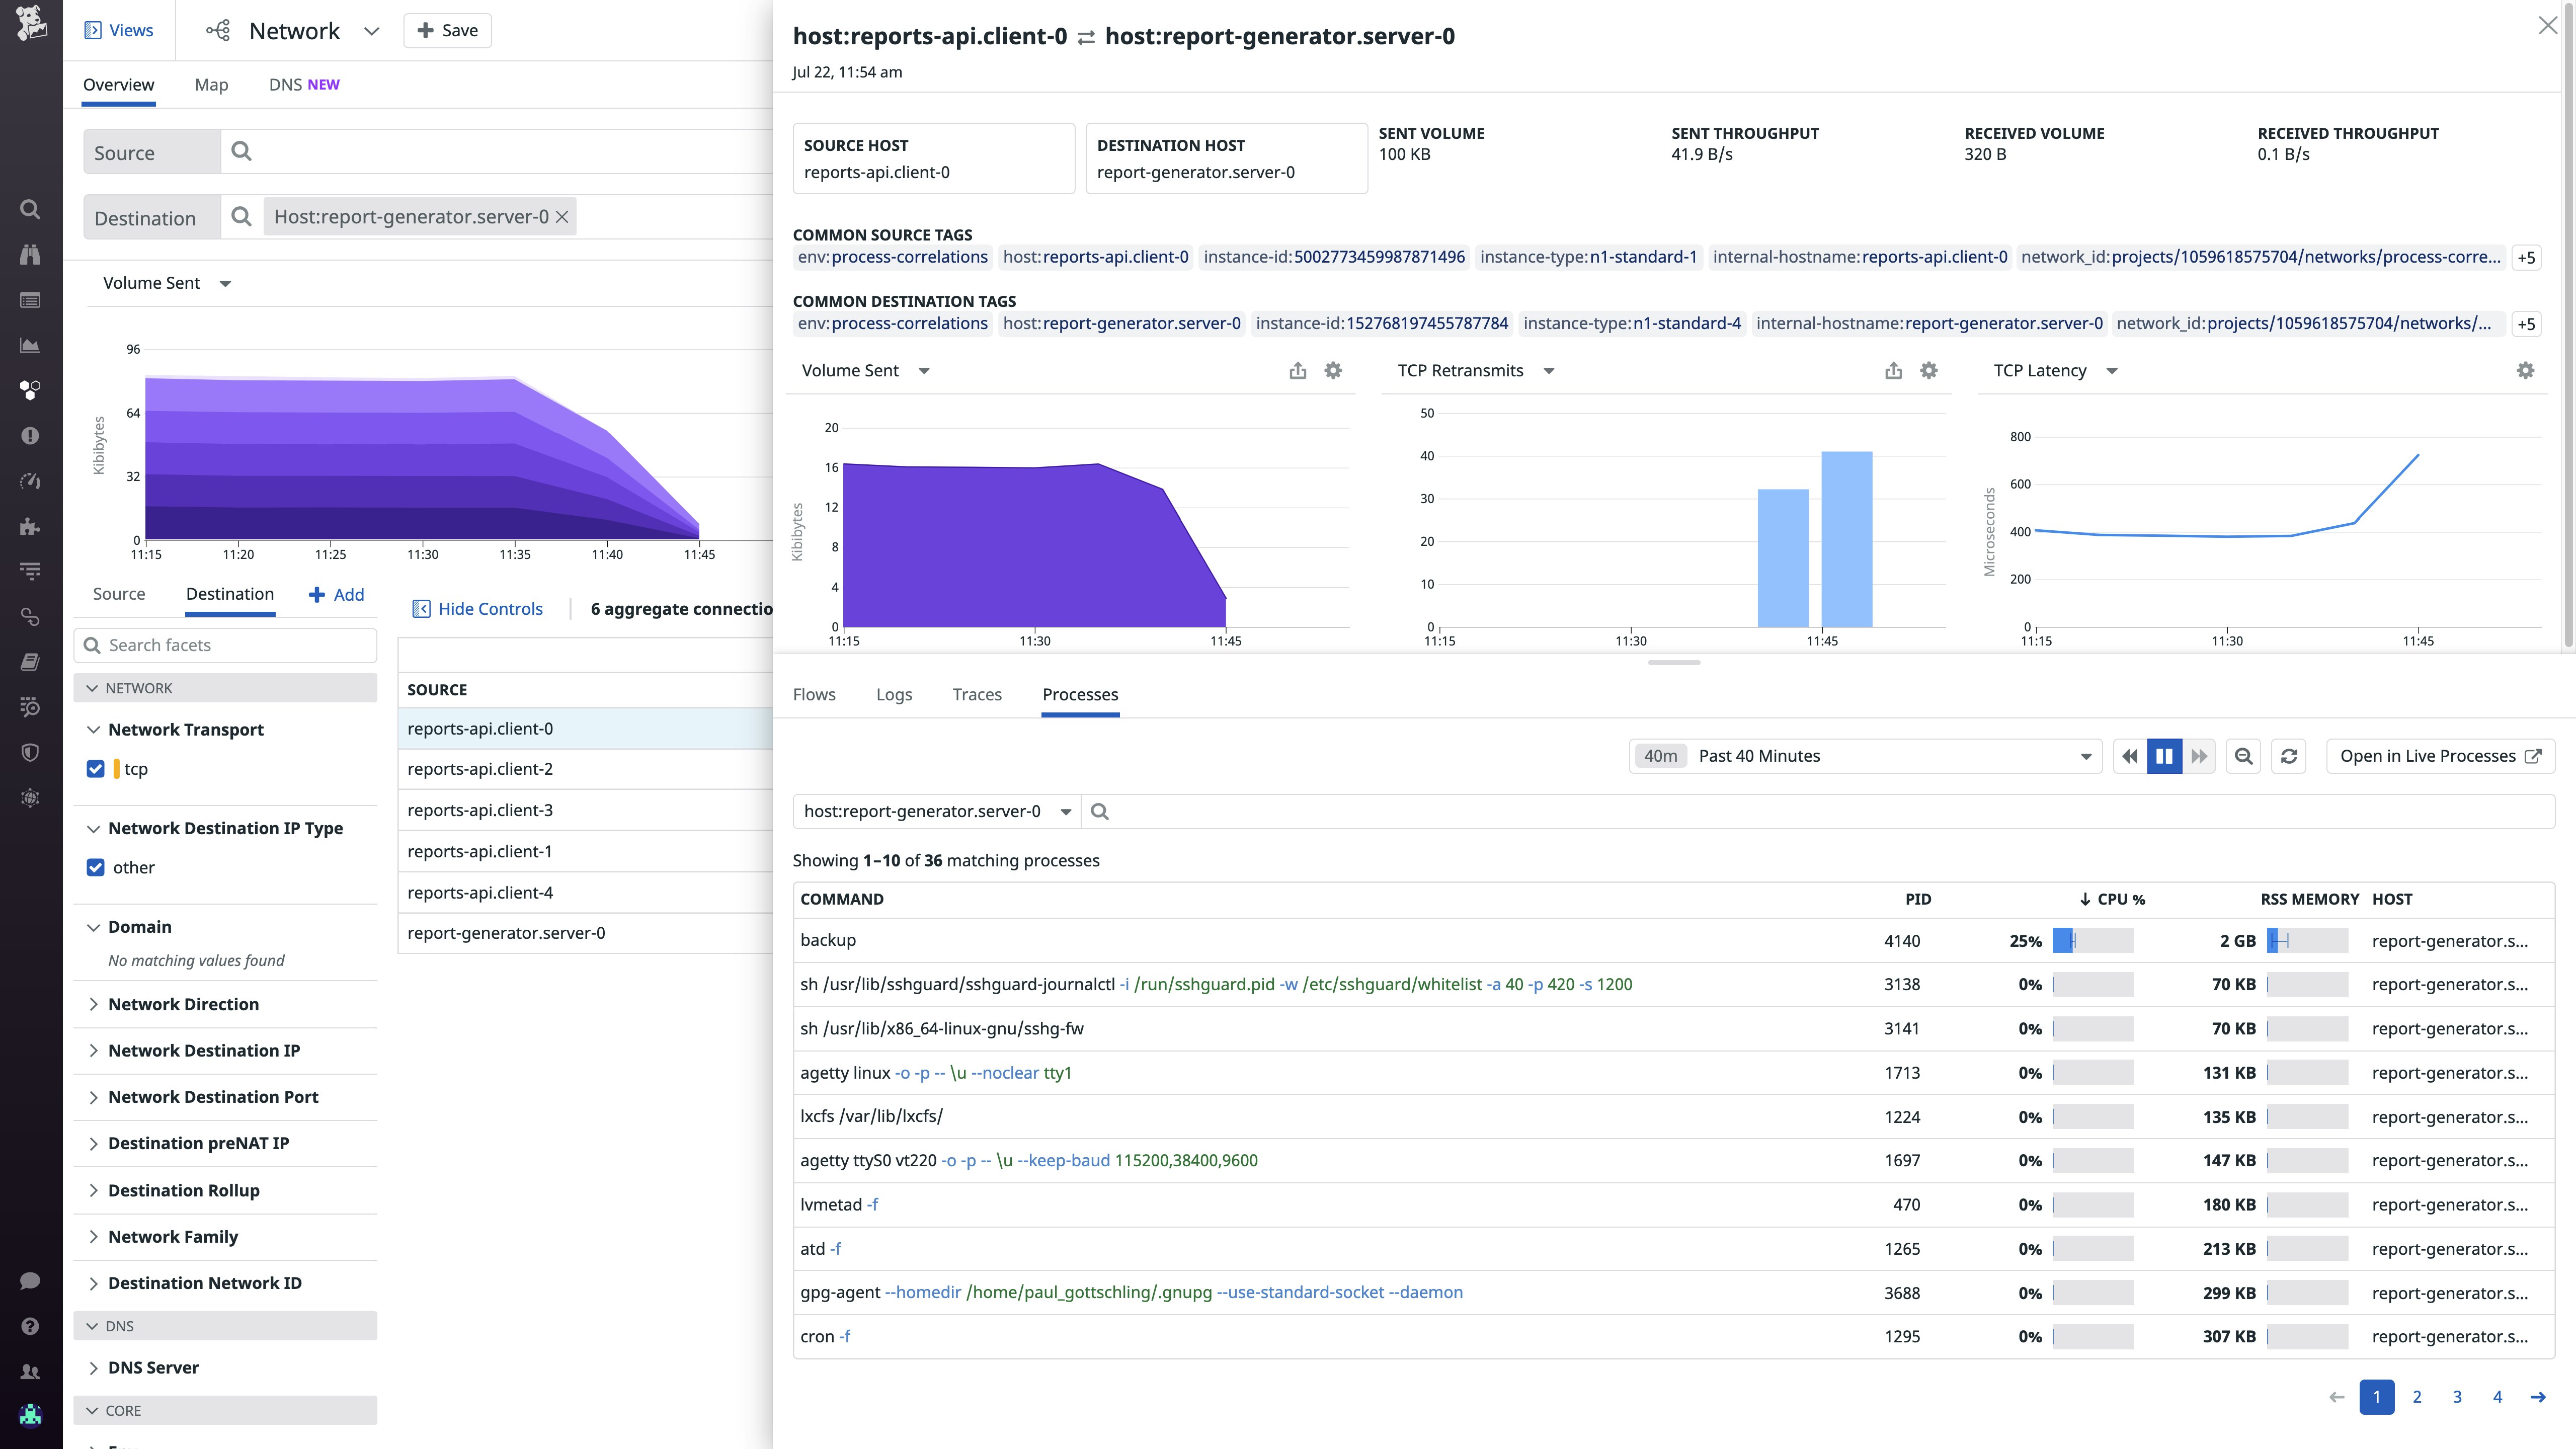
Sometimes workloads fail because an upstream service is rejecting their TCP connection attempts, causing "connection refused" errors on downstream hosts. To see why this is happening, you can inspect an aggregate connection within the Network Page and use the "Processes" tab to show processes running at the destination endpoint.

If a process seems to be using a particularly high share of system resources, or appears to have been terminated, you can pivot back to the Live Processes view, then click the "Related Processes" tab to see all of the other processes running the same command. This will help you narrow down the scope of the issue—e.g., does it affect an off-the-shelf workload like Redis or your own application—so you can understand the extent of customer impact and respond more intelligently.
And if you think the issue has to do with conditions on the host running the process you're investigating, you can easily shift views within the "Related Processes" tab to show all processes running on the same host, and check whether one process's outsize resource consumption is degrading the performance of other processes.
A lot to process
Datadog Live Processes now correlates resource consumption metrics, application request traces, and network performance data by the PID of the process that generated them, so you quickly contextualize application issues by getting visibility into problematic parts of your infrastructure. Live Processes is fully integrated with Network Performance Monitoring, APM, Log Management, and more, so you can get comprehensive visibility into process-level activity with no additional configuration.
To see how Datadog can provide comprehensive views of your infrastructure and applications, sign up for a free trial.


