Barry Eom

Evan Li
The OpenAI Agents SDK is a Python framework for building agentic applications—systems that can make decisions, call tools, validate inputs, and delegate tasks to other agents. It introduces orchestration primitives (fundamental building blocks) like agents, handoffs, and guardrails. The SDK also includes built-in tracing to help developers debug workflows.
As teams adopt this SDK to build more complex AI applications, observability becomes critical: How is your agent making decisions? Which tools did it use? What happened inside each model call? Datadog LLM Observability’s new integration with the OpenAI Agents SDK automatically captures these insights—with no code changes required—so that you can effectively monitor your agents built using OpenAI Agents SDK.
In this post, we’ll walk through how the integration works and how it helps you monitor, troubleshoot, and optimize your OpenAI-powered agents. Specifically, we will cover how to:
- Troubleshoot agent workflows faster with end-to-end tracing
- Track OpenAI usage and agent operational performance
- Evaluate agent outputs for quality and safety
- Get started with Datadog’s new integration with the OpenAI Agents SDK
Troubleshoot agent workflows faster with end-to-end tracing
Agent workflows often involve many moving parts. The agent reasons about a task, calls tools, interprets results, and possibly hands off control to another agent. Each of these steps can fail. They can also succeed in misleading ways.
Datadog hooks into the OpenAI Agents SDK’s built-in tracing system to automatically capture key steps in each agent run, including:
- Agent invocations
- Tool (function) calls
- Model generations
- Guardrail validations
- LLM responses
- Handoff events
- Custom spans (if defined)
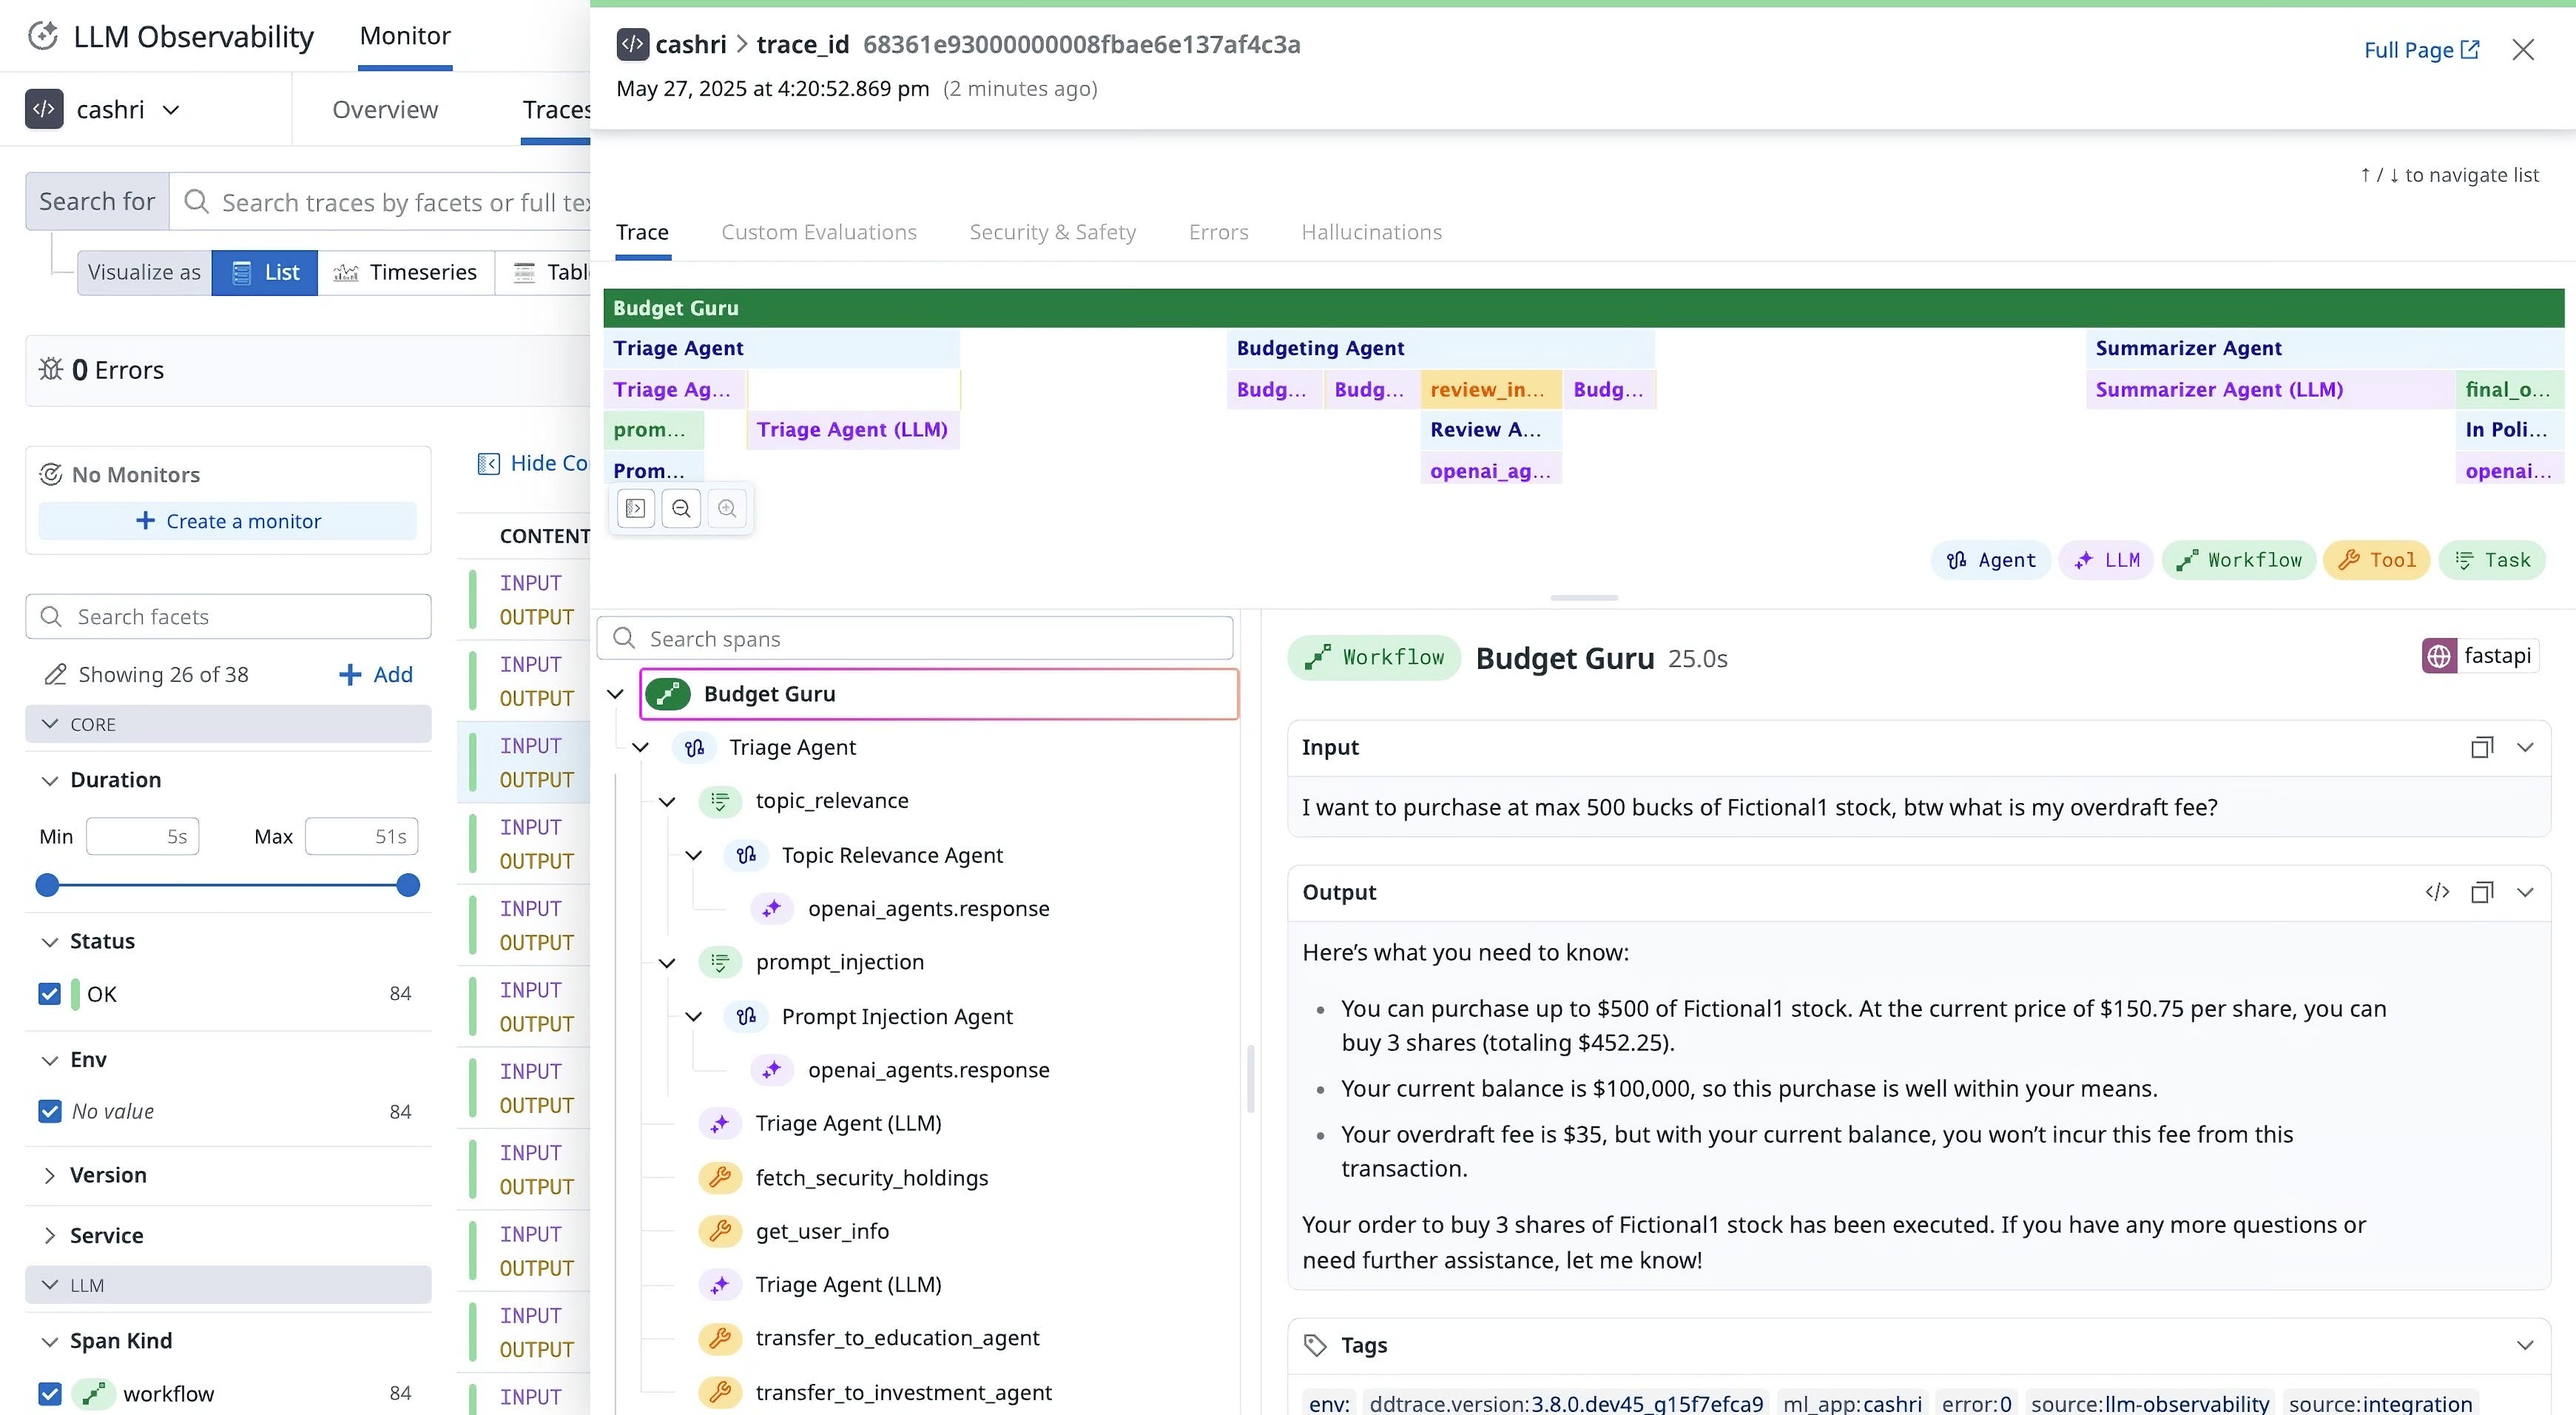
As soon as tracing is enabled, Datadog captures spans for each operation with input/output metadata, timing, and error context. You can drill into a trace to see how your agent has chosen a tool, what the tool returned, which prompts it has sent to OpenAI, and how the model replied—all in one view.

Beyond troubleshooting hard errors, tracing is especially useful for diagnosing soft failures—cases where the workflow technically succeeds but produces incorrect results, such as:
- The agent choosing the wrong tool
- A tool returning incomplete or unexpected data
- The model hallucinating or misinterpreting instructions
By viewing each step of the agent’s logic side by side with the input and output data, you can quickly isolate where the behavior went off track—and iterate faster.
Track OpenAI usage and agent operational performance
Cost and performance are two of the biggest concerns when building agentic applications at scale. As agents orchestrate more model calls and tool invocations, it is critical to monitor token consumption, latency, and error rates to control spend and ensure responsiveness. Datadog automatically captures operational metrics from your agent runs and OpenAI API calls, including:
- Token usage (prompt, completion, and total)
- Model latency and error rates
- Throttling or rate-limit events
- Invocation counts and response sizes

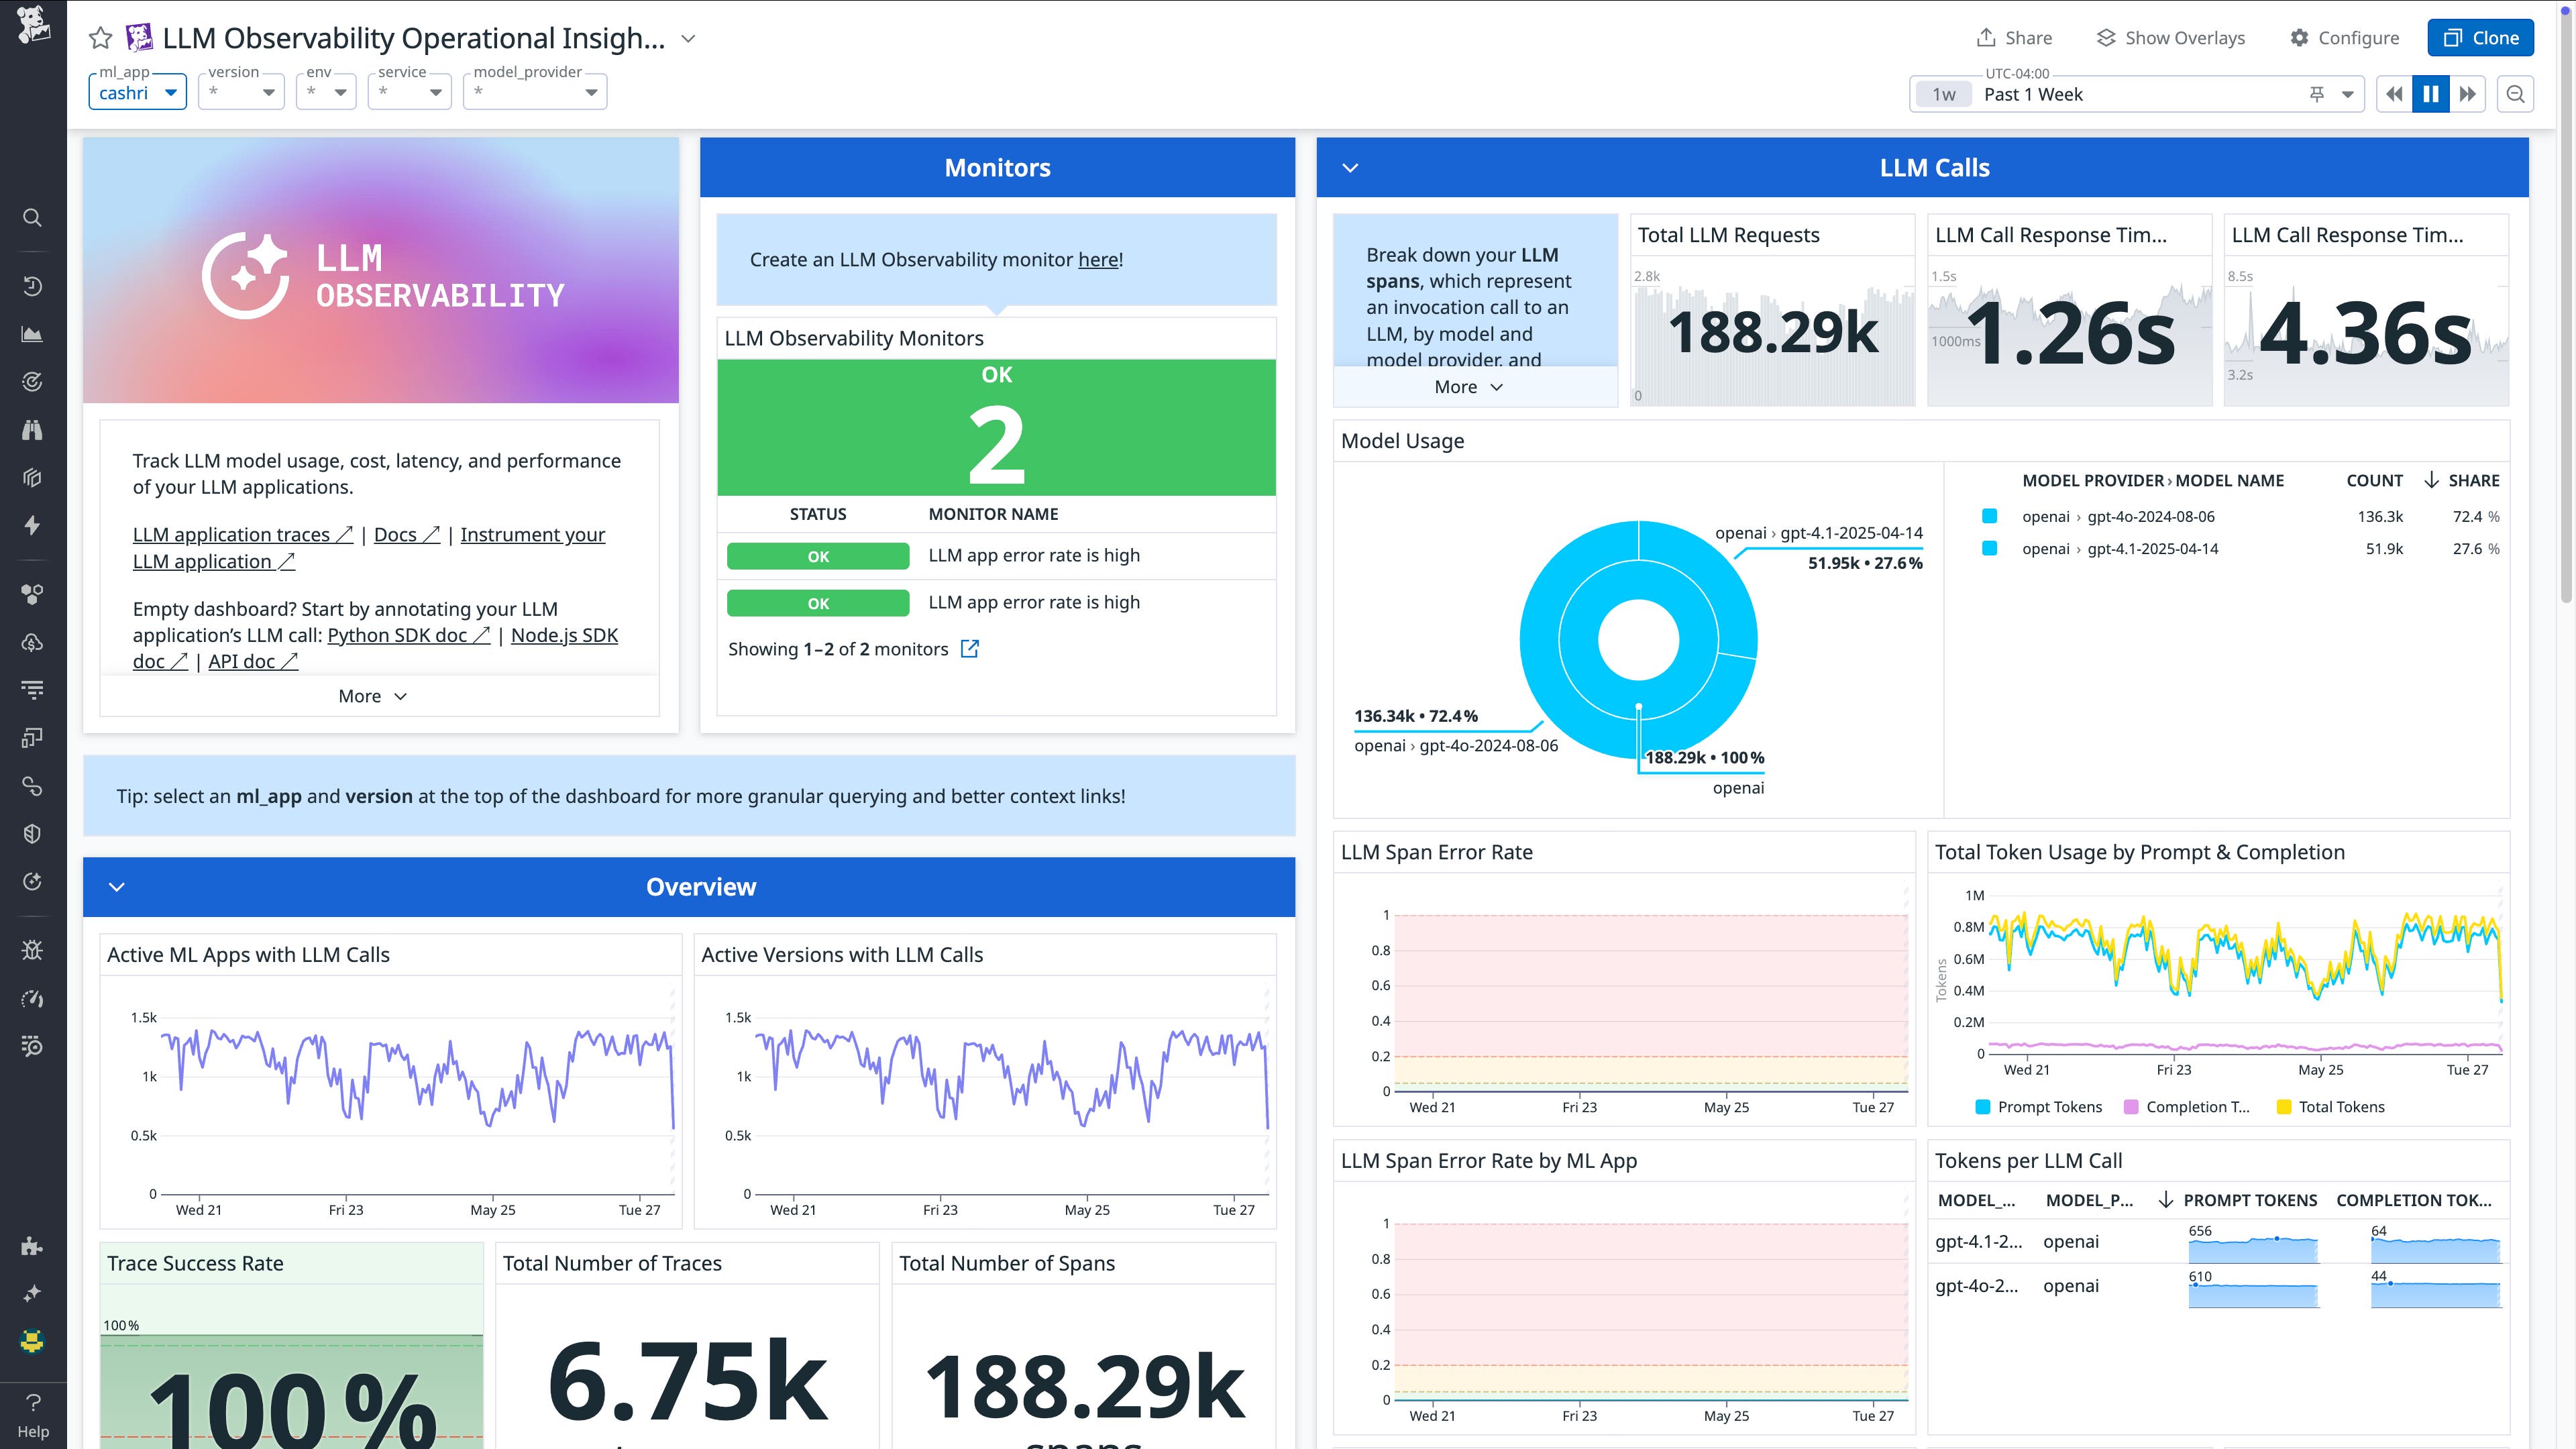
These metrics are captured for each operation, allowing you to analyze and gain clear insight into agent performance in Datadog’s LLM Application Overview Page and the out-of-the-box LLM Observability dashboard. You can set alerts on monthly token usage, track changes in latency, or correlate cost spikes with changes to your prompts or logic.
These metrics offer a real-time view into your agents’ behavior in production, enabling you to monitor latency, track error rates, and spot usage trends before they impact performance or reliability.
Evaluate agent outputs for quality and safety
Datadog helps you evaluate the quality and safety of your agents’ responses. LLM Observability automatically runs checks on model inputs and outputs, such as:
- Failure to answer: Indicates if the agent didn’t return a meaningful response
- Topic relevance: Flags off-topic completions
- Toxicity and sentiment: Highlights negative or potentially harmful content
- Prompt injection detection: Detects if the prompt was manipulated
- Sensitive data redaction: Flags and redacts PII in prompts or responses
These signals appear directly in the trace view, alongside latency, token usage, and error data—so that you can assess not just how the agent behaved, but whether the result has met your quality standards.
You can also submit custom evaluations tailored to your agentic application. These custom evaluations can perform assessments on anything ranging from tool selection accuracy, to user feedback ratings, to domain-specific checks and policy violations. Custom evaluations are reported alongside built-in checks in Datadog, giving you a consolidated view of agent performance, correctness, and safety.
Get started with Datadog’s new integration with the OpenAI Agents SDK
Monitoring your OpenAI agents with Datadog takes just a few steps:
- Upgrade to the latest ddtrace SDK (v3.5.0 or later):
pip install ddtrace>=3.9.0
- Enable LLM Observability for the OpenAI Agents SDK:
export DD_LLMOBS_ENABLED=true
- Run your agent application.
No code changes are required to begin monitoring your OpenAI agents. For more details or customization options, see the setup documentation.
Monitor your agentic applications with confidence
OpenAI’s Agents SDK provides a powerful abstraction for building multi-step, tool-using, decision-making agents. But without observability, debugging them is slow, and the operational risk associated with using them is high.
With Datadog’s native integration, you can monitor OpenAI usage, trace every agent action, and evaluate outputs for quality and safety—all with minimal setup and no manual code changes.
The integration is available today as part of Datadog LLM Observability for all customers. Try it out and start gaining deeper insights into your AI agents today. For more information, consult Datadog’s LLM Observability documentation. And if you’re not yet a Datadog customer, sign up for a 14-day free trial to get started.


