Vera Chan

Ellie Cohen

Shreya Batra

Oren Margalit
Oracle Cloud Infrastructure (OCI) provides compute, storage, networking, and database services for running enterprise applications and workloads in Oracle. OCI supports both traditional and cloud-native applications, offering scalable, secure, and high-performance infrastructure for hybrid and multi-cloud environments. Securing workloads in OCI can be complex for organizations managing a mix of on-prem, hybrid, and cloud environments. To detect threats effectively, security teams need visibility into the activities recorded in OCI Audit Logs, including authentication attempts, API calls, and changes to infrastructure resources. Analyzing this data in real time is critical for spotting anomalies, maintaining compliance, and containing potential incidents before they escalate.
Datadog Cloud SIEM simplifies this process by centralizing OCI Audit Logs alongside security data from across your stack. With prebuilt detection rules, dashboards, and native integrations, teams can quickly surface suspicious activity—such as brute force attempts, anomalous resource creation, or password resets from malicious IPs—while also correlating these events with signals from the rest of their enterprise environment.
In this post, we’ll explore how the OCI integration and OCI Content Pack help your team accelerate onboarding, prioritize investigations, and respond confidently to threats.
Centralize OCI Audit Logs for threat detection
With Datadog Log Management and the OCI integration, organizations can collect, process, and analyze all of their OCI Audit Logs in a single place, giving security teams a unified platform for monitoring and investigation. Organizations can also set up monitoring for their infrastructure and applications in just a few clicks with Datadog’s OCI QuickStart. OCI QuickStart automatically provisions the services needed to collect metrics, logs, and resource data from your OCI tenancy, ensuring comprehensive observability as your cloud environment evolves.
Today, Datadog supports log pipelines for OCI Audit, Kubernetes, Virtual Cloud Network (VCN), Object Storage, and Load Balancer, with more on the way. OCI Audit Logs—covering API calls, user identities, and request details—provide a complete trail of control plane activity. Service-specific and custom logs from resources like Object Storage, Load Balancer, or Compute can add deeper visibility into access attempts, network traffic, and application behavior. By centralizing these signals in Datadog, analysts can quickly identify suspicious patterns such as repeated access denials, unexpected resource creation, or logins from unusual geographies. Alongside Slack and Jira integrations, threat details can be shared or escalated in real time, accelerating investigation and response.
Quickly detect threats with prebuilt detection rules
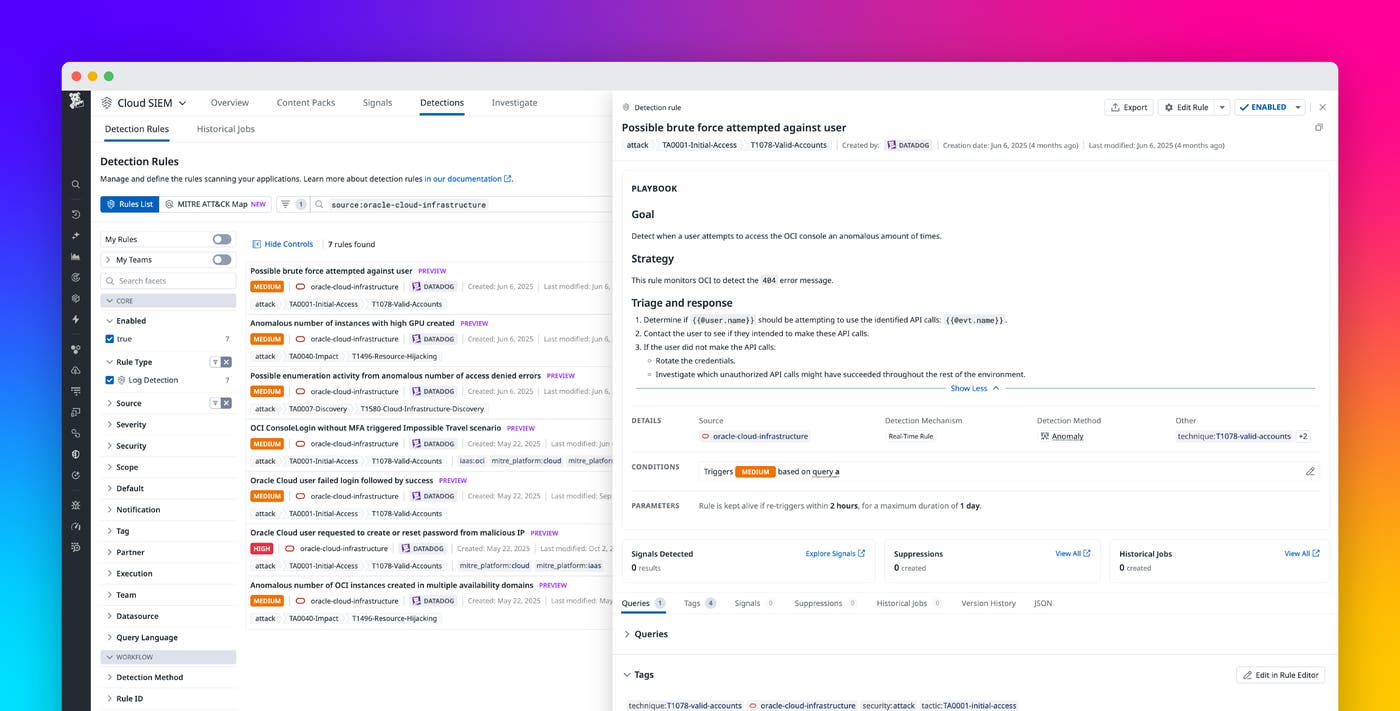
To speed up threat detection in OCI, Datadog offers the new OCI Content Pack for Cloud SIEM, a curated collection of out-of-the-box detection rules and a prebuilt dashboard. This pack enables security teams to quickly onboard and start monitoring their OCI environment without needing to build custom detections from scratch.
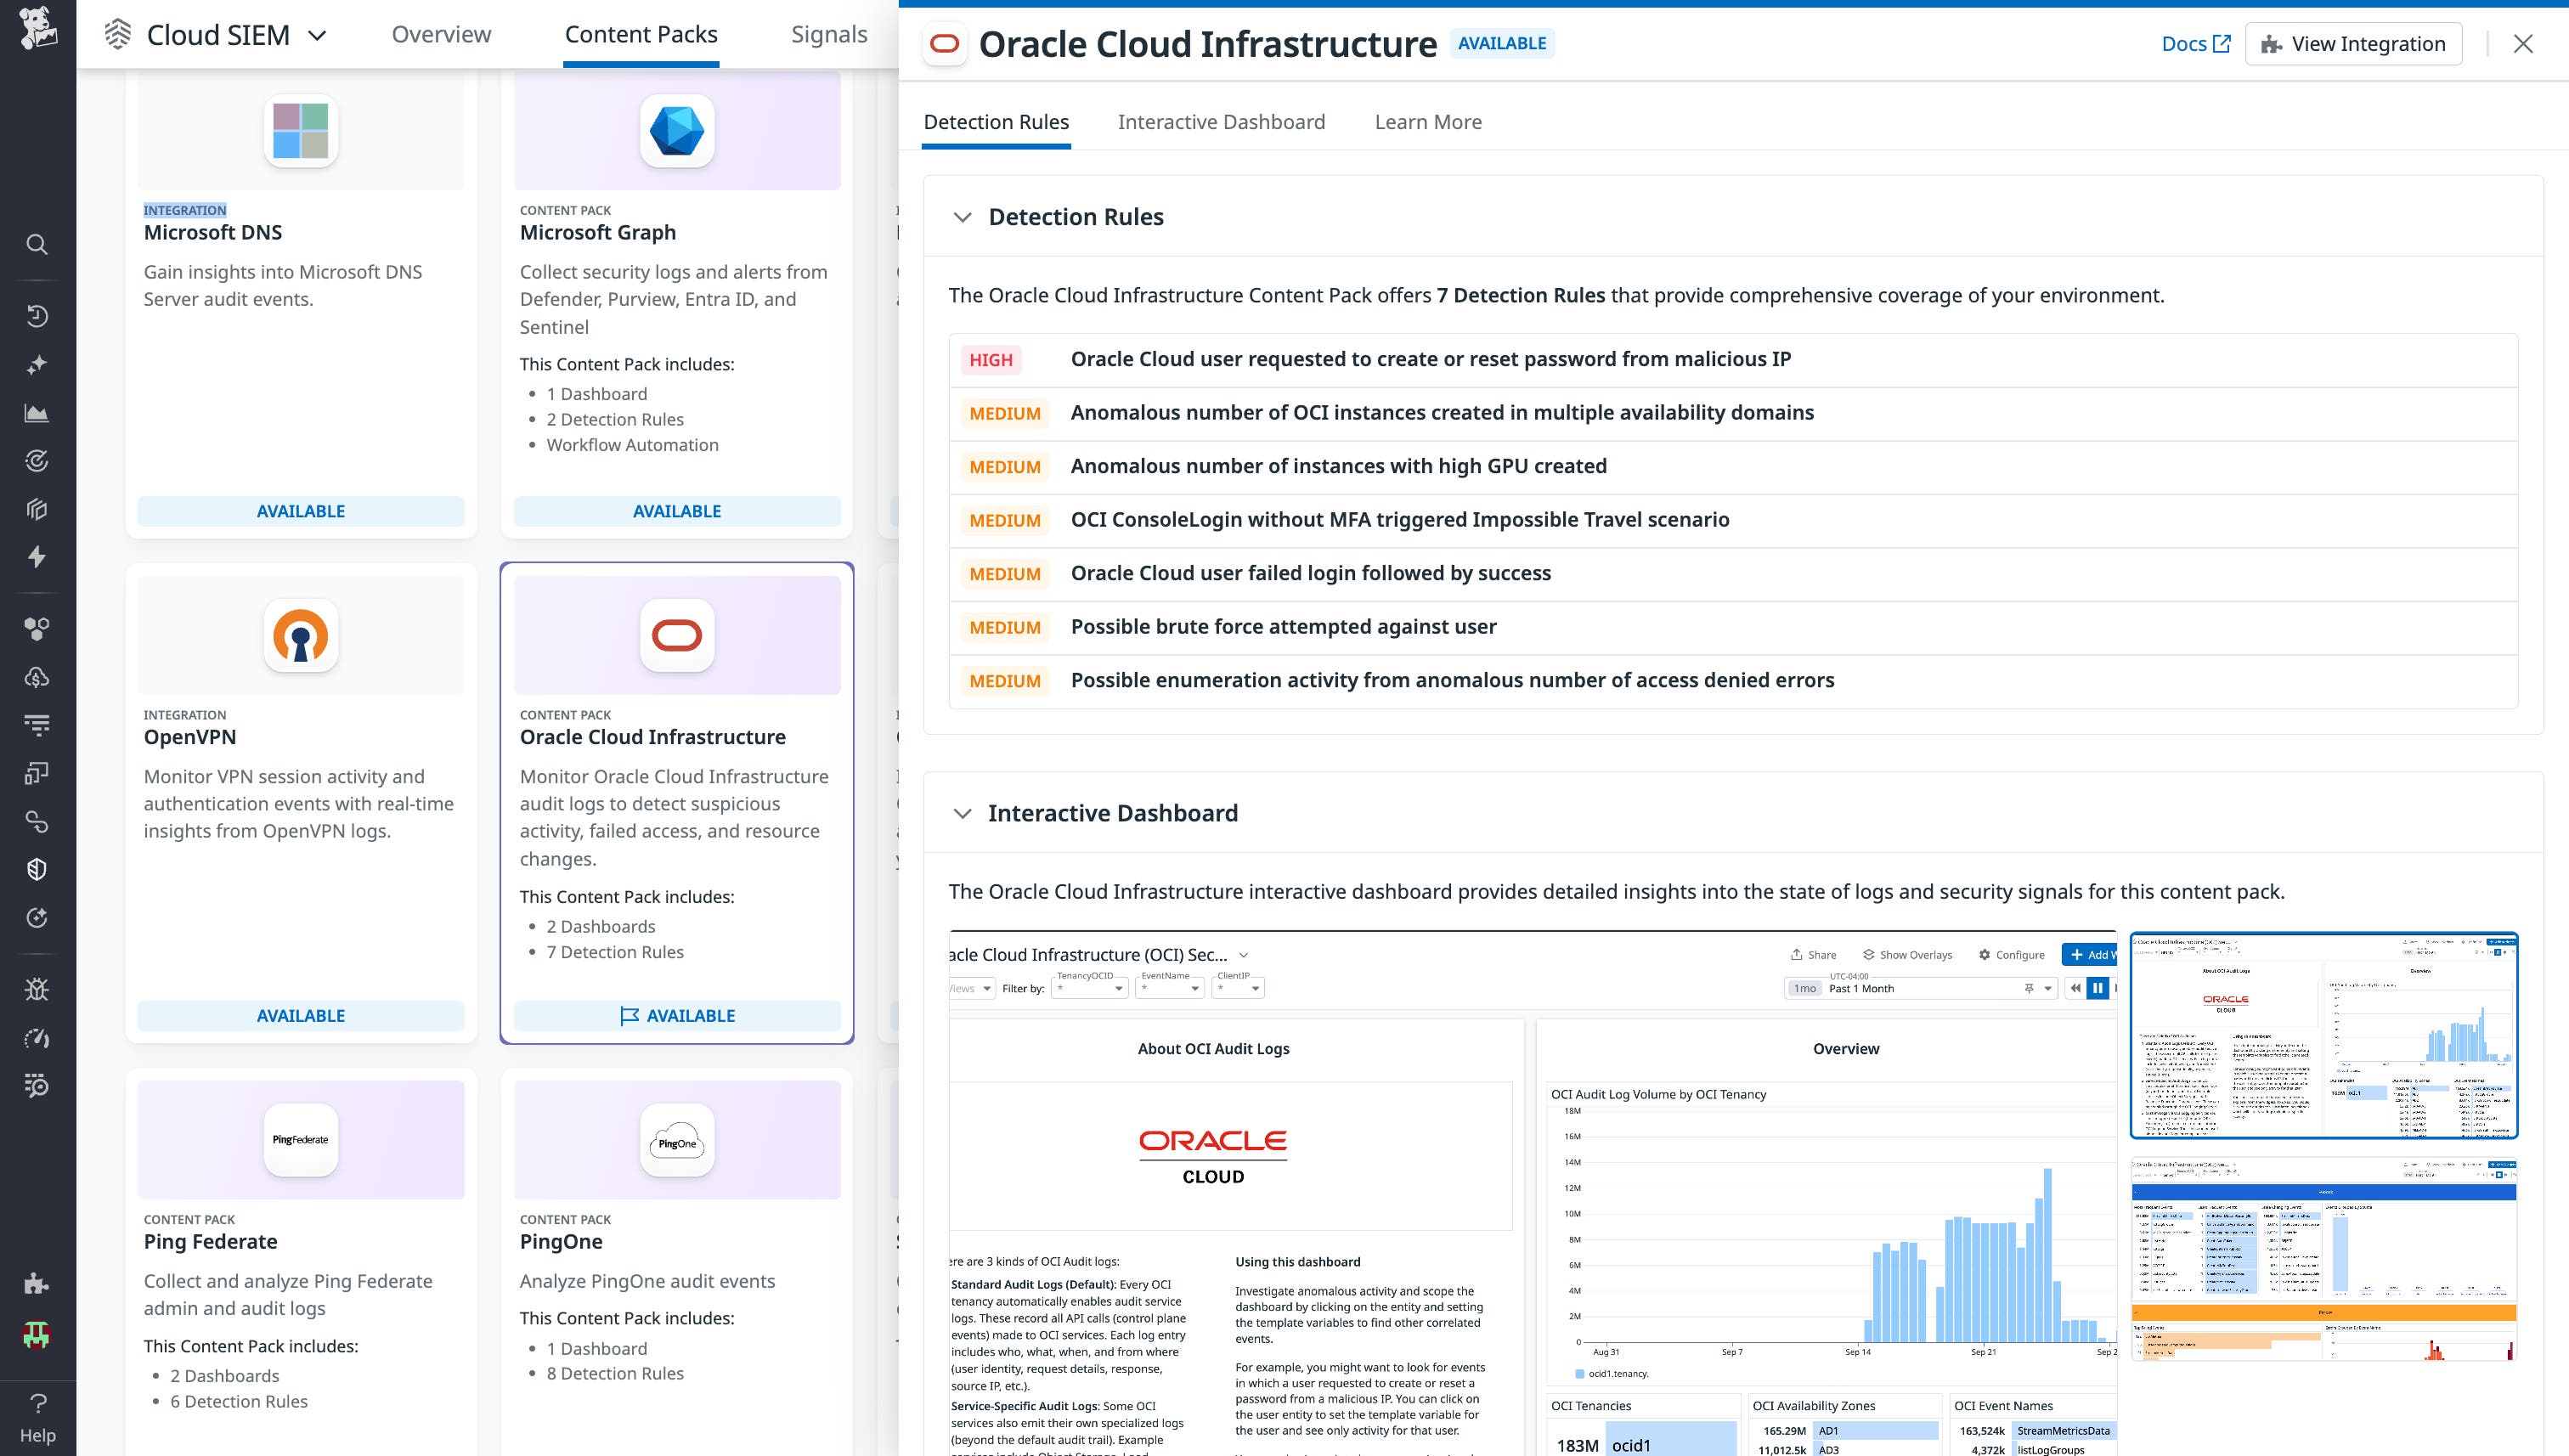
The included detection rules cover a range of potential threats, such as brute force attempts, anomalous resource creation, and unauthorized password reset requests.
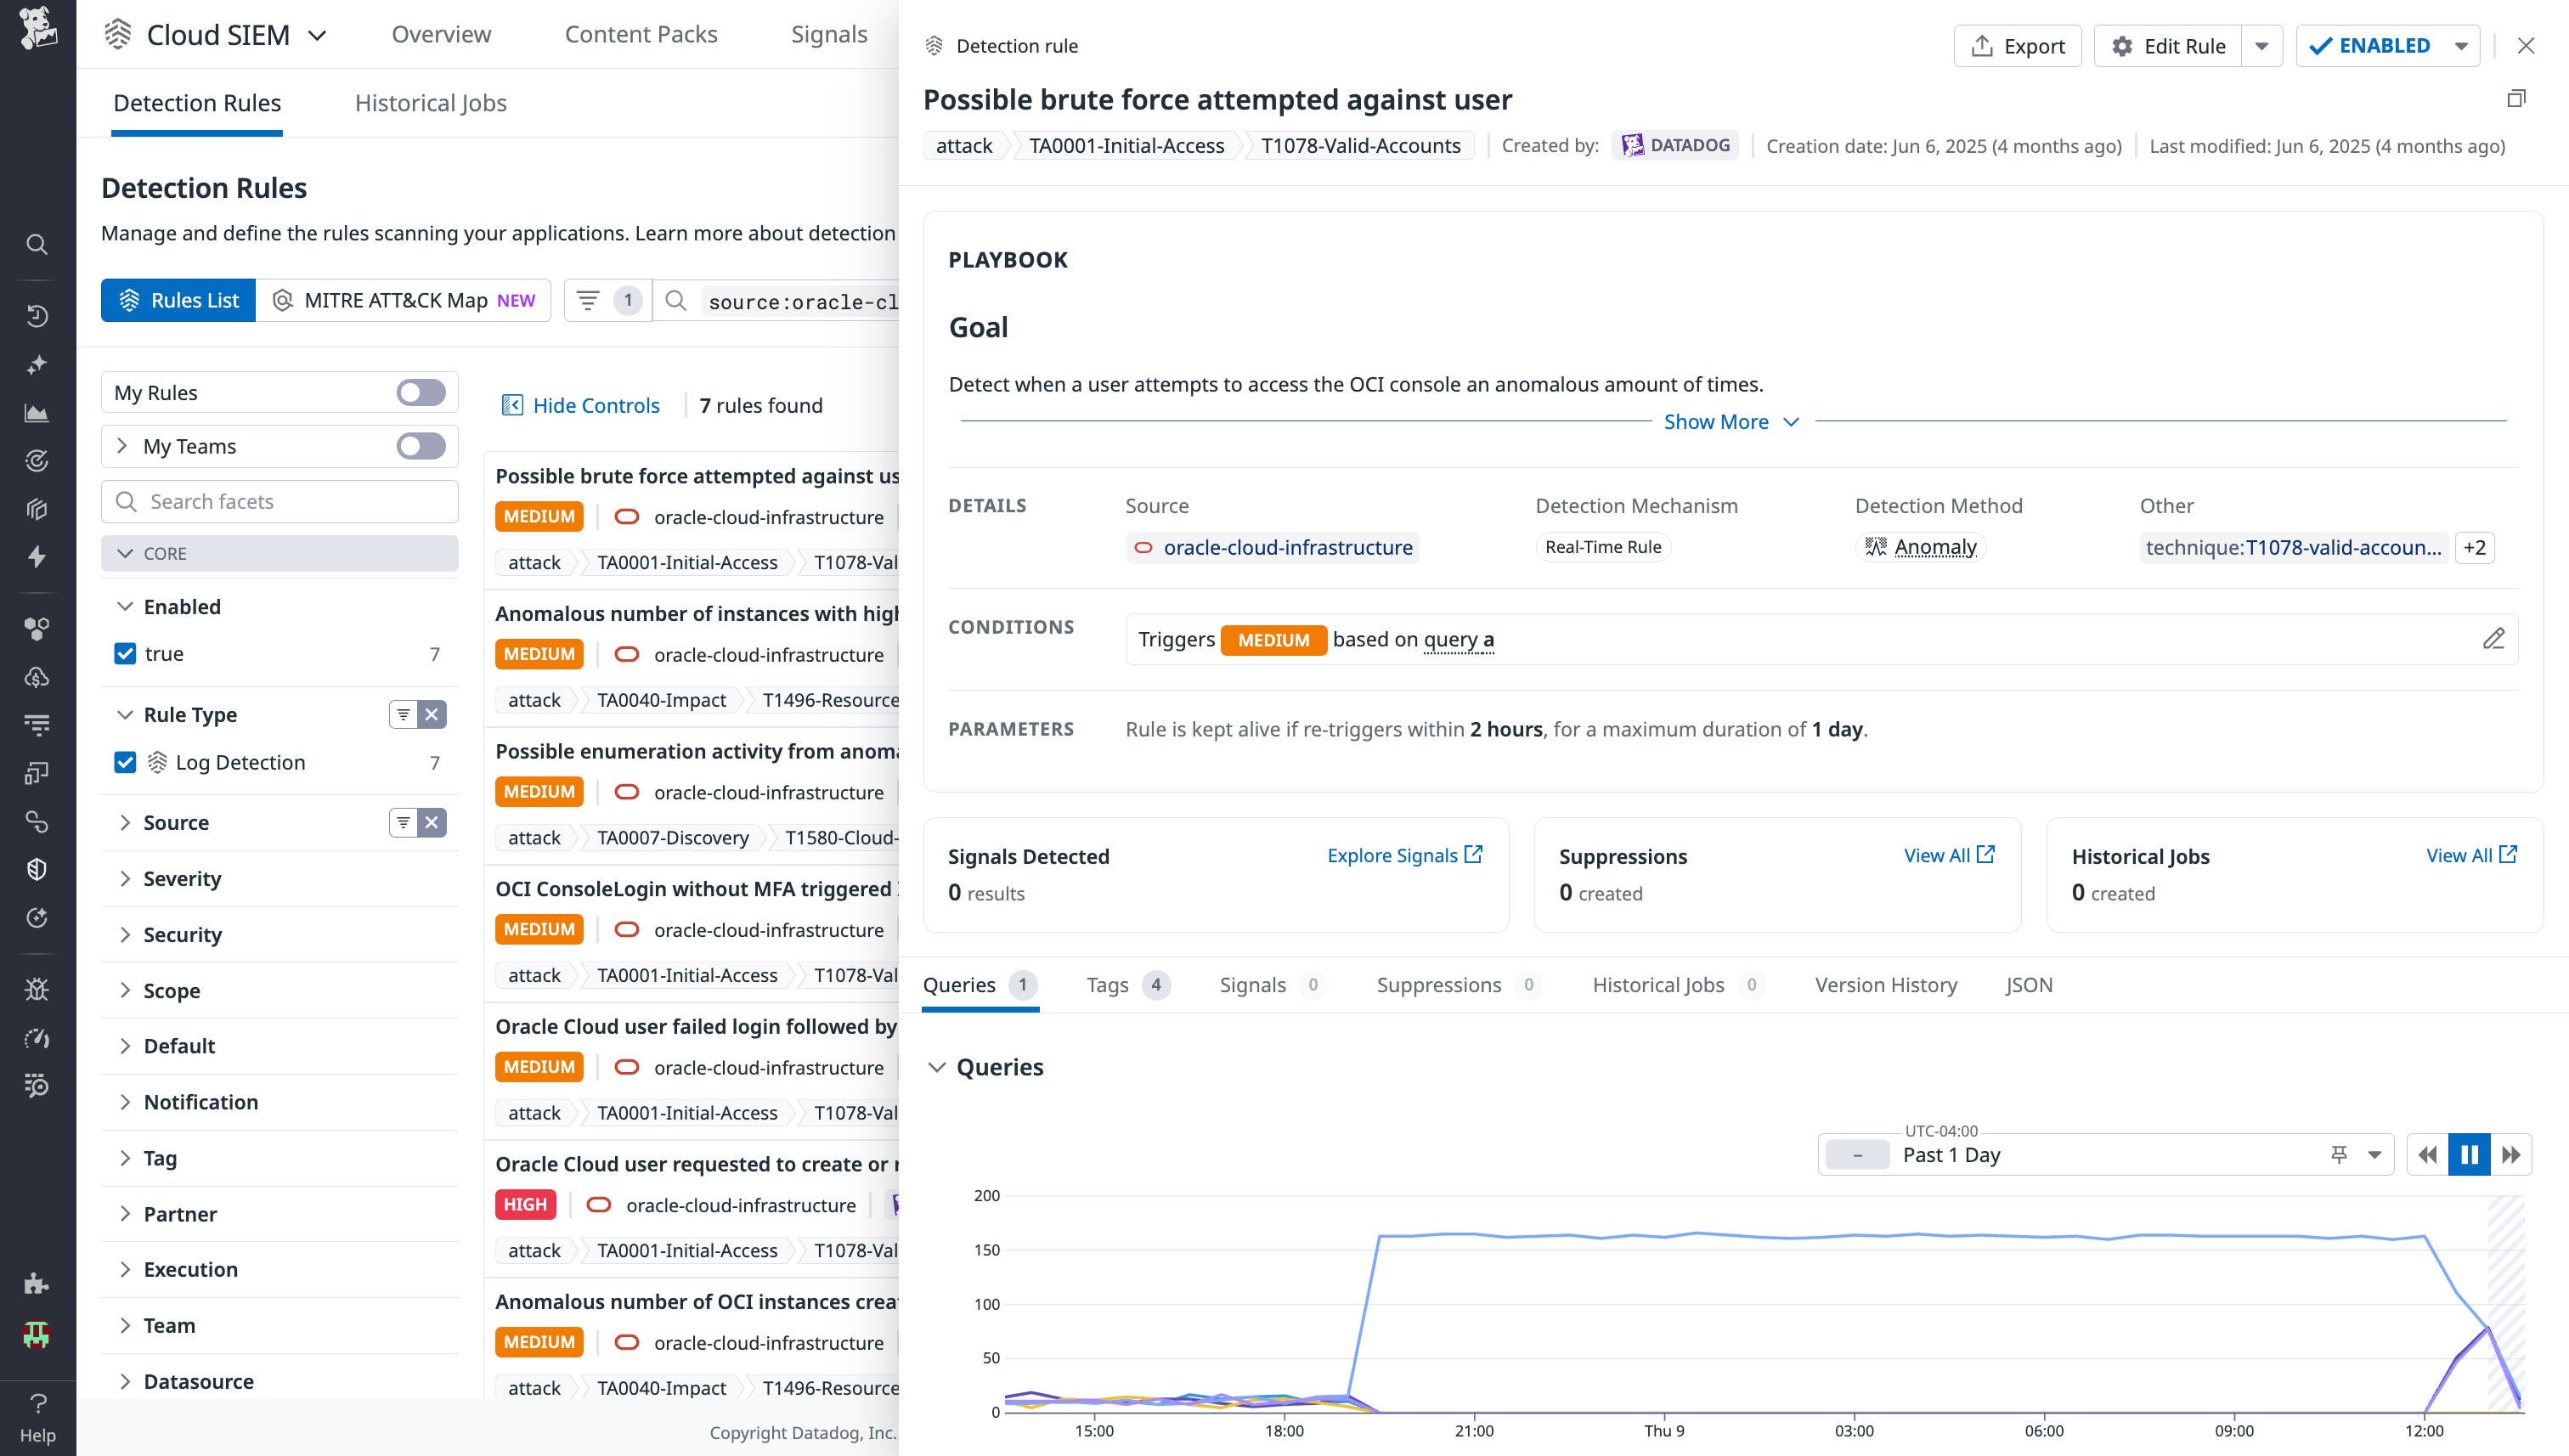
Some highlights include:
- Brute force and login anomalies: Detects both repeated failed logins and scenarios where a failed login sequence is quickly followed by a successful one—an indication of a potential brute force attack.
- Enumeration and reconnaissance: Identifies anomalous increases in denied API calls, which can reveal when an attacker is probing for permissions or available resources in a compromised account.
- Resource misuse and cryptomining: Spots unusual infrastructure usage, such as the sudden creation of GPU-intensive instances (a common sign of illicit cryptomining) or large numbers of instances spun up across multiple availability domains.
For example, an attacker who has already compromised a user’s email account could then attempt to reset the user’s Oracle Cloud password by issuing a CreateOrResetMyPasswordRequest, gaining full account access to escalate privileges, persist access, or exfiltrate data. When this detection rule is triggered, a security analyst can investigate surrounding activity—such as failed logins, privilege escalations, or suspicious instance creation—and correlate it with related detections like impossible travel or brute force attempts.
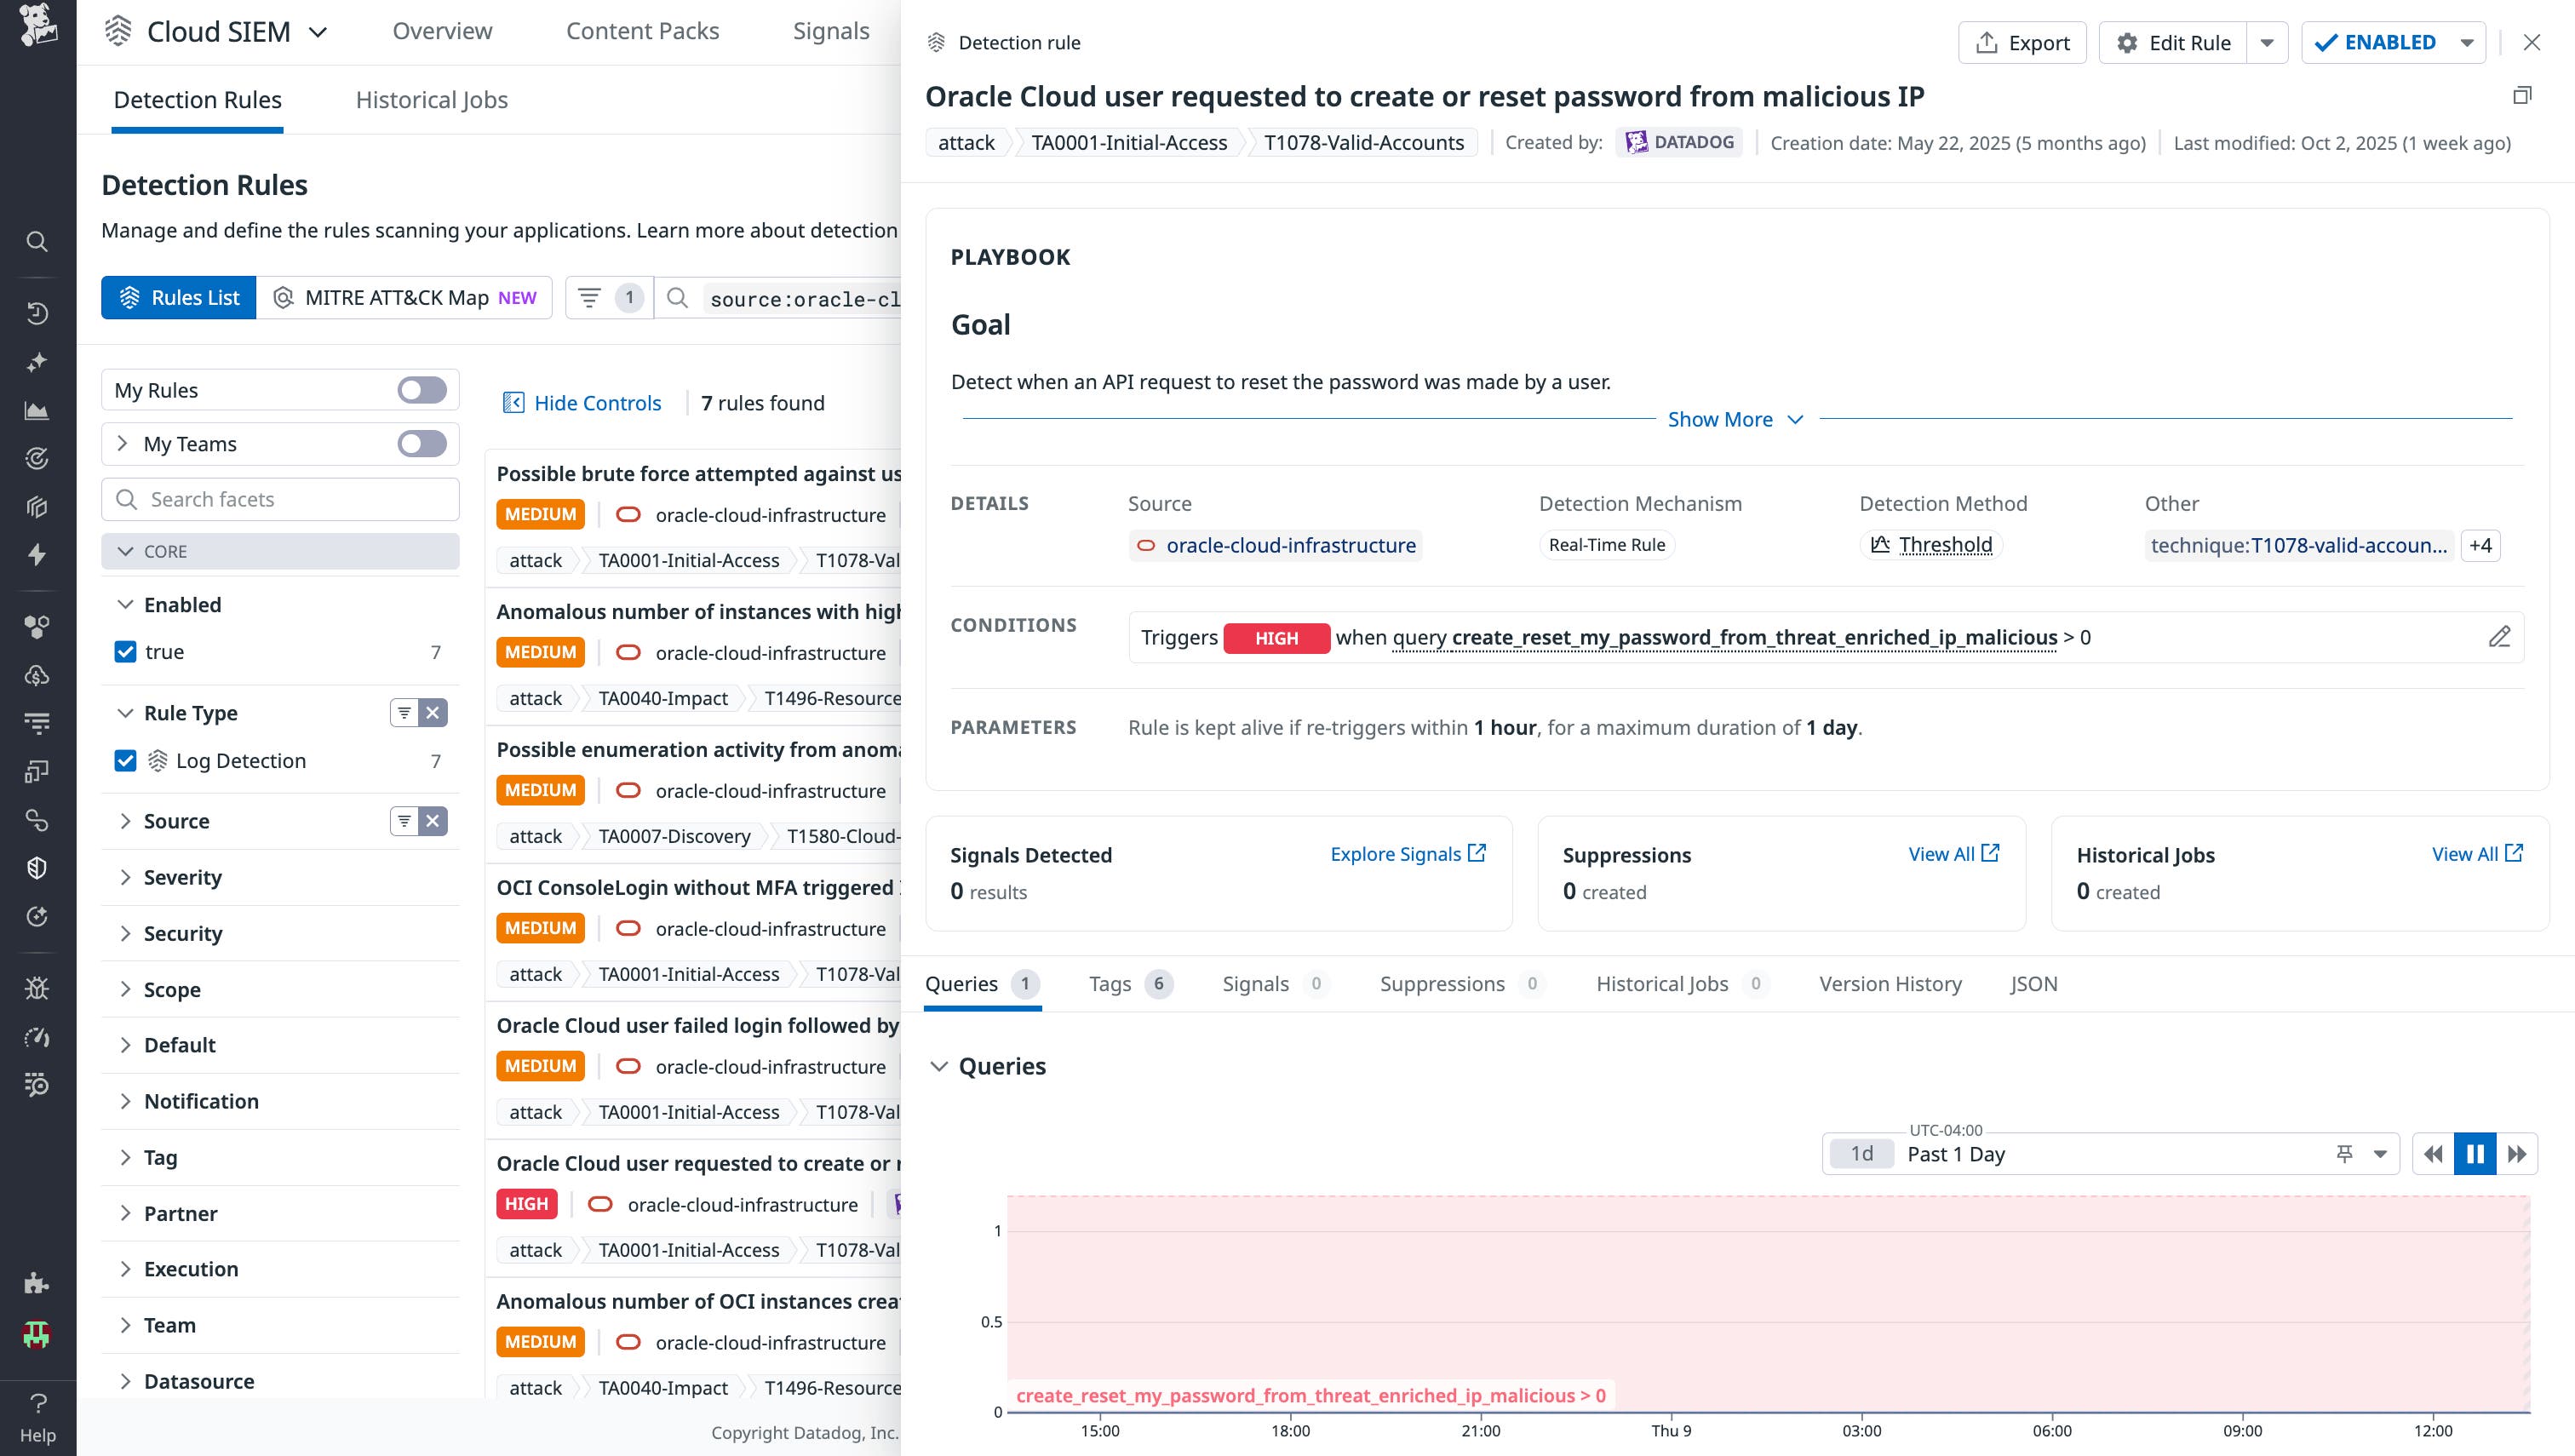
The analyst can then disable the user, rotate credentials, and trace the source IP for related activity in OCI Audit Logs. They can also enrich findings with threat intelligence sources like VirusTotal to see if the IP is linked to malicious infrastructure.
Together, these rules provide analysts with a ready-made foundation for investigating threats in OCI, while still leaving room to build custom detections tuned to their own environments.
Visualize logs and alert activity with the OCI Security Dashboard
To complement these detection rules, the Oracle Cloud Infrastructure (OCI) Security Dashboard gives analysts a centralized view of Oracle Cloud activity, identities, and triggered security signals, helping them quickly scope and investigate potential threats.
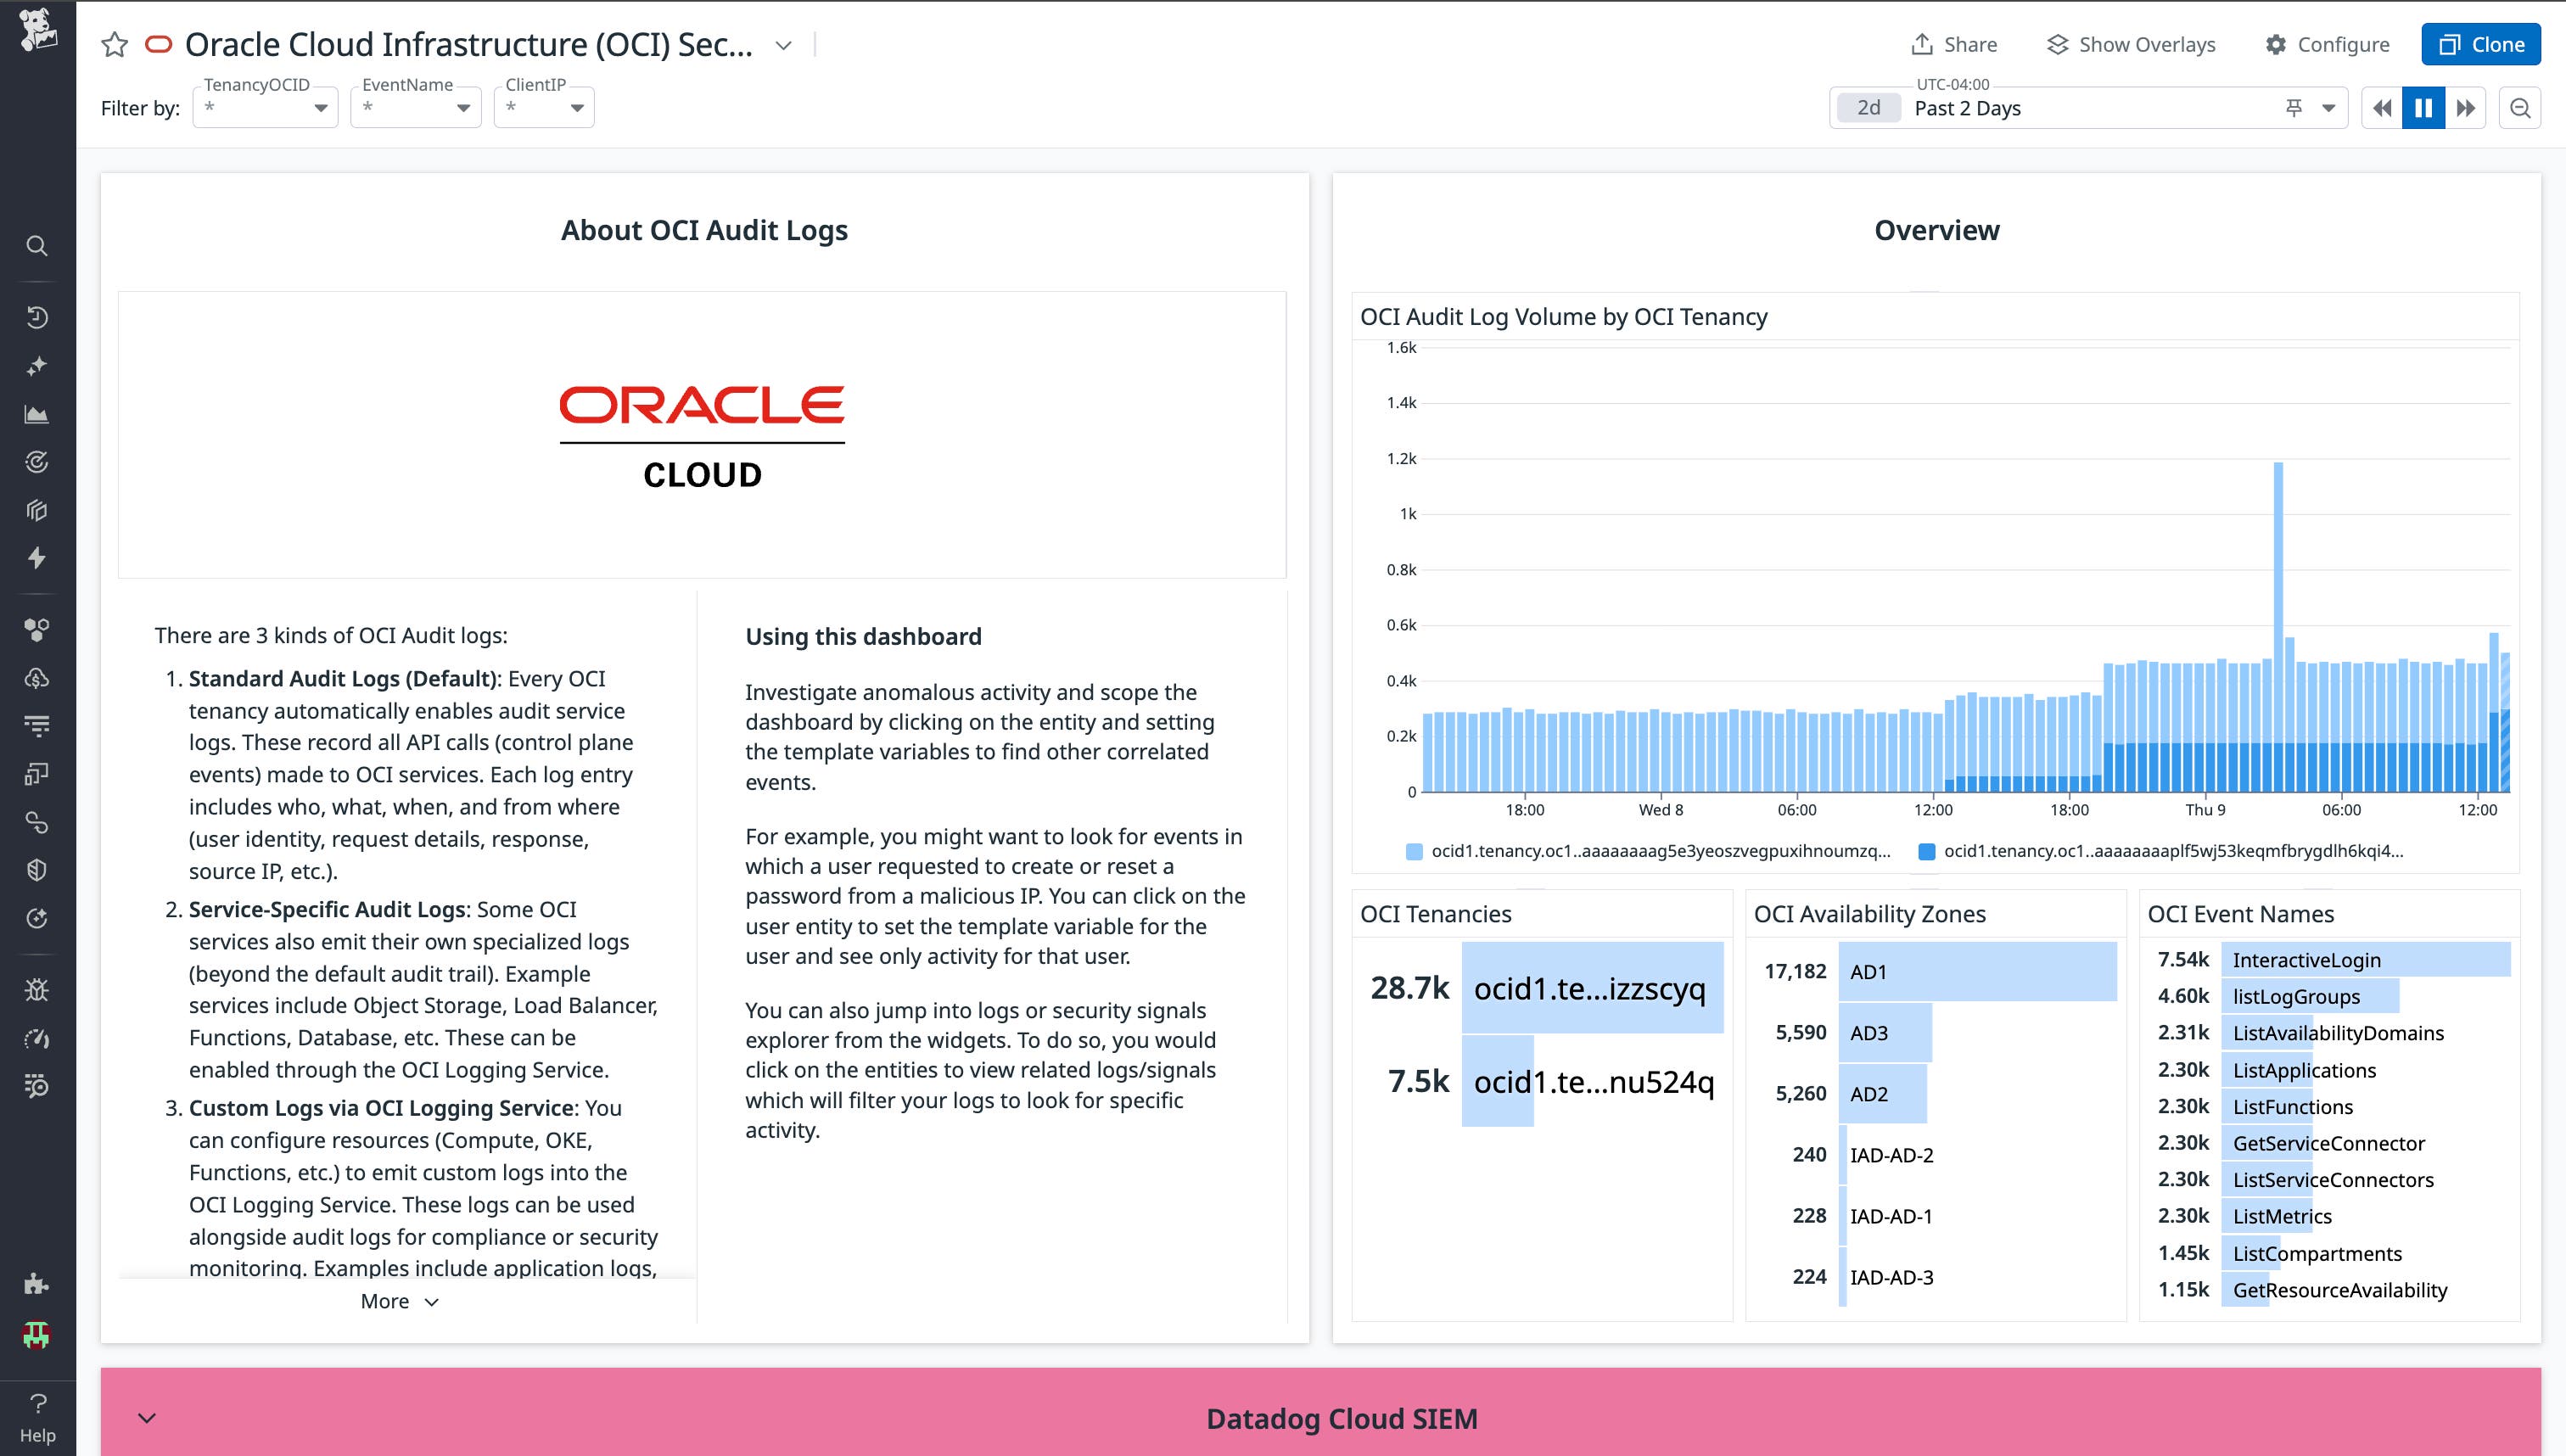
The dashboard includes overview charts for OCI Audit log volume, tenancies, availability zones, and event names, as well as Cloud SIEM signal visibility that shows alerts by severity and type so teams can prioritize what to investigate.
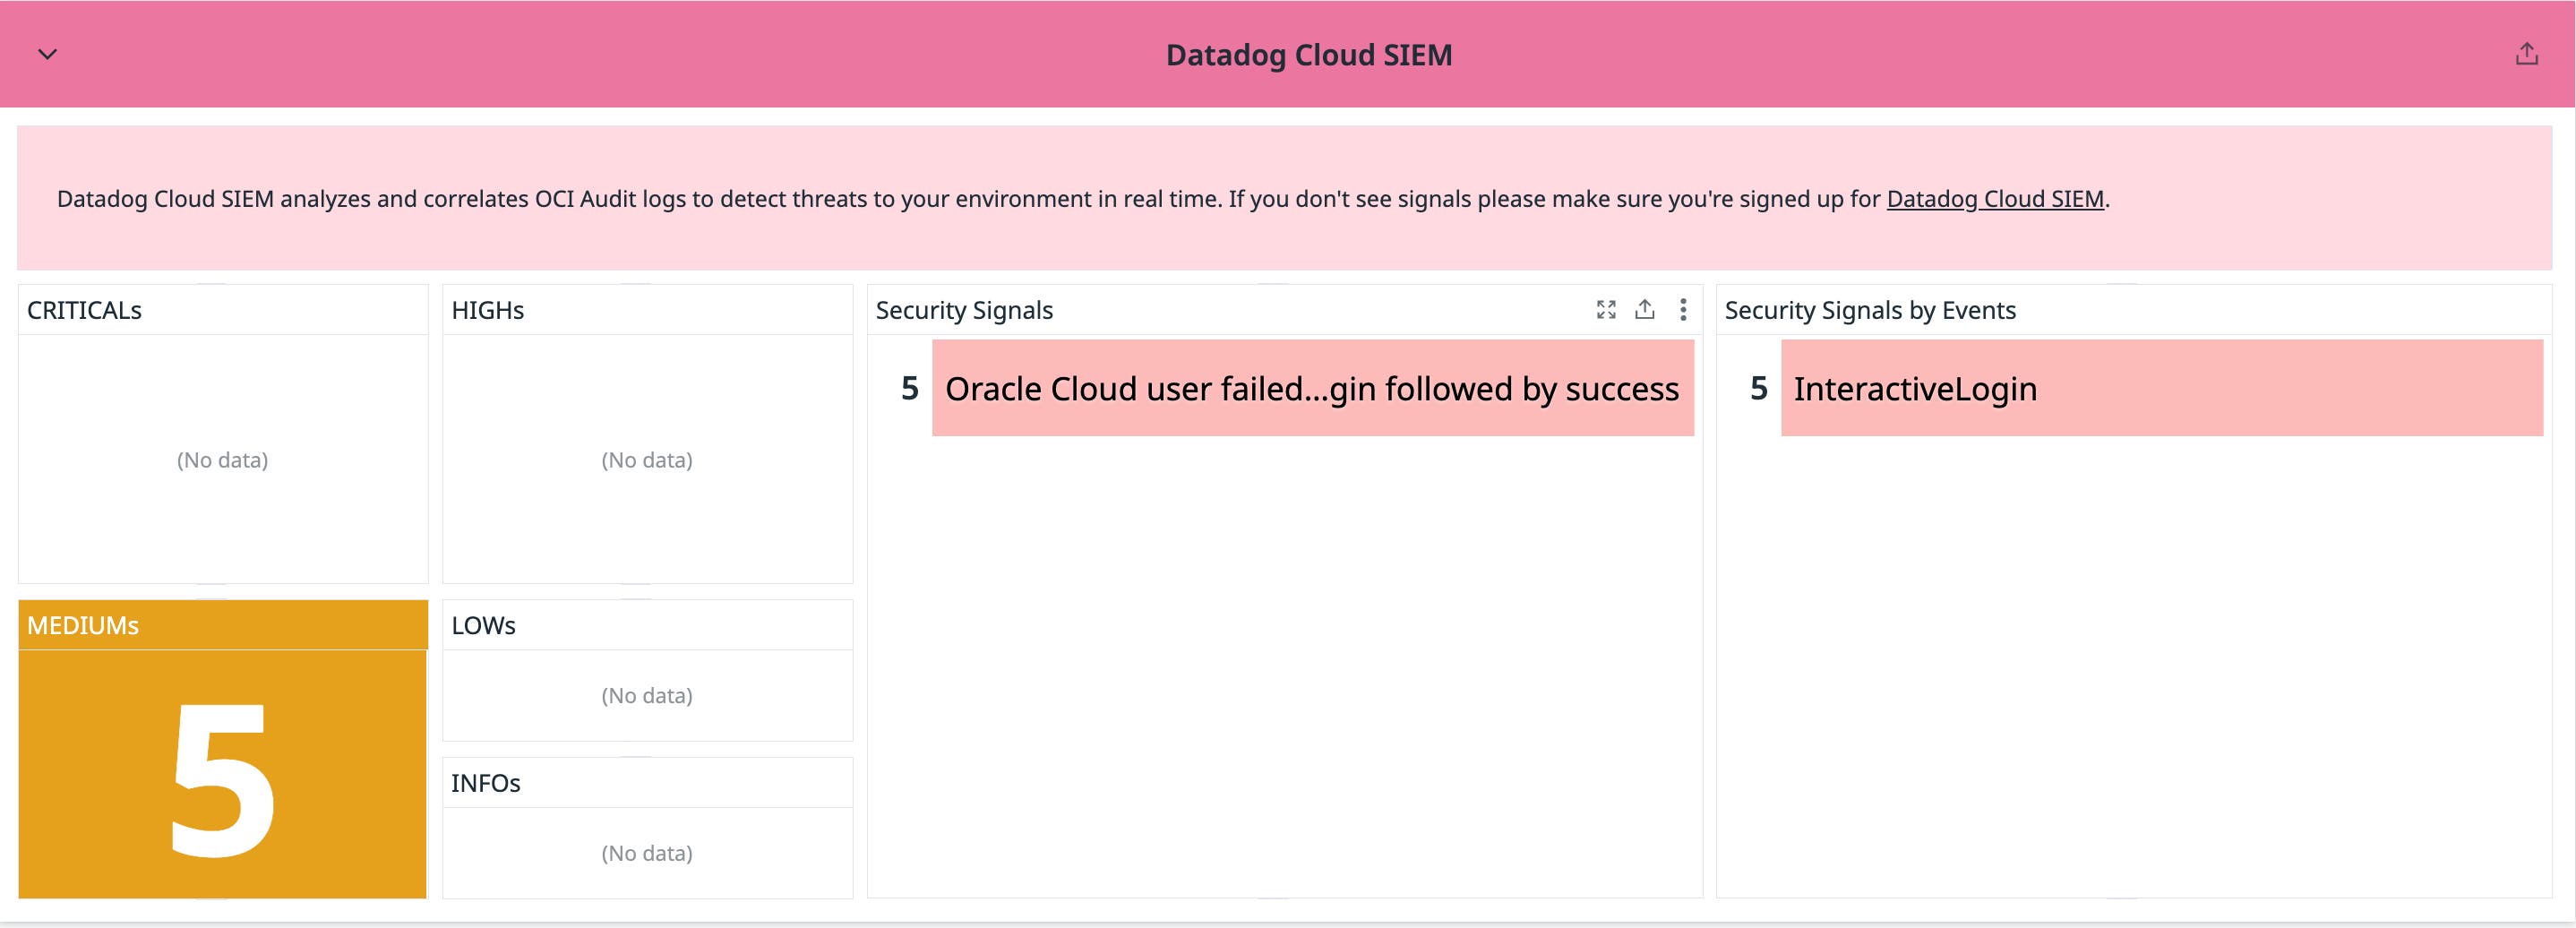
Analysts can also quickly view identity insights on the OCI Security Dashboard, including user IDs, authentication methods (e.g., API keys, federated logins, instance principals), request headers, account activity, and user geography.
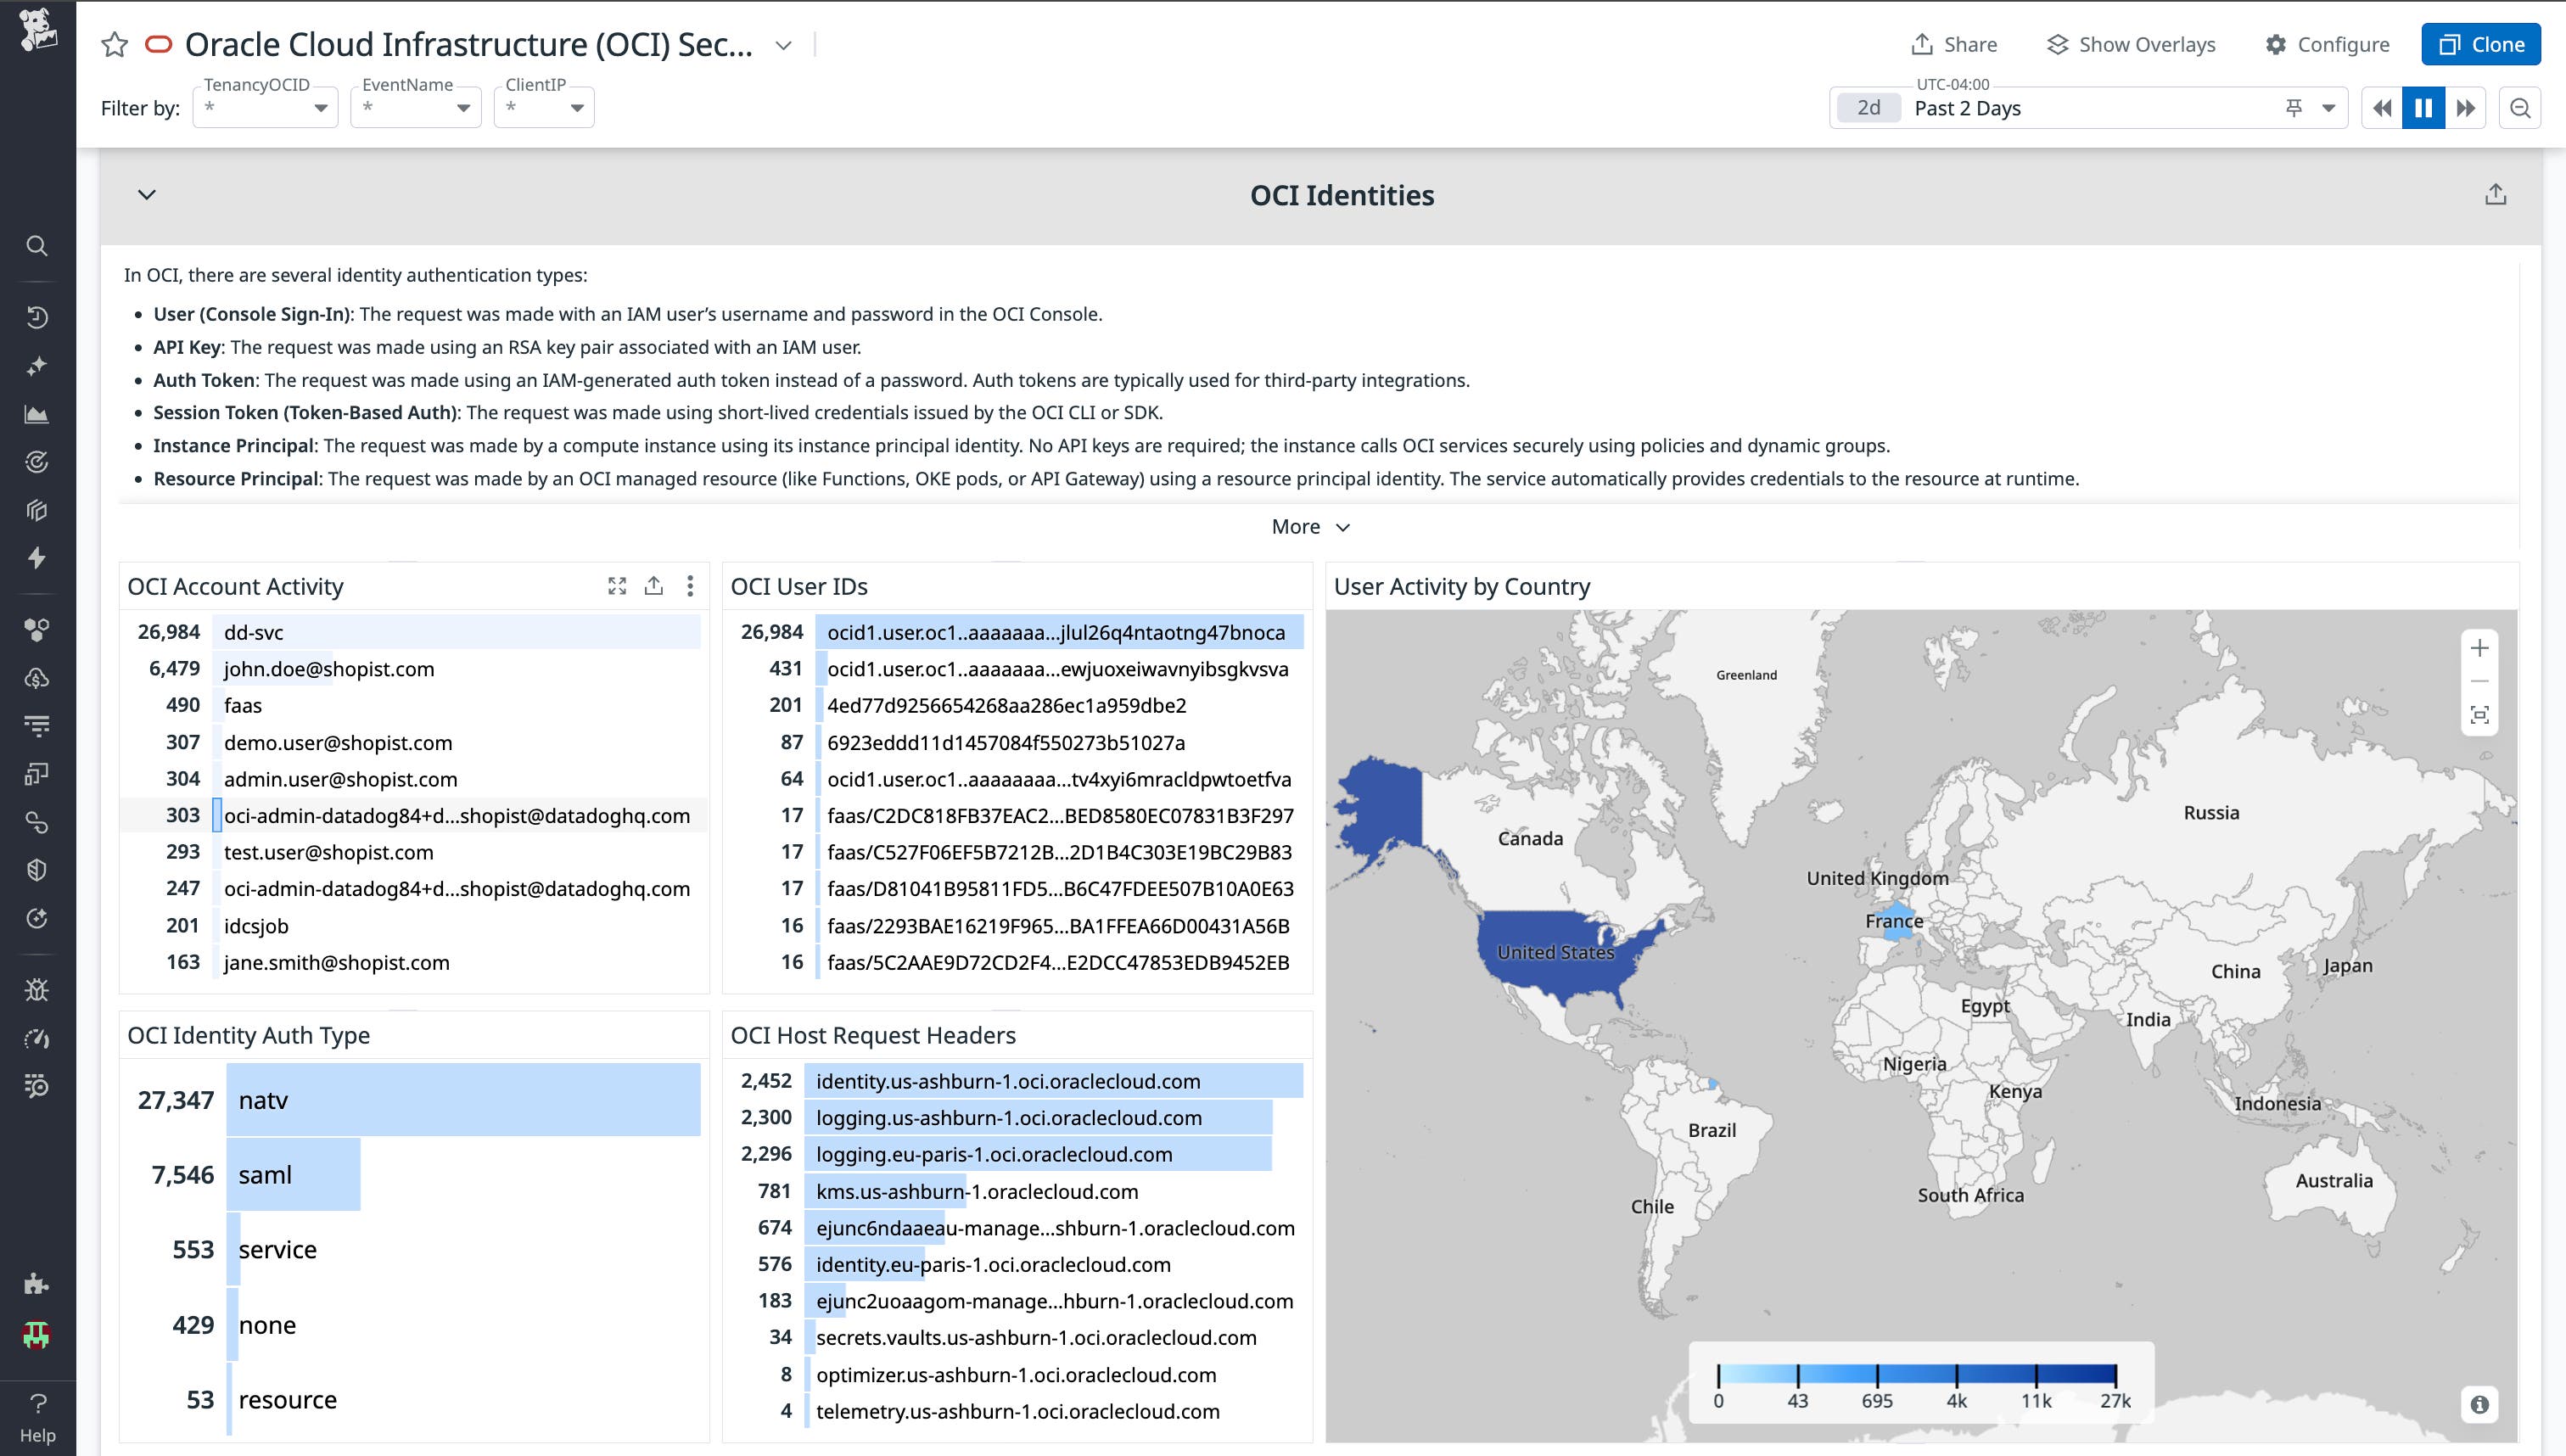
From any widget, analysts can click into specific users, hosts, or events to filter activity, pivot directly into related logs or security signals, and uncover correlated behavior. For example, if a password reset is attempted from a suspicious IP, you can scope the dashboard to that user and immediately view all related events. This dashboard provides a clear, actionable starting point for triaging suspicious activity in Oracle Cloud Infrastructure, with quick pivots into deeper investigation in Datadog.
Get deeper visibility into your Oracle Cloud Infrastructure with Datadog Cloud SIEM
Datadog’s OCI Content Pack for Cloud SIEM centralizes security monitoring for Oracle Cloud Infrastructure, drawing upon OCI Audit Logs and features in both Log Management and Cloud SIEM to deliver detection rules, dashboards, and other key security insights. With a single hub for OCI-related security events, your team can quickly investigate suspicious activity and remediate threats to help protect your cloud environment at scale.
You can see how this integration empowers security teams to accelerate threat detection and response across OCI at Oracle AI World in Vegas, and you can sign up to meet us there. If you’re already a Datadog customer, start exploring the new OCI Content Pack today. If not, you can get started with a 14-day free trial.
