
Alexis Lê-Quôc
When you need to monitor Java applications like Tomcat or Cassandra, JMX is the gatekeeper to performance metrics. Extracting metrics from JMX is often a tedious and challenging process: Once JMX metrics are extracted, they must be collected in another system in order to be graphed and analyzed. Below, you can see the JConsole Overview, showing 4 basic metrics.
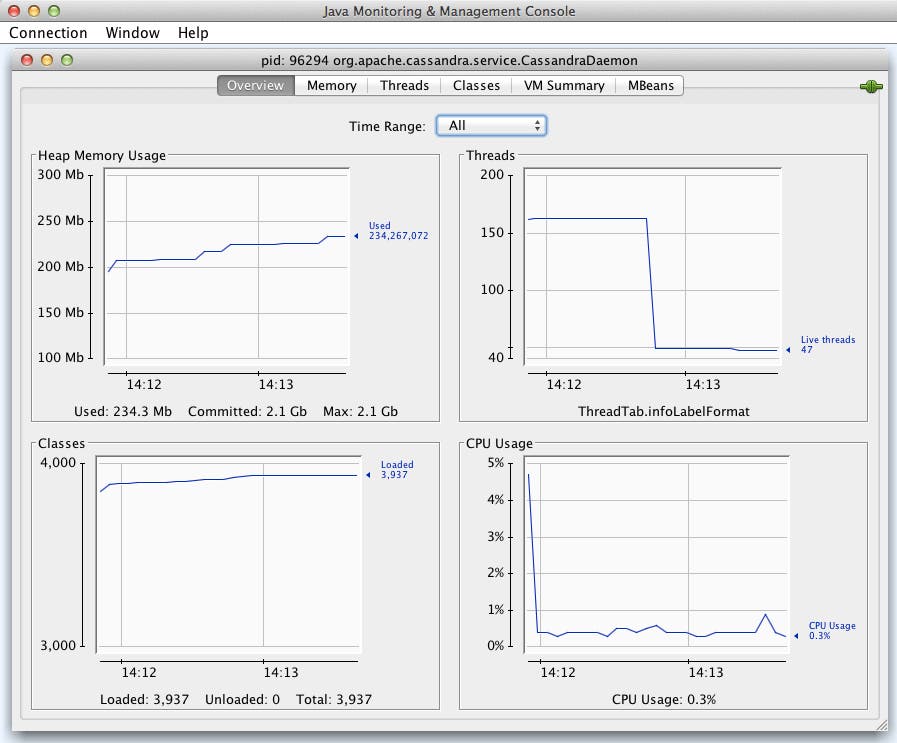
Up until now, system admins and developers who wanted to see JMX metrics quickly relied on JConsole, an open-source tool. Though helpful and very quick to deploy, JConsole has several limitations:
- It does not retain historical data.
- It can only graph a few metrics.
- It does not support alerting.
As shown below, diving into application-specific metrics can be a game of many clicks.
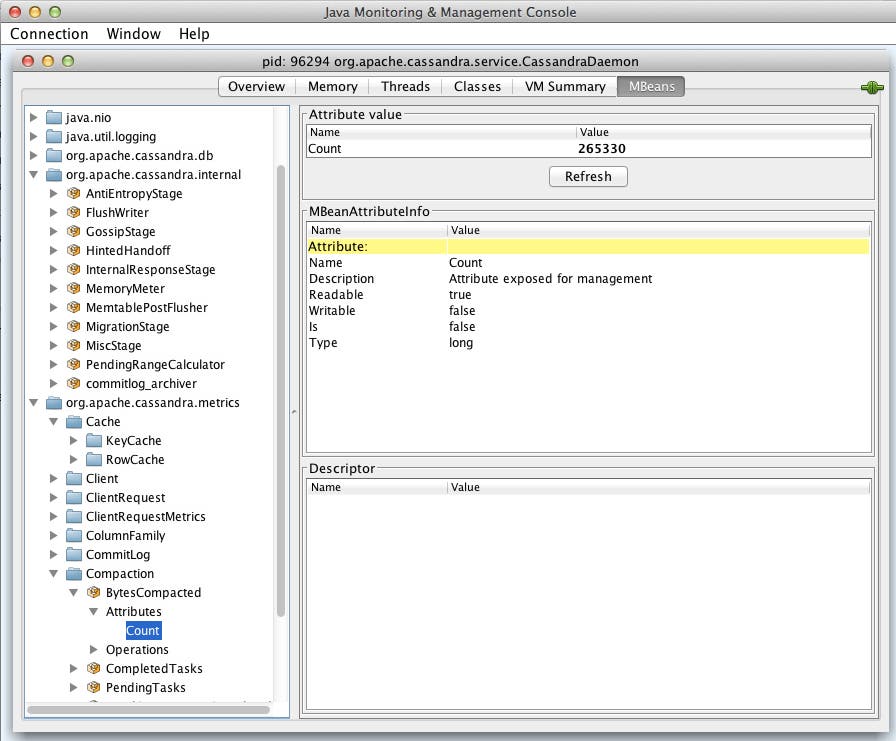
Ultimately JConsole is not a tool with the capabilities that many developers require to understand their application’s performance.
With Datadog’s newly-released agent, we have made JMX monitoring robust and easy to setup. We’re pleased to announce an upgraded, more efficient JMX connector, JMXFetch, a part of the Datadog agent v4 that will run on any OS supporting a Java application.
Once installed the agent will connect to your JMX MBeans and collect the metrics you need. If your metrics are available as part of an MBean, they automatically become available for graphing, alerting and correlation analysis within Datadog.
Graphing JMX metrics
Due to the sheer volume of data that JMX can produce, the fastest way to grok a metric is to graph it. This is especially true if you want to identify trends and conduct historical analysis.
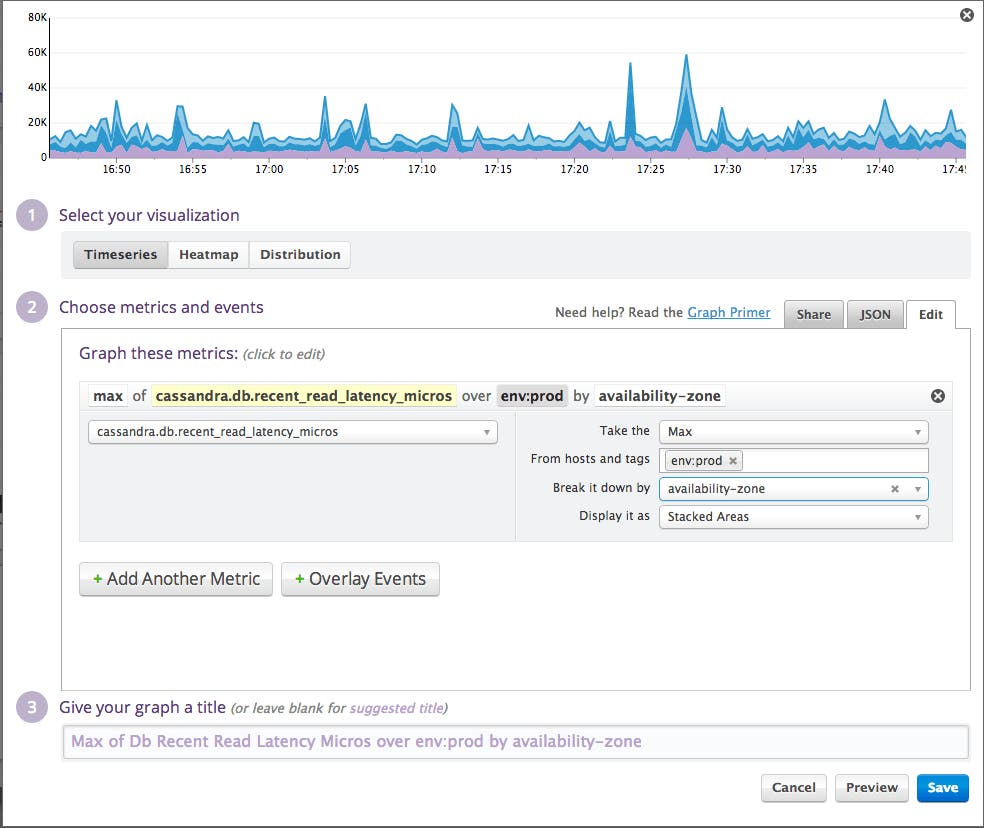
With Datadog you can graph JMX metrics from specific hosts. You can also graph aggregated JMX metrics from hosts sharing the same tags.
Here is an example of a Cassandra cluster’s read latency for all hosts tagged with env:prod, with the results aggregated by availability-zone.
JMX metric alerts
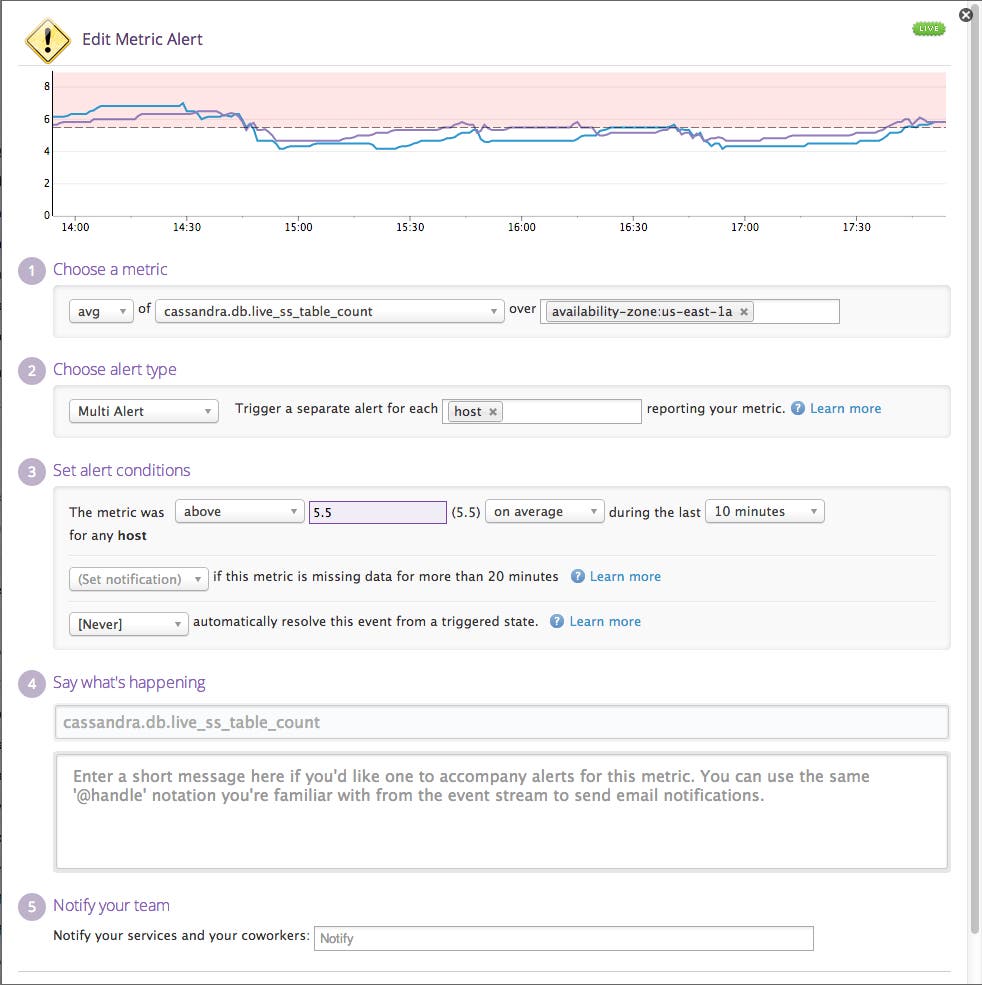
Because Datadog treats JMX metrics like any other metric, Datadog’s alerting engine will work out-of-the-box with any JMX metric that your agents send on. Much like your graphs, you can set alerts on JMX metrics for an individual host, or you can set alerts on aggregated metrics for a service (defined by one or more tags). See this and this for more details about alerts.
Here is an example of an alert defined on Cassandra’s SSTable count for all hosts that run on a given availability zone (or data center).
Correlating JMX metrics with events in other systems
Your applications may run in the JVM but they depend on much more than that to do actual work: databases, caches, external services, etc. How does a bunch of slow queries in the database affect your JMX metrics?
That’s an easy question to answer with Datadog. You can correlate your JMX metrics and events with data from any other system in your environment. You can then see the impact on a JMX metric from another system at a very granular level.
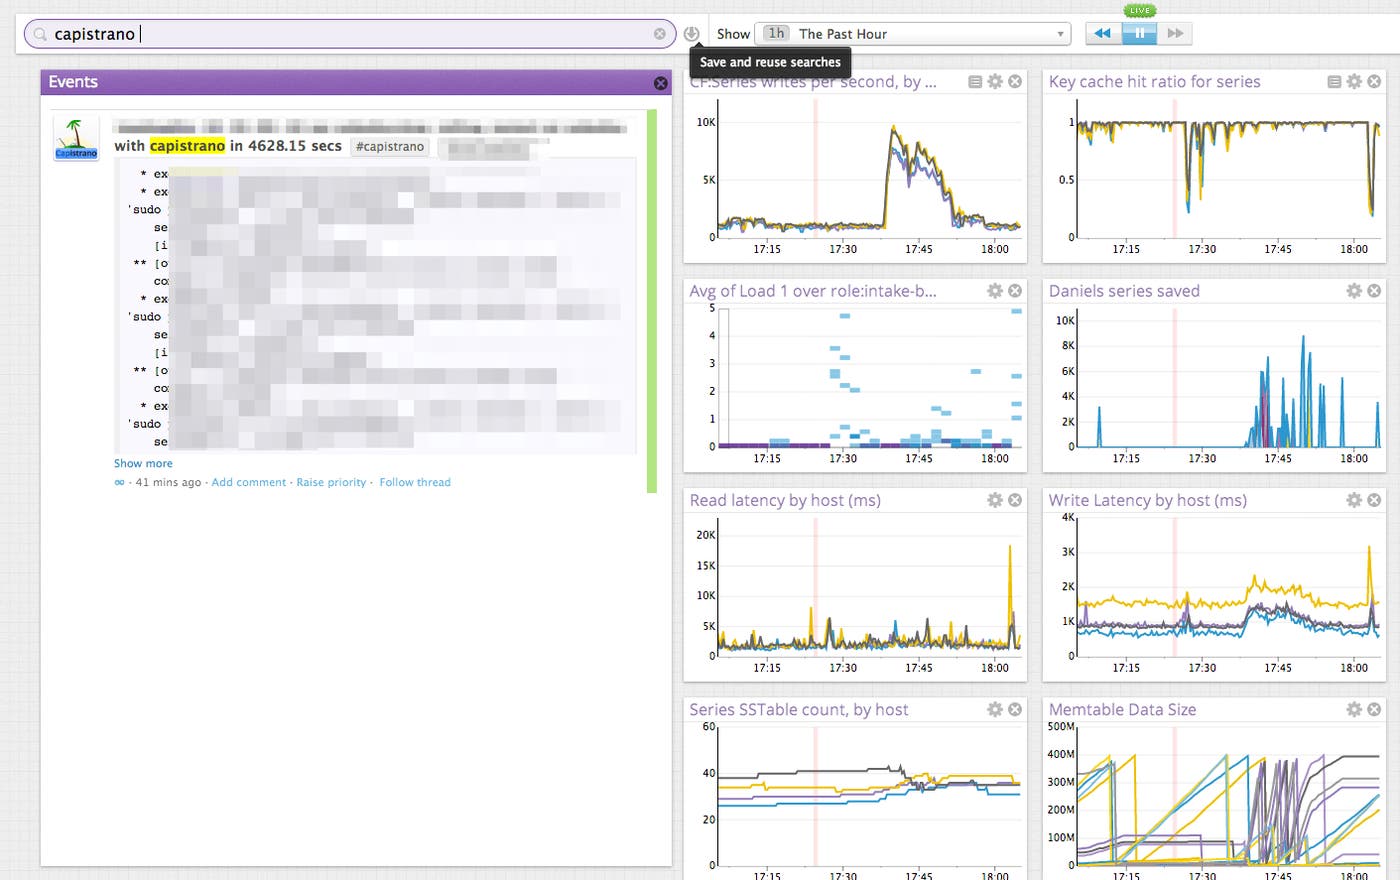
Here’s an example: a code push via Capistrano is overlaid on top of several JMX metrics to explore how new code is affecting real-time performance.
Don’t get bogged down when trying to access and understand your JMX metrics. You can easily graph, alert and analyze these data by signing up for a free trial of Datadog. Within minutes of installing our agent, you’ll have access to your JMX metrics and these will be available in Datadog for analysis and alerting.
