Remi Hakim
Microsoft’s Windows Management Instrumentation (WMI) is used to collect and manage performance metrics and counters for a wide range of popular Windows-based applications, including Microsoft Exchange, SharePoint, SQL Server, and IIS. WMI can also be used to track metrics for .NET applications. WMI’s counterpart, Microsoft Event Viewer, similarly collects discrete events and alerts from the same applications.
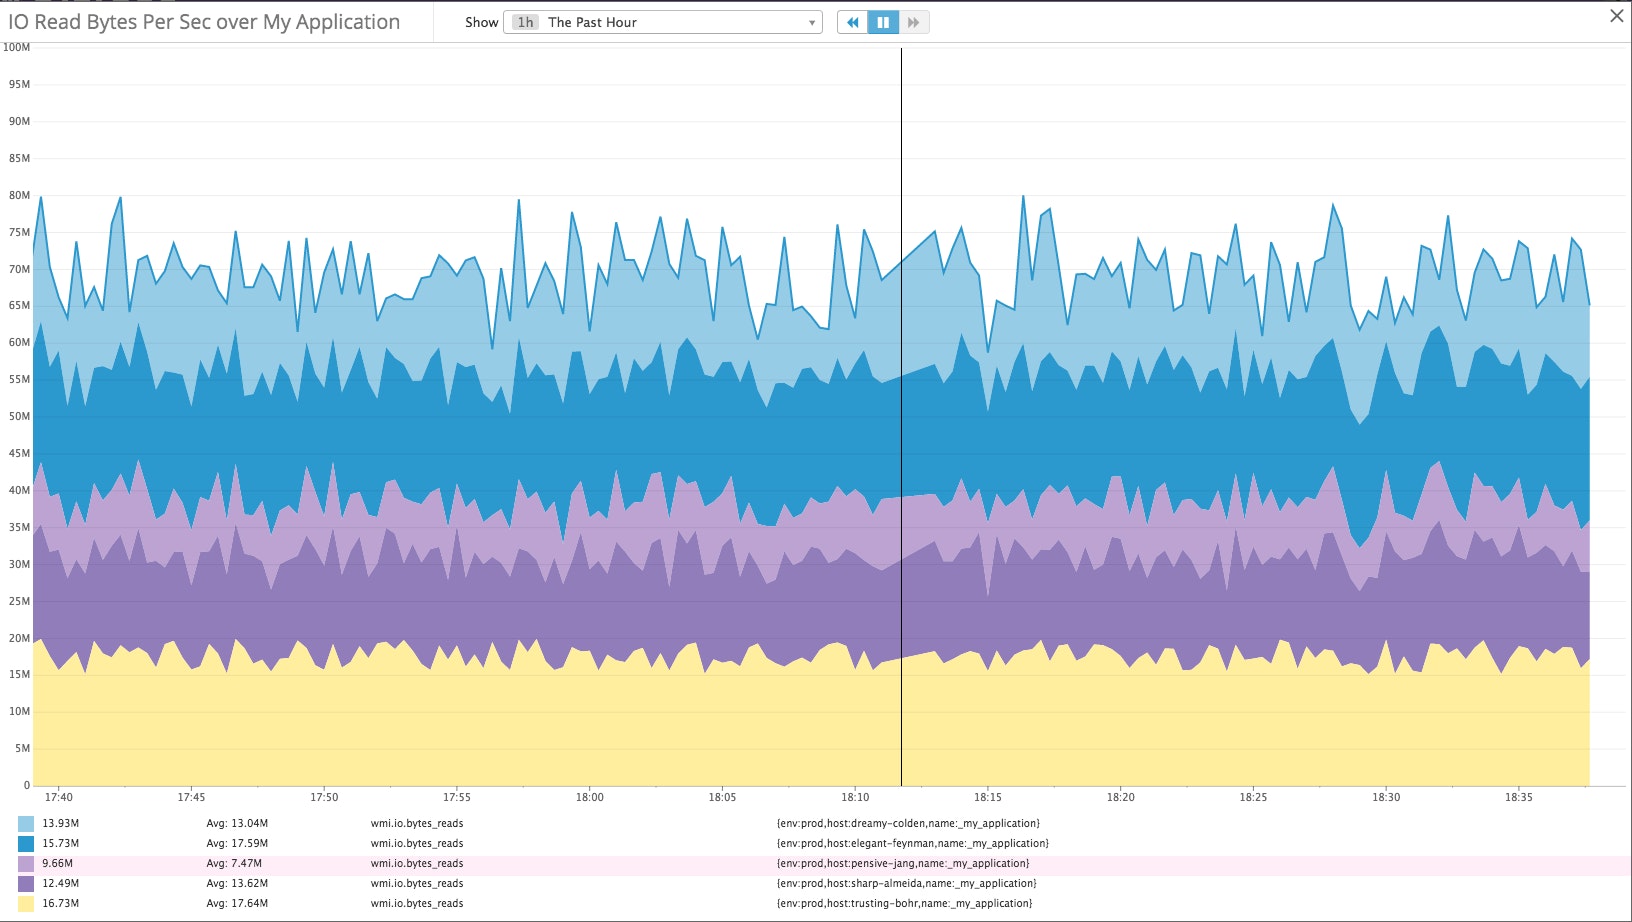
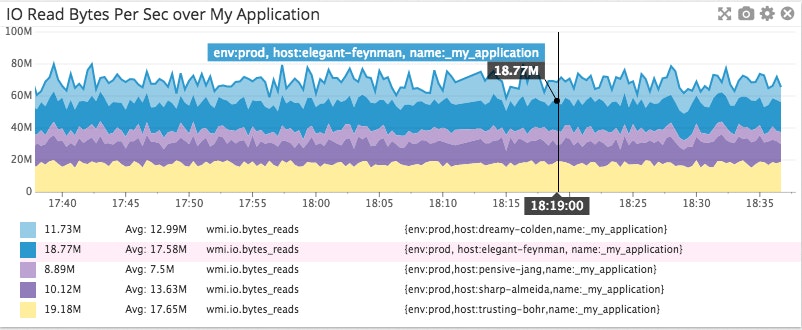
With Datadog’s WMI integration, you can pull in metrics from Windows applications for graphing, analysis, and alerting. In addition to being able to pull a wide range of common, preset performance counters, you can create your own metrics to be monitored from inside WMI for custom built applications within the .NET framework. Likewise, alerts and discrete events from Microsoft Event Viewer can be sent to Datadog’s Event Stream as well as being available for commenting and correlation analysis with metrics collected from WMI or from other sources.
Collecting metrics from custom .NET applications
Datadog’s WMI integration is especially useful for engineering teams that use the full Microsoft stack and who develop in .NET. You can use WMI and Datadog to track and report on your high-level .NET app metrics. In addition to WMI metrics, you can use Datadog’s StatsD .NET port to emit custom metrics directly from within your applications, allowing you to graph and correlate both system and application metrics.

Aggregating Windows app data precisely with tagging
Modern applications are often hosted on cloud platforms where underlying servers can scale up or down dynamically. As a result, performance data for these many servers must often be aggregated to gain an understanding of how an entire cluster of machines is performing. Any WMI or Microsoft Event Viewer data pulled into Datadog will have certain tags associated with it, originating from the cloud platform, configuration management tool, and other sources.

In an Azure environment, for instance, this would include region, clusters, and any other tags associated with that server. When you create your own WMI metrics or Microsoft Event Viewer events to track, you can also associate those metrics with whatever tags you set, and they can also be tracked and parsed in Datadog.
If you develop with .NET or run your application on Windows, you can sign up for a free trial of Datadog to gain visibility into these components.


