Bowen Chen
Slurm (Simple Linux Utility for Resource Management) is an open source workload management system used to schedule jobs and manage resources for high-performance computing (HPC) Linux clusters. It ensures that jobs and resources are scheduled fairly and efficiently and is scalable across large clusters, an issue that native Linux process management tools struggle with. However, when jobs fail or are stuck in queues, it can be difficult to gain visibility into these jobs and correlate them to the state of the underlying infrastructure.
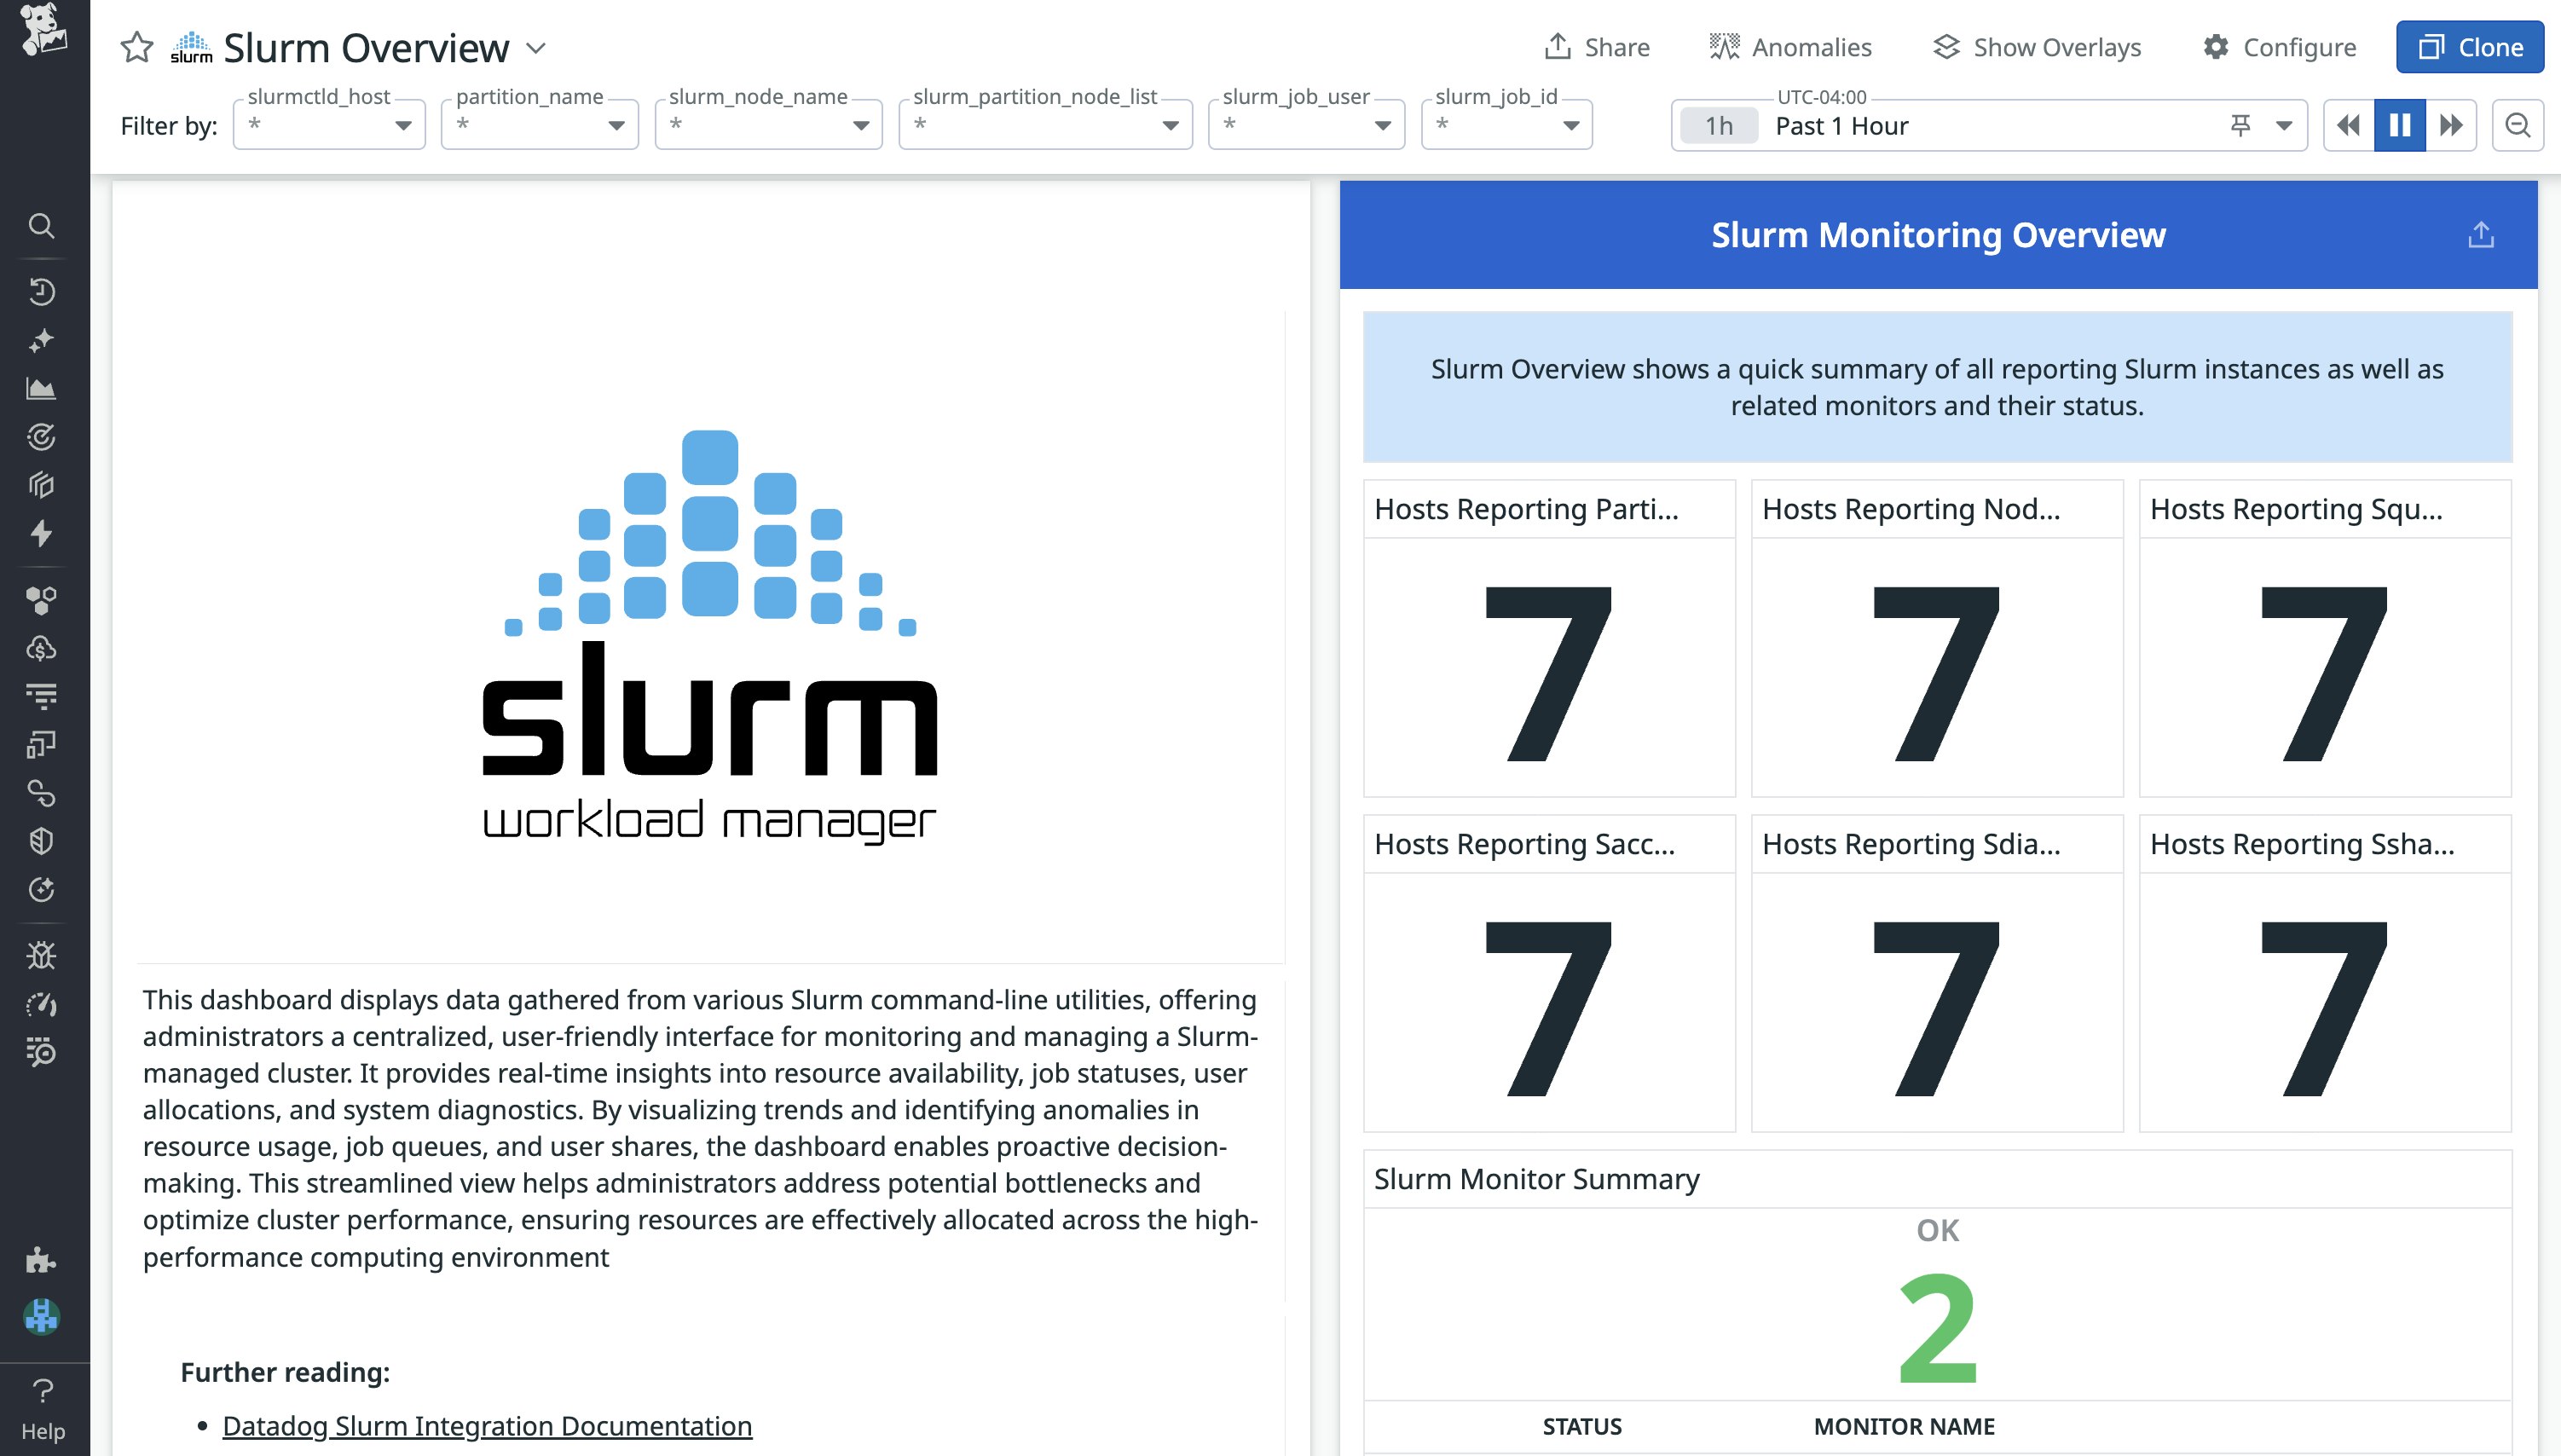
The Datadog Slurm integration collects Slurm metrics to give you deep visibility into Slurm and the clusters it runs. Using the integration, you can visualize the state of your Slurm jobs and job queues, resource utilization at the node and cluster level, the scheduler’s backfill efficiency, and more. In this blog post, we’ll cover how to gain quick visibility into Slurm using Datadog’s out-of-the-box (OOTB) dashboard as well as a few key metrics you’ll want to monitor.
Troubleshoot pending or failed Slurm jobs
When your Slurm jobs don’t behave like you expect them to—for example, if they’re always pending, unexpectedly fail, or seem to run inefficiently—it can be difficult to figure out what is going on under the hood. Querying Slurm’s different CLI tools can provide you with a partial view into your jobs and nodes, but these metrics often lack historical context and baselines for performance.
The Datadog Slurm integration collects metrics from slurmctld, the central controller that runs on the head node of your Linux cluster, to help you visualize metrics from the following Slurm commands: sinfo, squeue, sacct, sdiag, and sshare. After you configure the Slurm check for your Datadog agents running on the host, you’ll have immediate access to the OOTB Slurm dashboard. You can find configuration instructions in our Slurm integration tile.
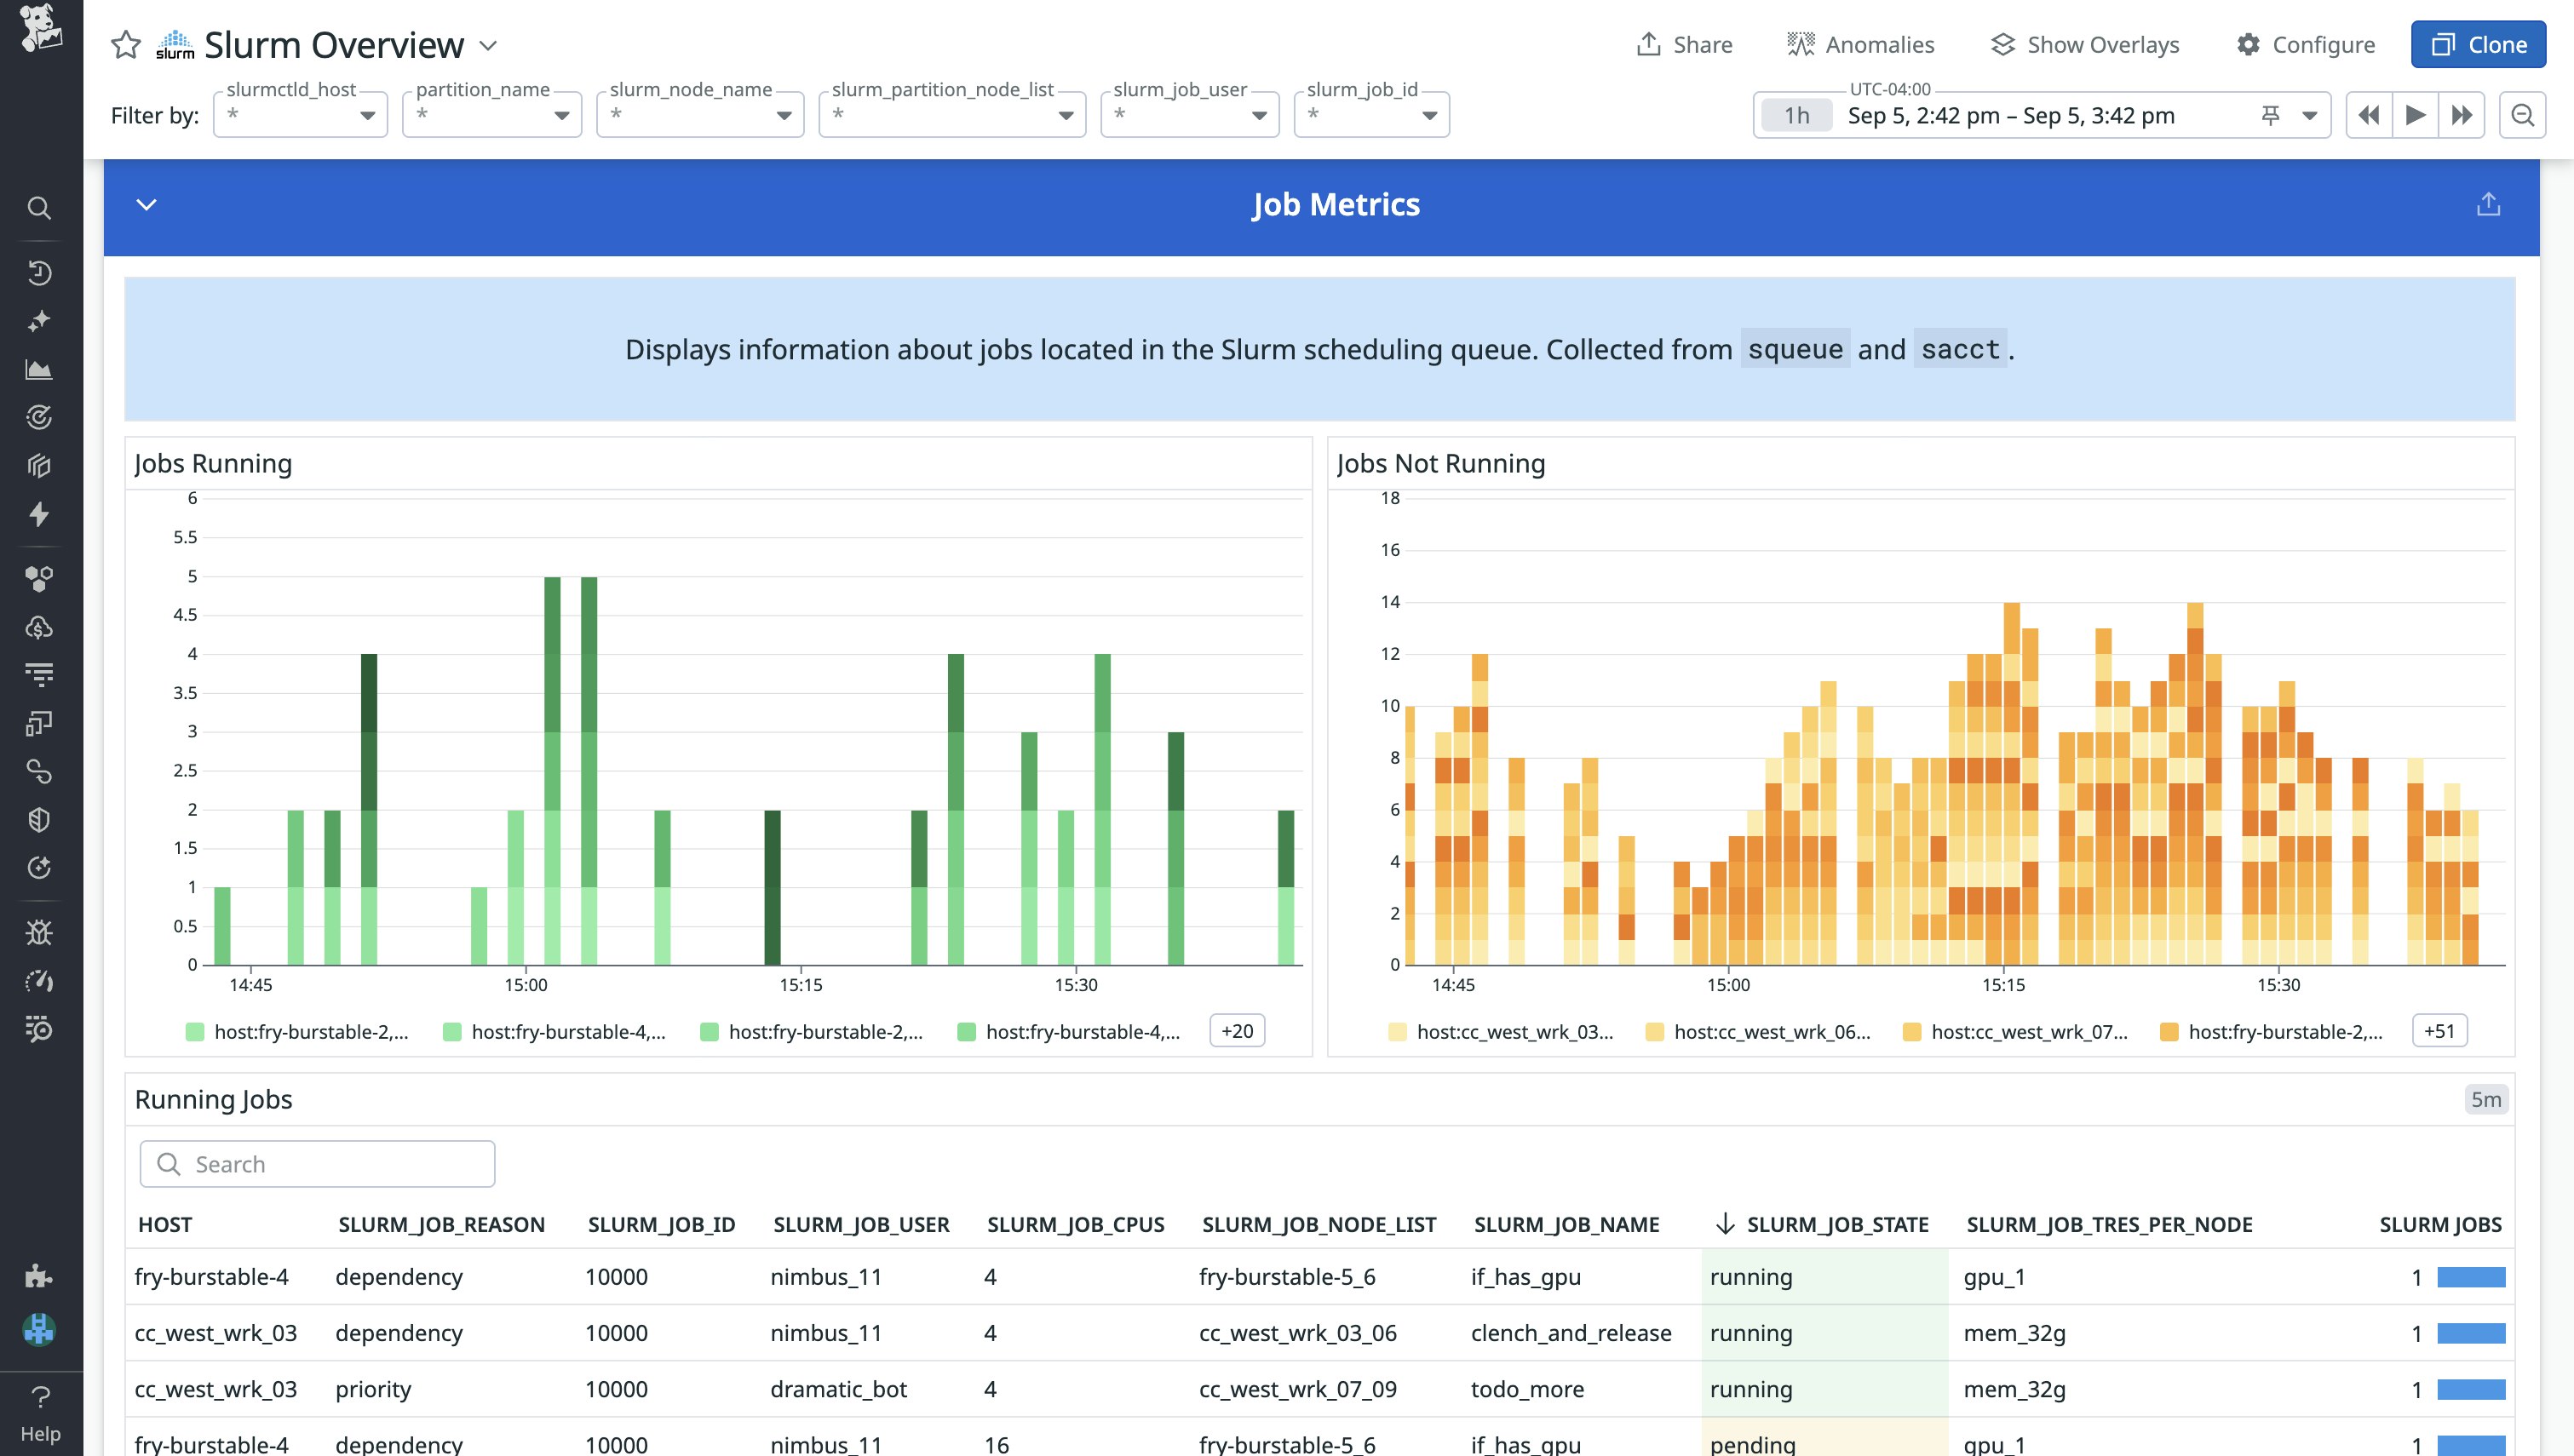
Using the dashboard’s Job Metrics, you can gain quick insights into pending and failed jobs. An initial look at the slurm_job_reason can help indicate whether your job is pending due to natural reasons or requires investigation. For instance, “priority” can indicate high-priority jobs within the same partition for which Slurm needs to allocate resources in advance, while “resources” can indicate resource contention or possibly inactive partitions due to mismatched configurations. On the other hand, when your jobs fail or experience slowdowns, the dashboard enables you to correlate the job with host-level resource metrics and slurmctld execution metrics that occurred when the job ran.
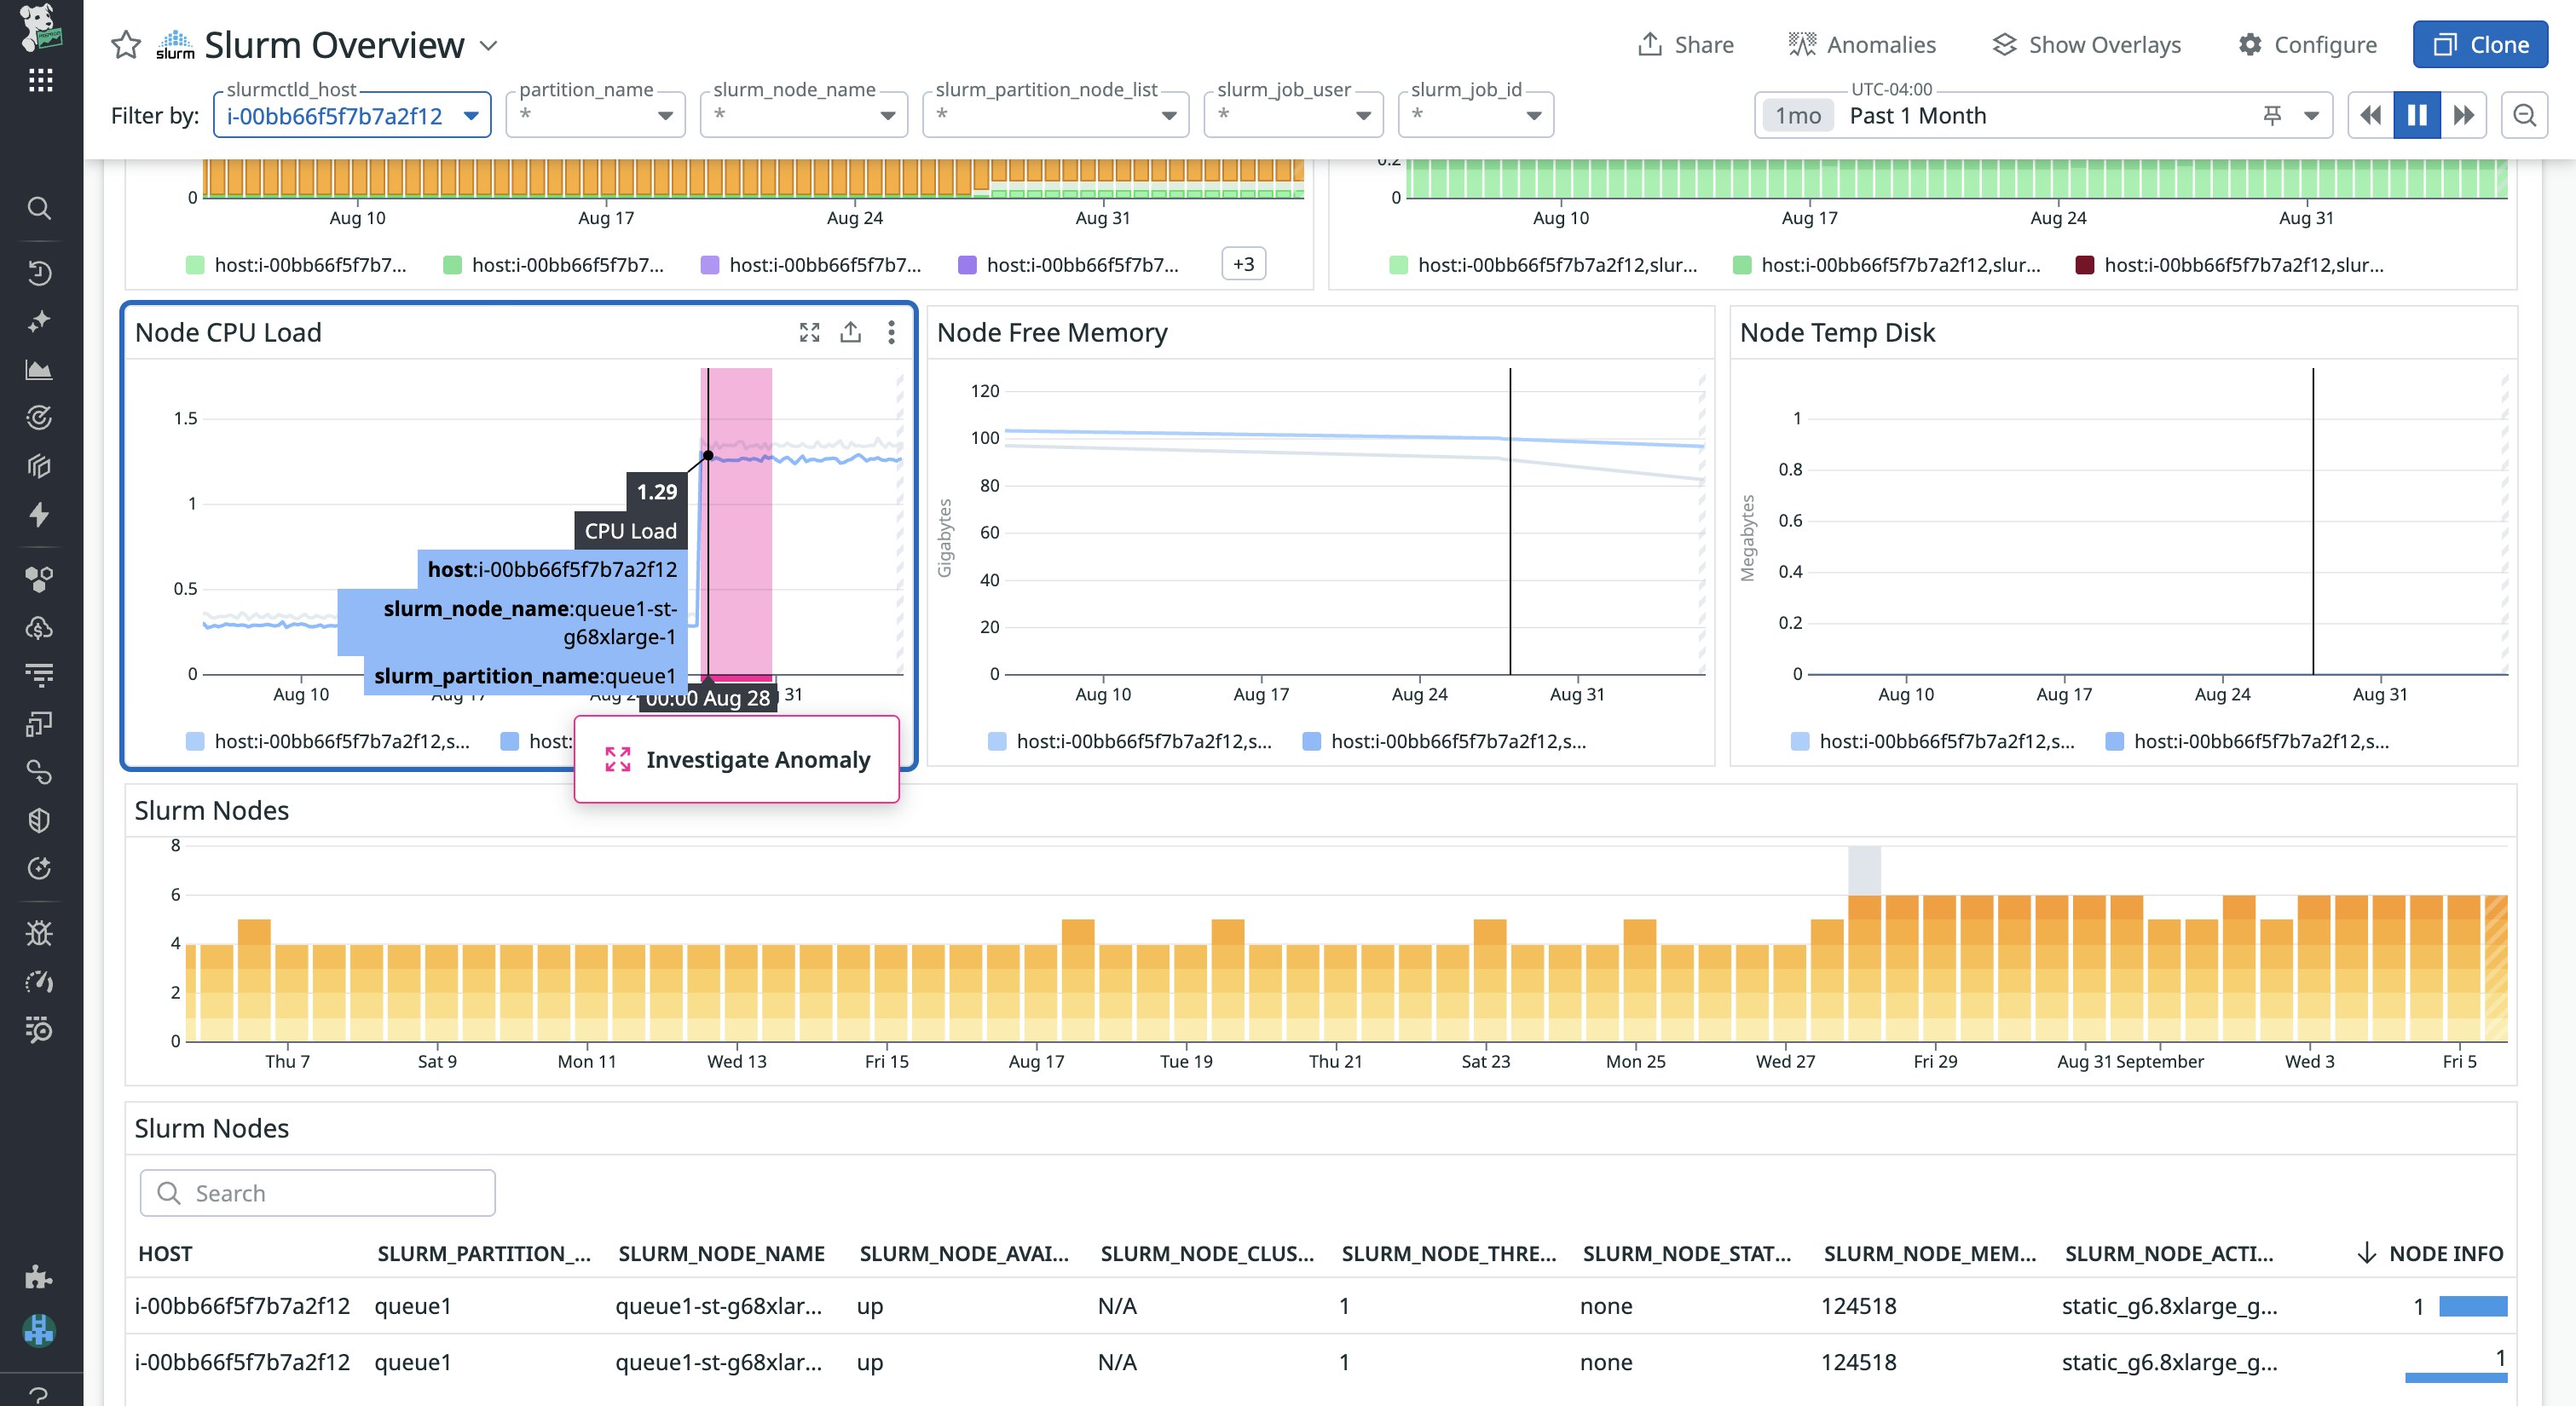
When scheduling jobs, you need to tell Slurm the amount of memory and CPU cores to allocate for each task. However, if these requested resources aren’t sized appropriately relative to the actual host usage, it can result in wasted resources (over-requesting) or slow runtimes and possible OOM failures (under-requesting). In the example below, we see a sudden spike in our node CPU load. By querying Slurm to check our job’s requested CPU usage, we can compare it to the spike in our host CPU load to see whether the spike is normal utilization or due to Slurm oversubscribing resources.
Gain admin-level insights into your Slurm controller
If you’re a Slurm admin for your organization, rather than monitor the outcomes of specific jobs, you’re more likely to take interest in ensuring that Slurm is scheduling jobs as intended and that your cluster’s control plane is stable. You can gain deep insights into these systemic health metrics by monitoring Slurmctld Execution Metrics; metrics in this section can often help indicate what Slurm component is bottlenecking your system under load.
For instance, if you notice a high and sustained number of active slurmctld threads but jobs still remain pending or you experience RPC retries, slurmctld likely is unable to keep up with scheduling the influx of jobs, despite resources being available. In this case, as an admin, you can scale up the controller node and look to reconfigure your scheduler parameters, such as the number of jobs per backfill cycle (Backfill Stats are also available in the dashboard).
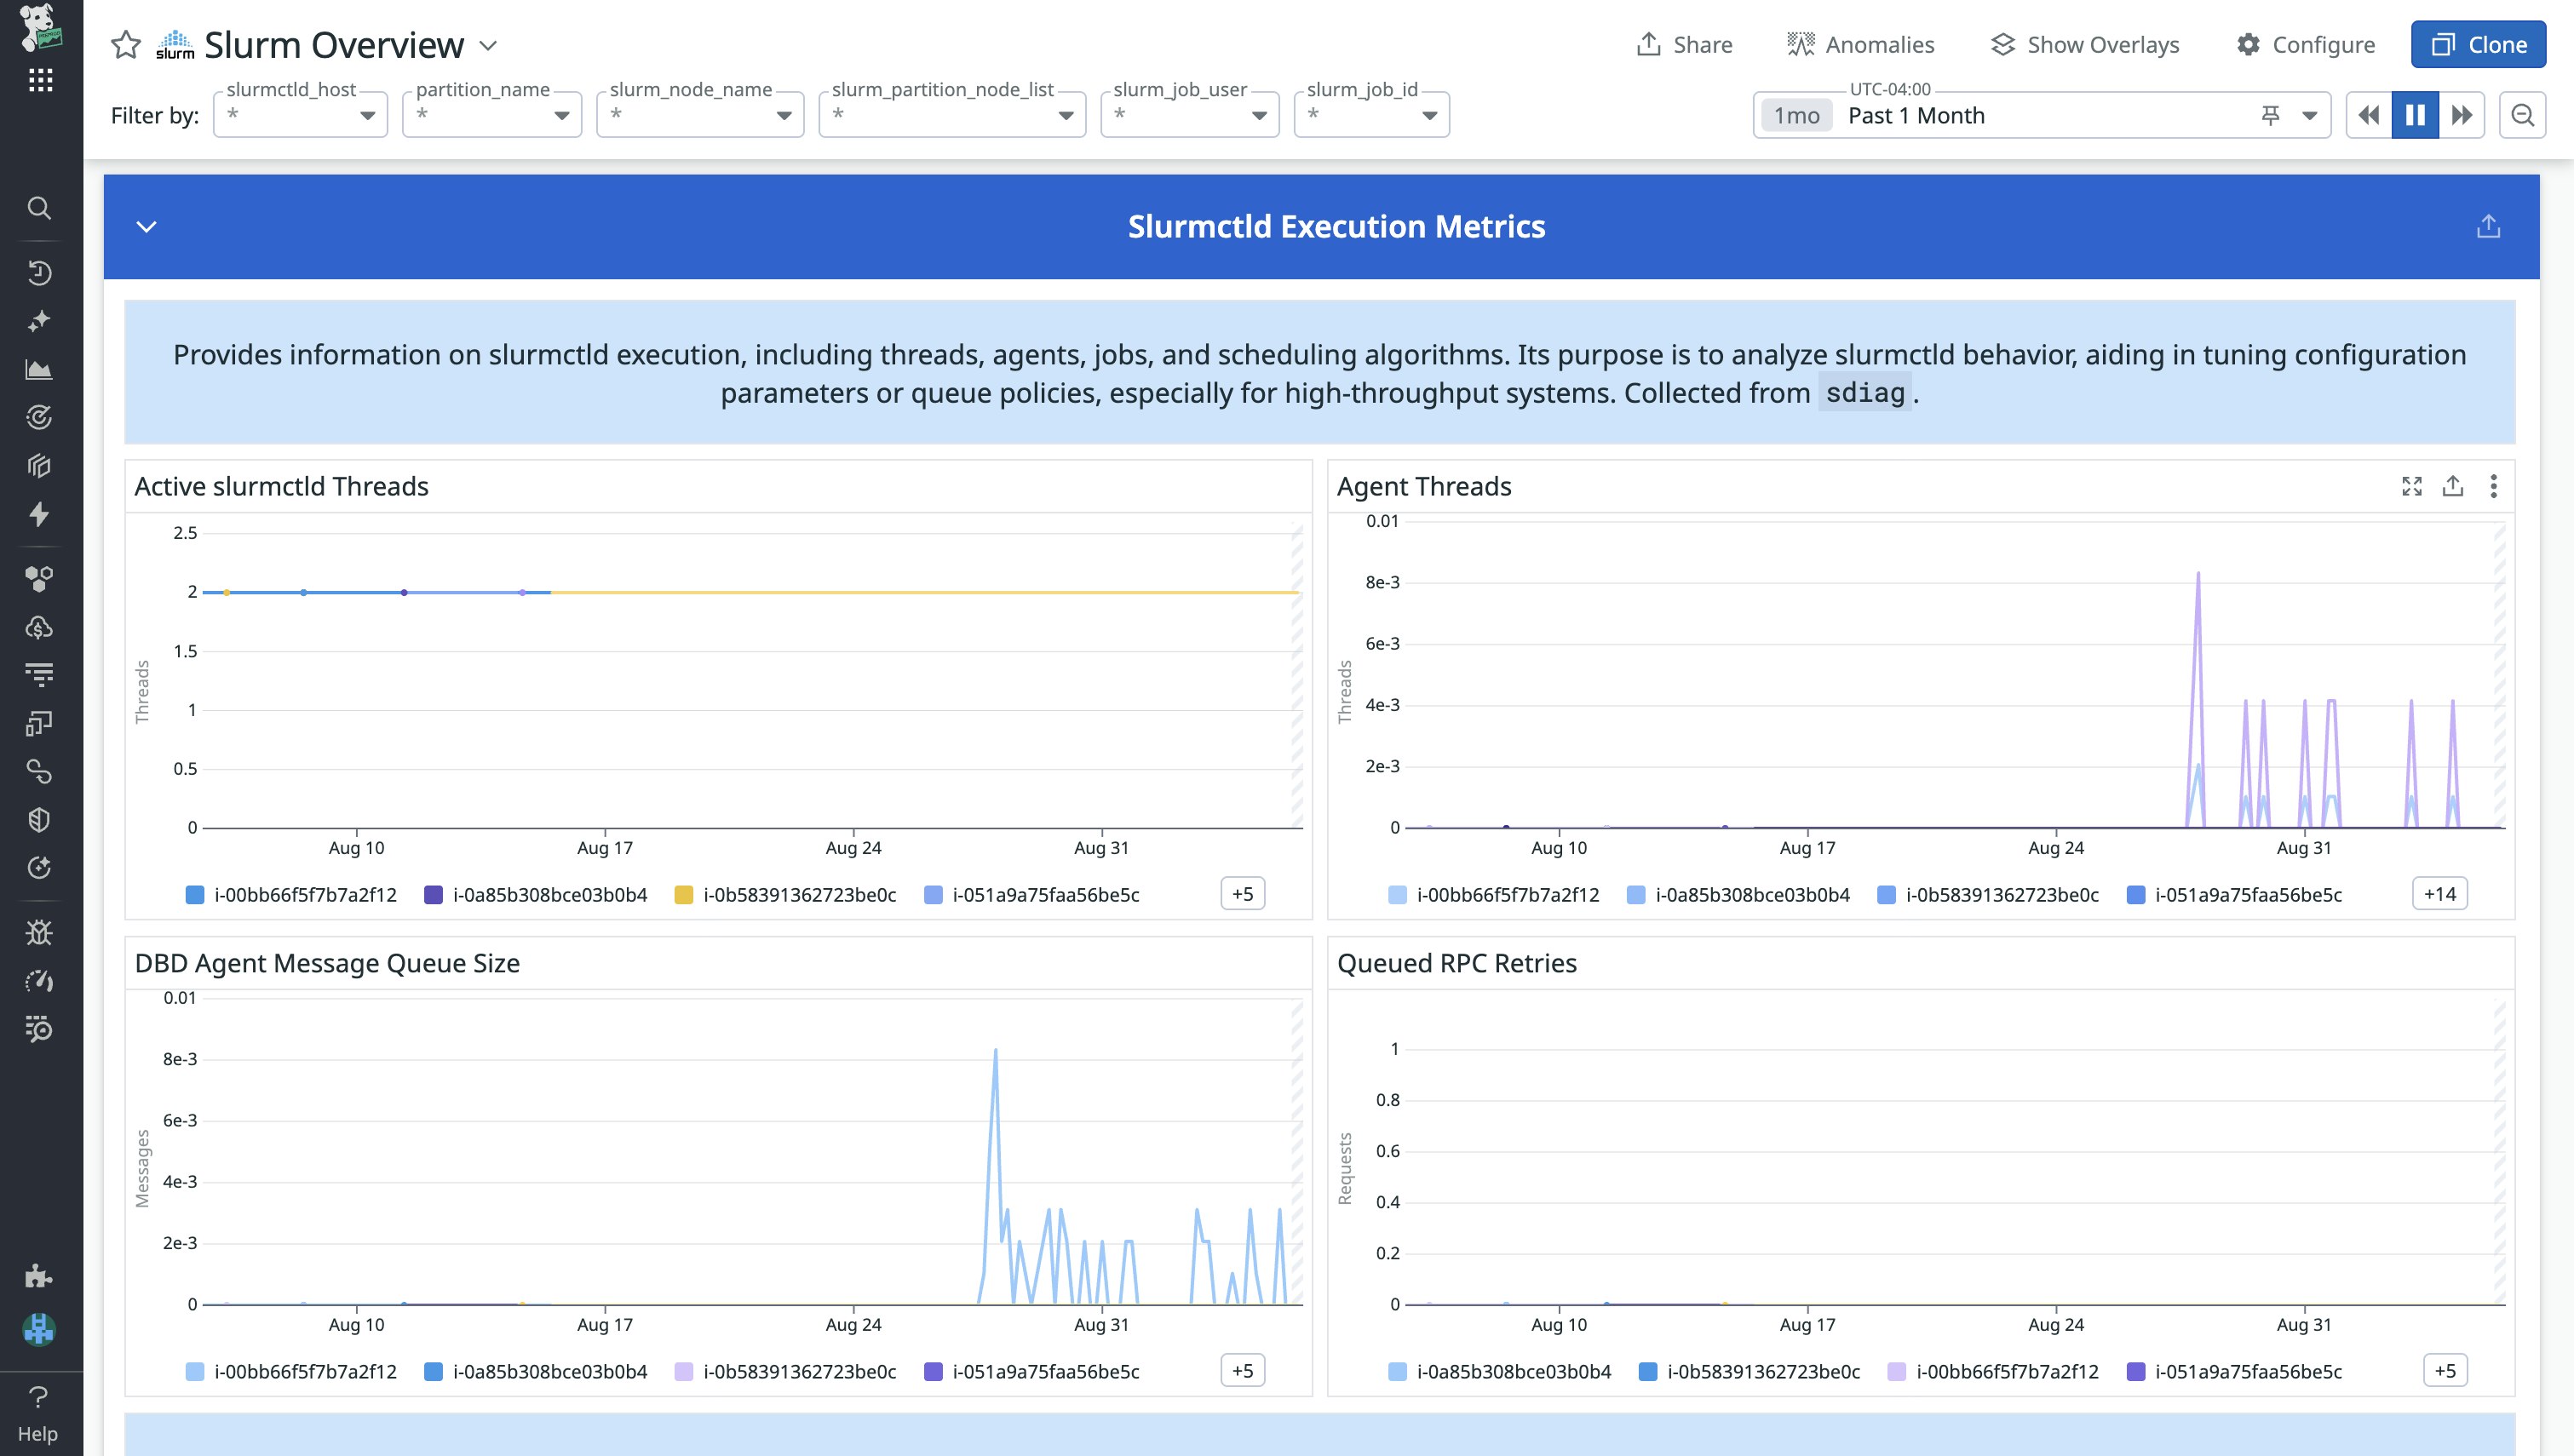
On the other hand, if you notice that your DBD Agent Message Queue Size begins to grow without self-resolving, this indicates that slurmctld is generating events faster than they can be recorded. When slurmctld generates events, such as assigning a job, this event is recorded by slurmdbd, which writes the event to an underlying database. In the case of a growing DBD agent message queue, you’ll need to determine whether the bottleneck is due to network connection, slurmdbd, or the performance of the underlying database. To do so, you can try scaling up the node slurmdbd is running on and attempt to increase its concurrency, and then investigate the explain plan of slow-running queries in Datadog Database Monitoring.
Get started with Datadog
Datadog’s Slurm integration provides valuable metrics for both developers and system admins alike, enabling you to troubleshoot pending and slow-running job issues and monitor the systemic health of your HPC clusters. Monitoring HPC systems can extend far beyond schedulers such as Slurm. Datadog’s integrations with Nvidia DCGM Exporter, Lustre, InfiniBand, and more enable you to gain visibility into GPU, parallel file system, and network components so that you can build a comprehensive view of your HPC. To learn more about our integration, check out our documentation.
If you don’t already have a Datadog account, sign up for a free 14-day trial today.


